Outdated architecture diagrams and static code analysis can miss how services are connected at runtime, so the OpenTelemetry plugin builds a Service Map from live telemetry. With a lightweight local OpenTelemetry backend, the plugin supplies standard OTel environment variables, receives application spans, and continuously updates an internal architecture model that the IDE renders on demand. Its stream-processing algorithm classifies spans through semantic attributes, identifies services, matches HTTP CLIENT and SERVER spans across propagated trace context, and infers database or messaging dependencies while retaining unmatched spans in memory. Because spans can arrive out of order and traces have no definitive finish signal, the map is incrementally reconstructed rather than built from complete traces; the result is a language- and vendor-agnostic view for OpenTelemetry-instrumented applications across several JetBrains IDEs.
Context
The Service Map addresses stale architecture diagrams and the limitations of static analysis by reconstructing service relationships from telemetry produced by a live application. It is available through the OpenTelemetry plugin in JetBrains IDEs and can represent HTTP requests, database requests, and message queues.
Approach / What changed
The plugin starts a lightweight local OpenTelemetry backend and provides standard OTel environment variables so an instrumented application sends spans to it. The backend processes each span as it arrives, classifies interactions from semantic attributes, identifies services, matches HTTP CLIENT and SERVER spans through trace context, infers database dependencies, handles messaging relationships, and incrementally updates the model rendered by the Service Map.
Takeaways
1
The reconstruction algorithm processes spans immediately instead of waiting for complete traces, which is necessary because span order is not guaranteed and traces have no explicit completion signal.
2
HTTP dependencies are connected by matching CLIENT and SERVER spans through parent-child trace context; unmatched partner spans are kept in memory until the corresponding span arrives.
3
Database and messaging dependencies use different inference rules: database nodes can come from a single CLIENT span, while messaging may use parent-child relationships or span links.
FAQ
How does the Service Map handle spans that arrive out of order?
It processes every span as soon as it arrives and incrementally updates the architecture model. If a partner span is missing, the backend keeps the span in memory and connects the services when the other side appears.
How does the plugin identify an HTTP connection between services?
An outgoing HTTP operation produces a CLIENT span and the receiving service produces a SERVER span. Propagated trace context makes the SERVER span a child of the CLIENT span, allowing the backend to match the two.
What instrumentation is required for the map to work across languages?
Applications and libraries must emit spans according to OpenTelemetry’s expected conventions and propagate context correctly. The feature is described as language- and vendor-agnostic and is intended for OpenTelemetry-instrumented applications across JVM, .NET, Python, Go, and other stacks.
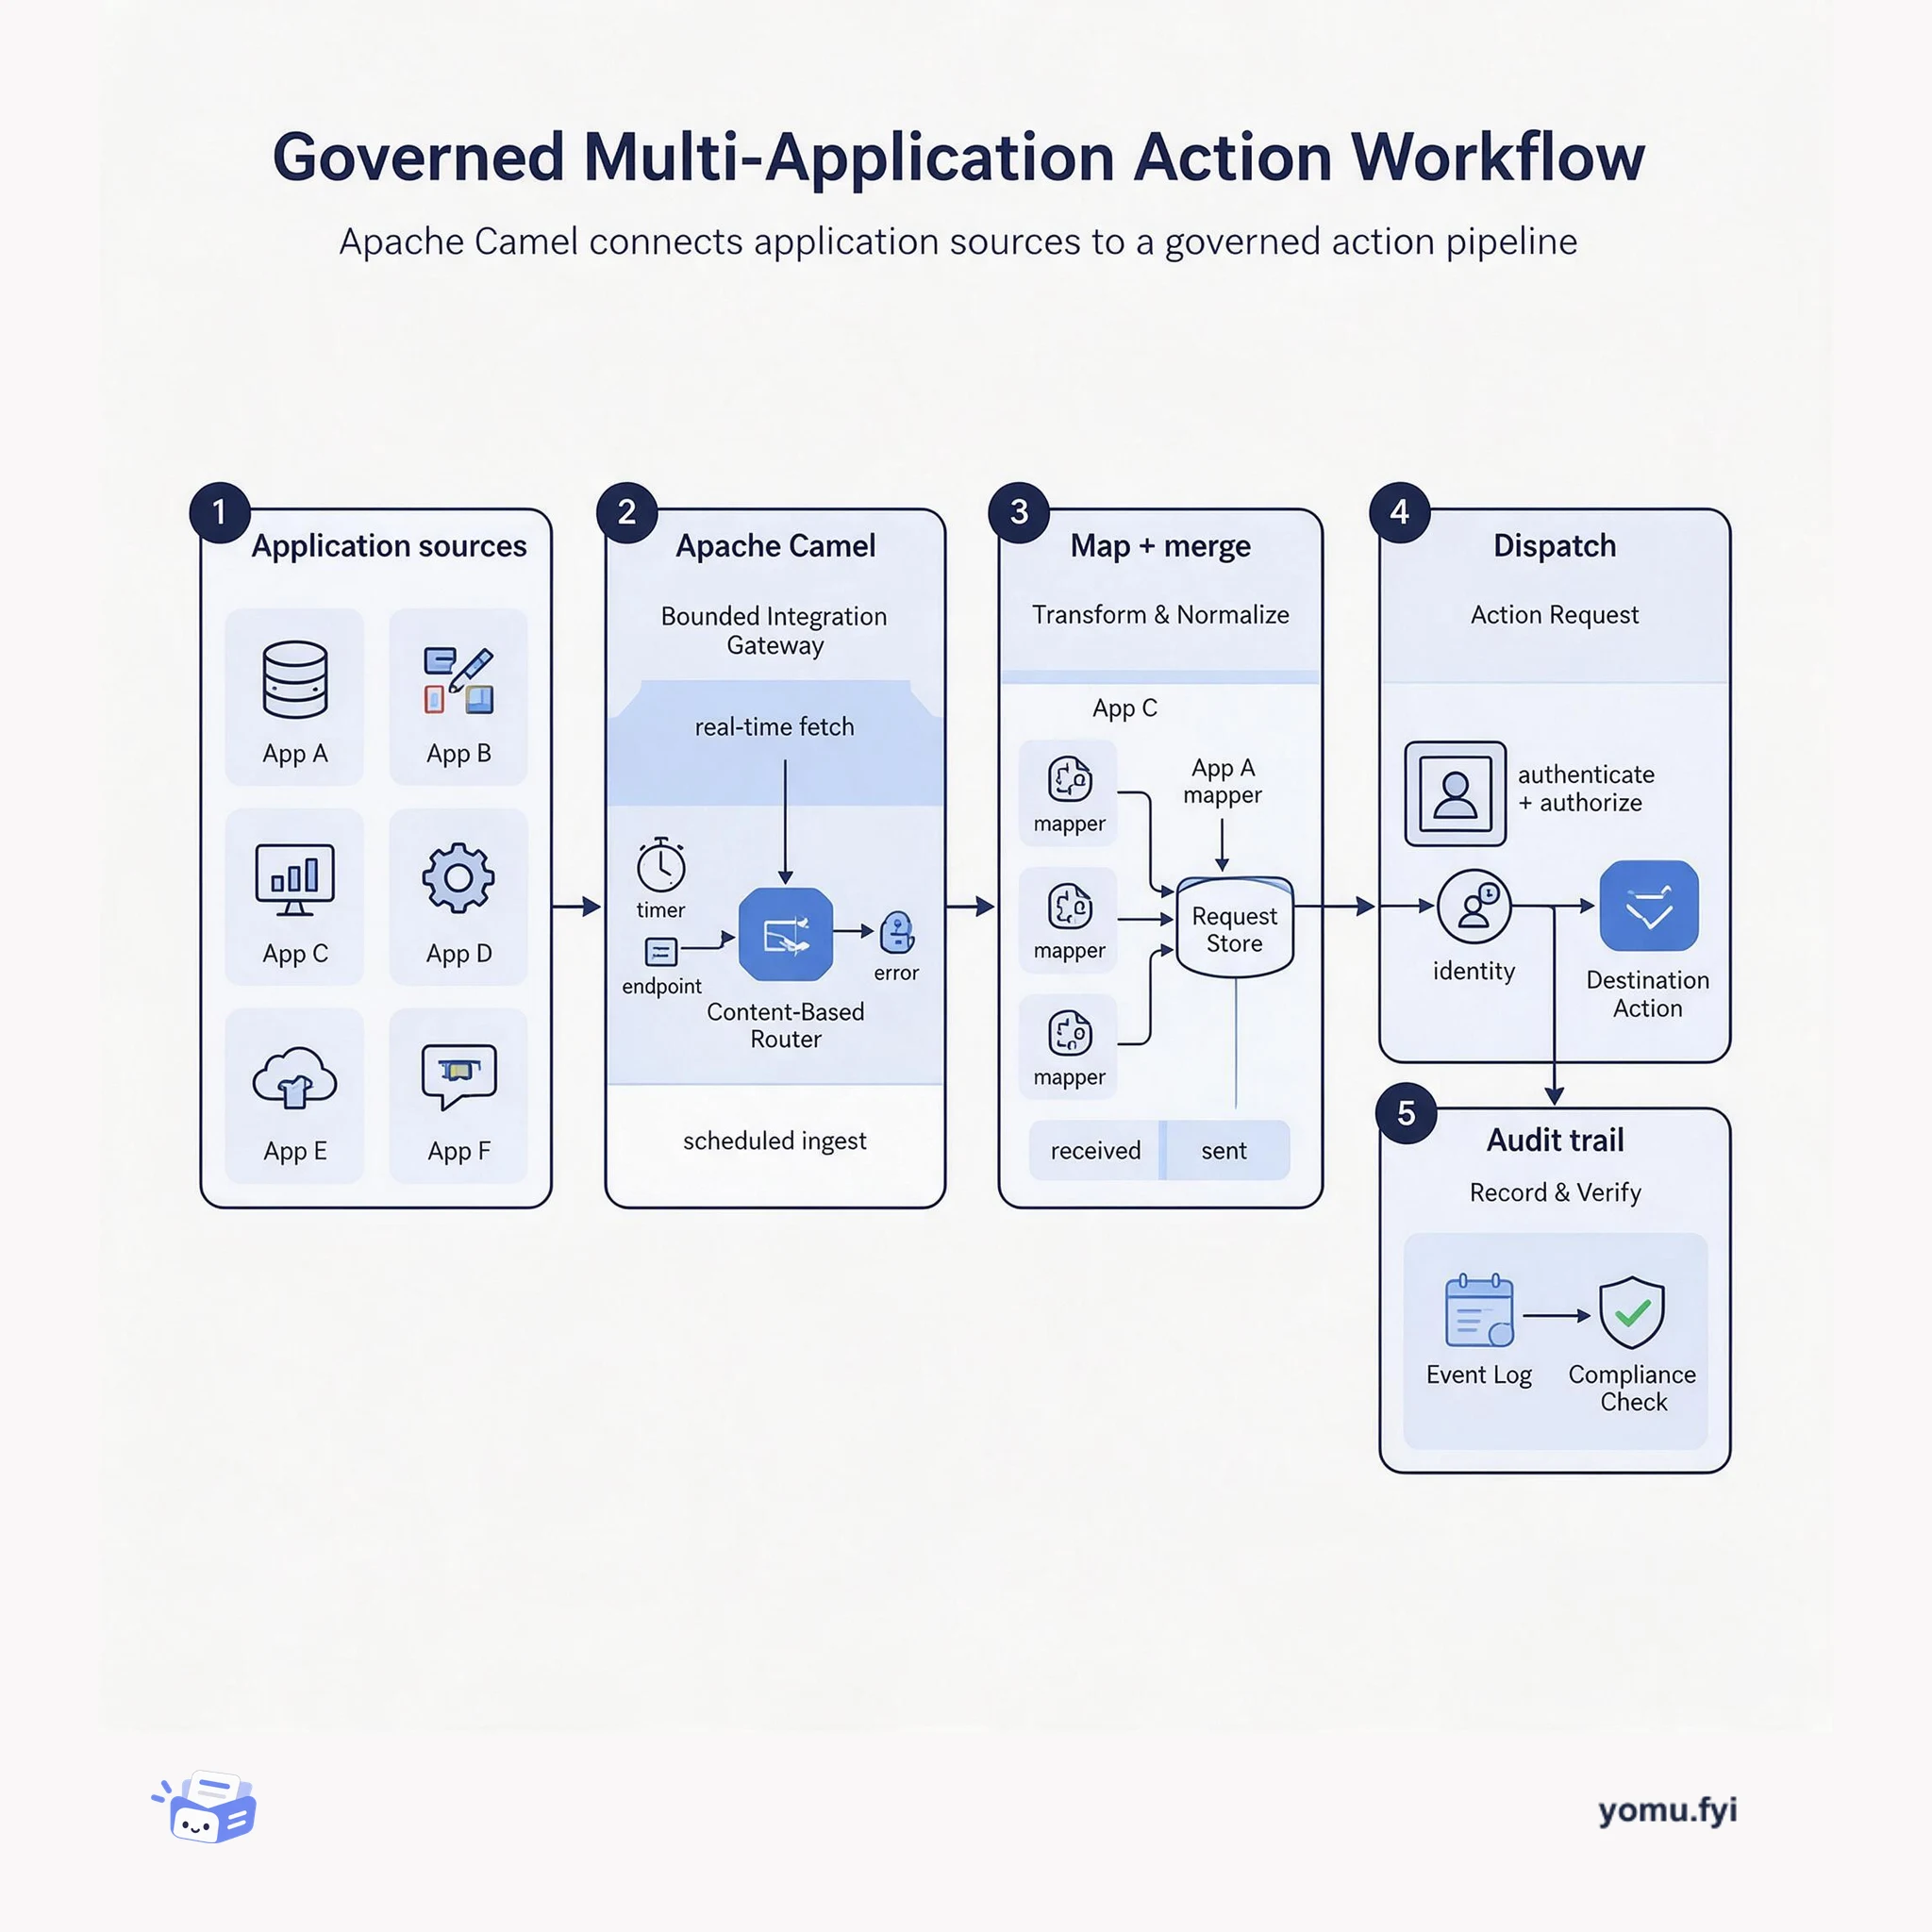
Apache Camel is shown as the integration path that brings application actions into one request workflow. The diagram clarifies real-time versus scheduled ingestion, mapping, merging, authorization, and audit.
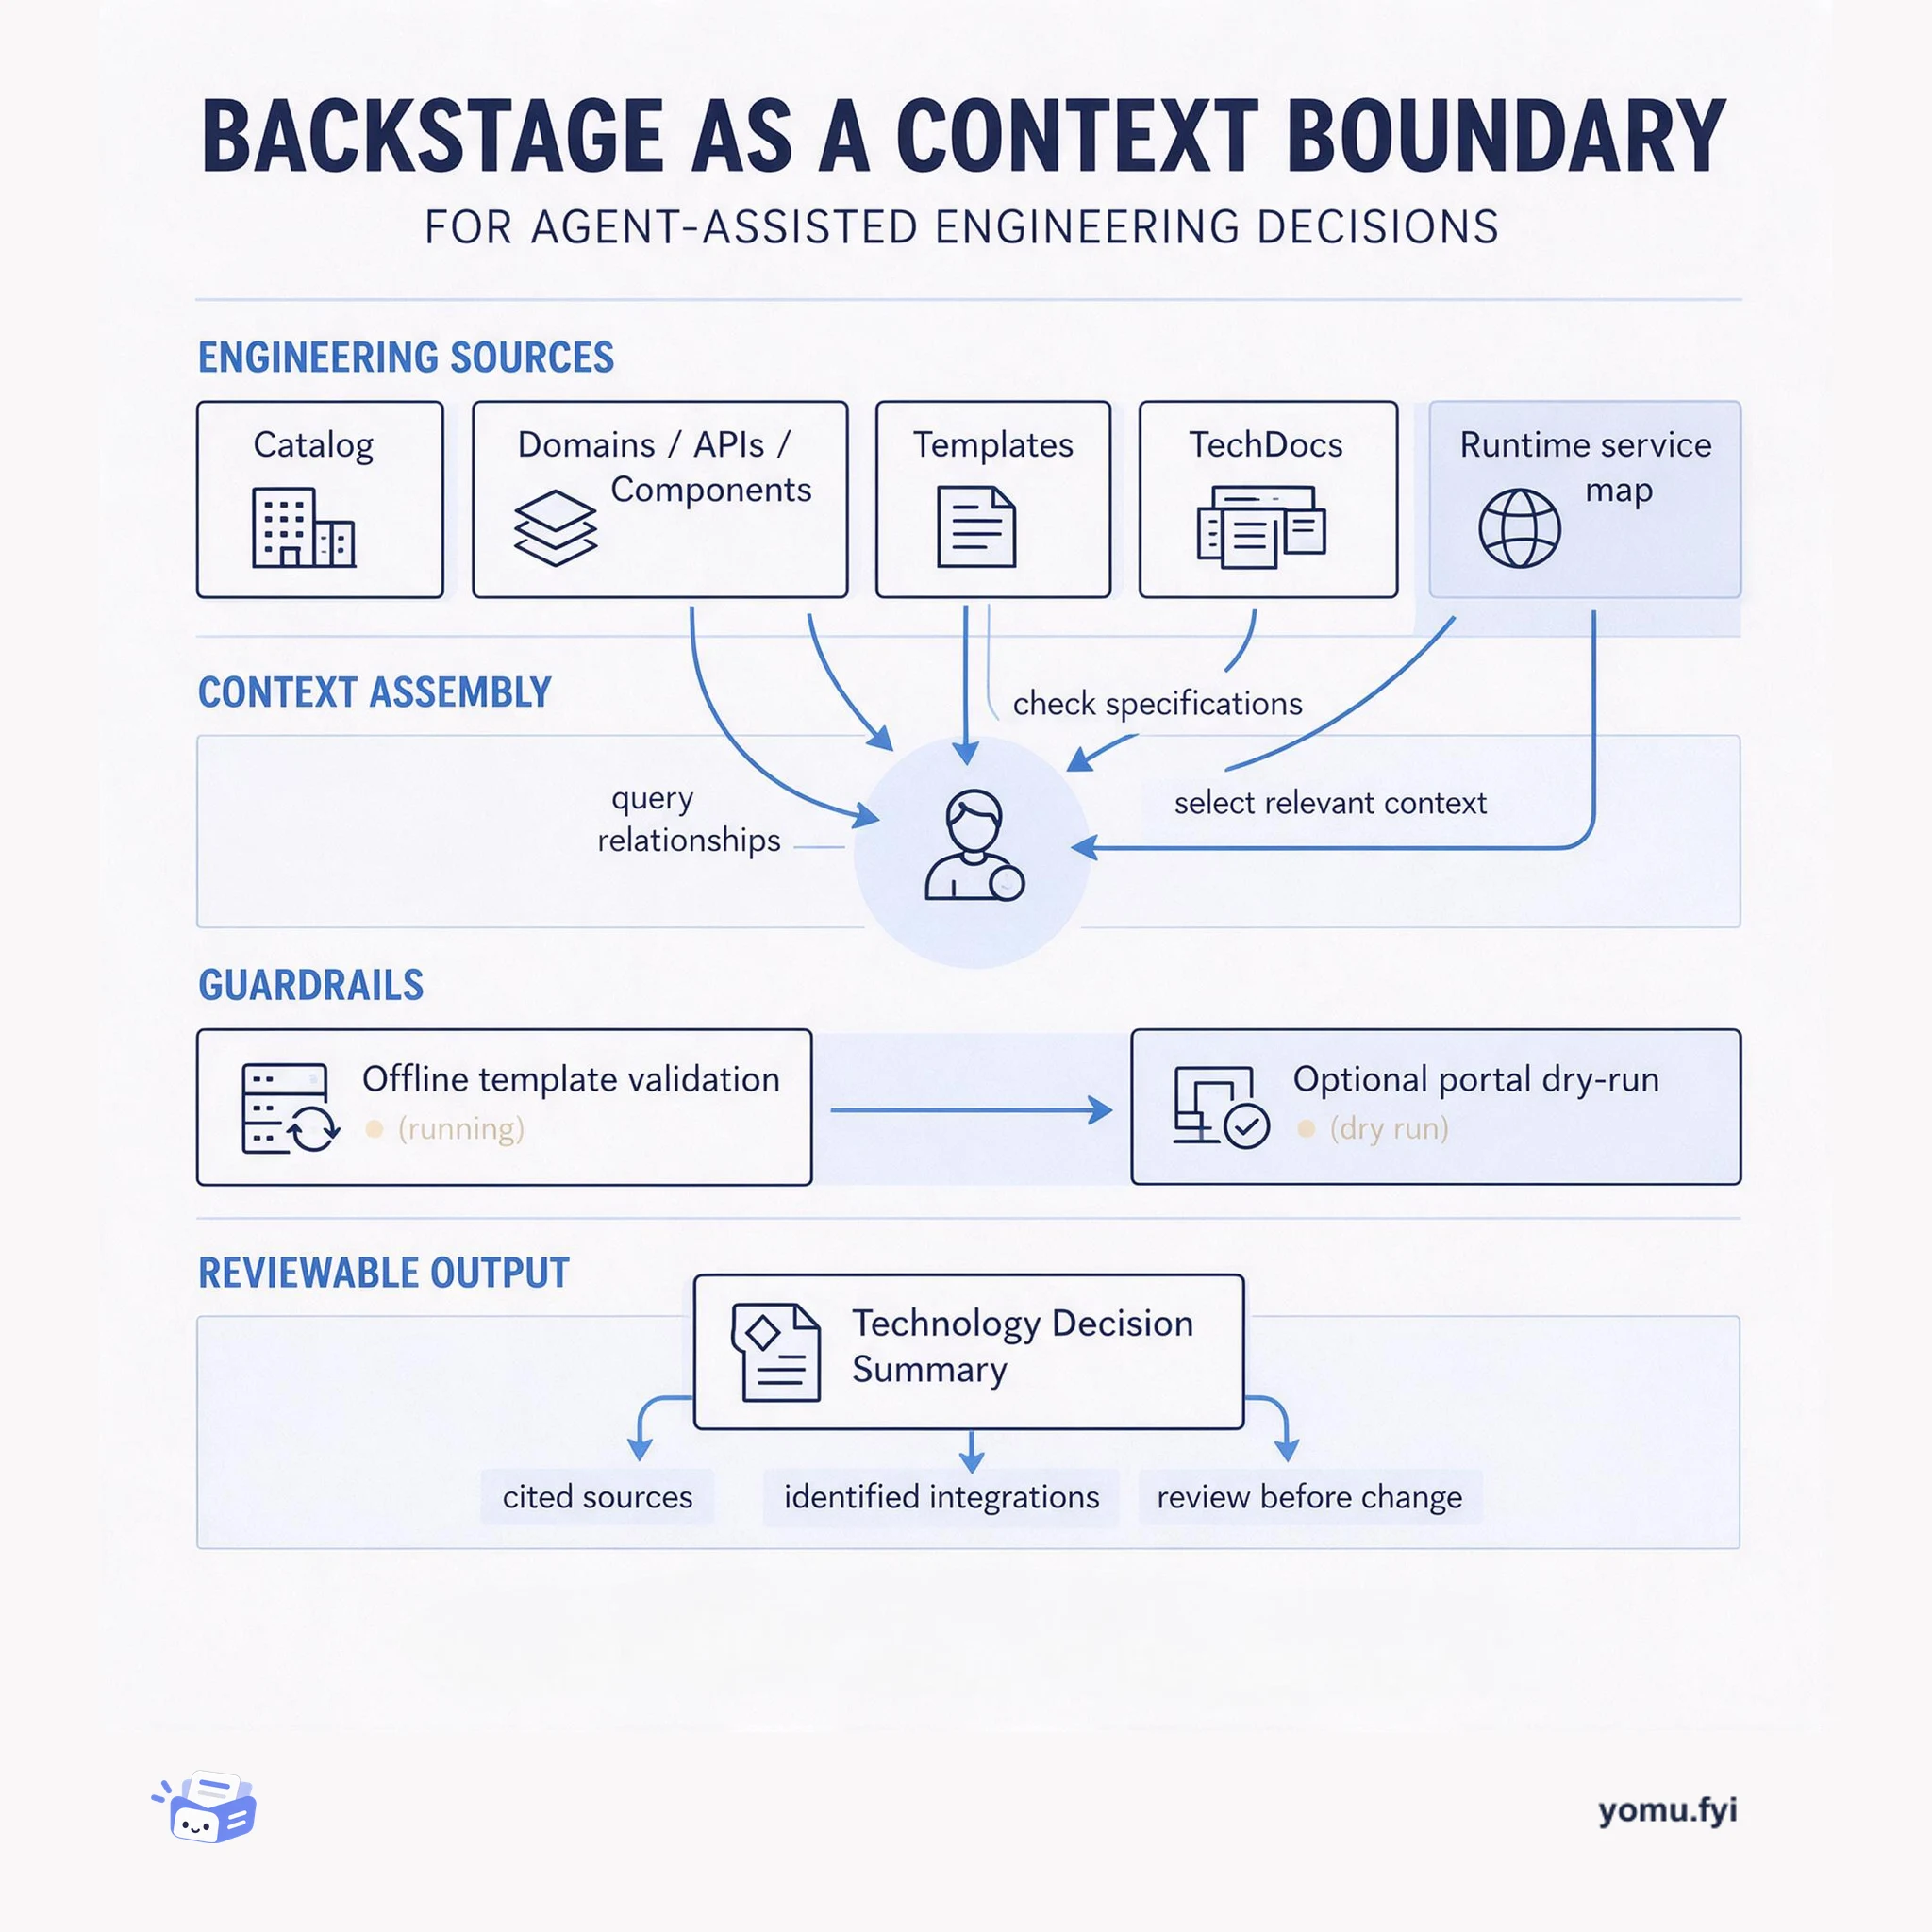
Backstage can act as an engineering context boundary: catalog entities, templates, and TechDocs inform an agent before it proposes changes. See where validation and review fit.
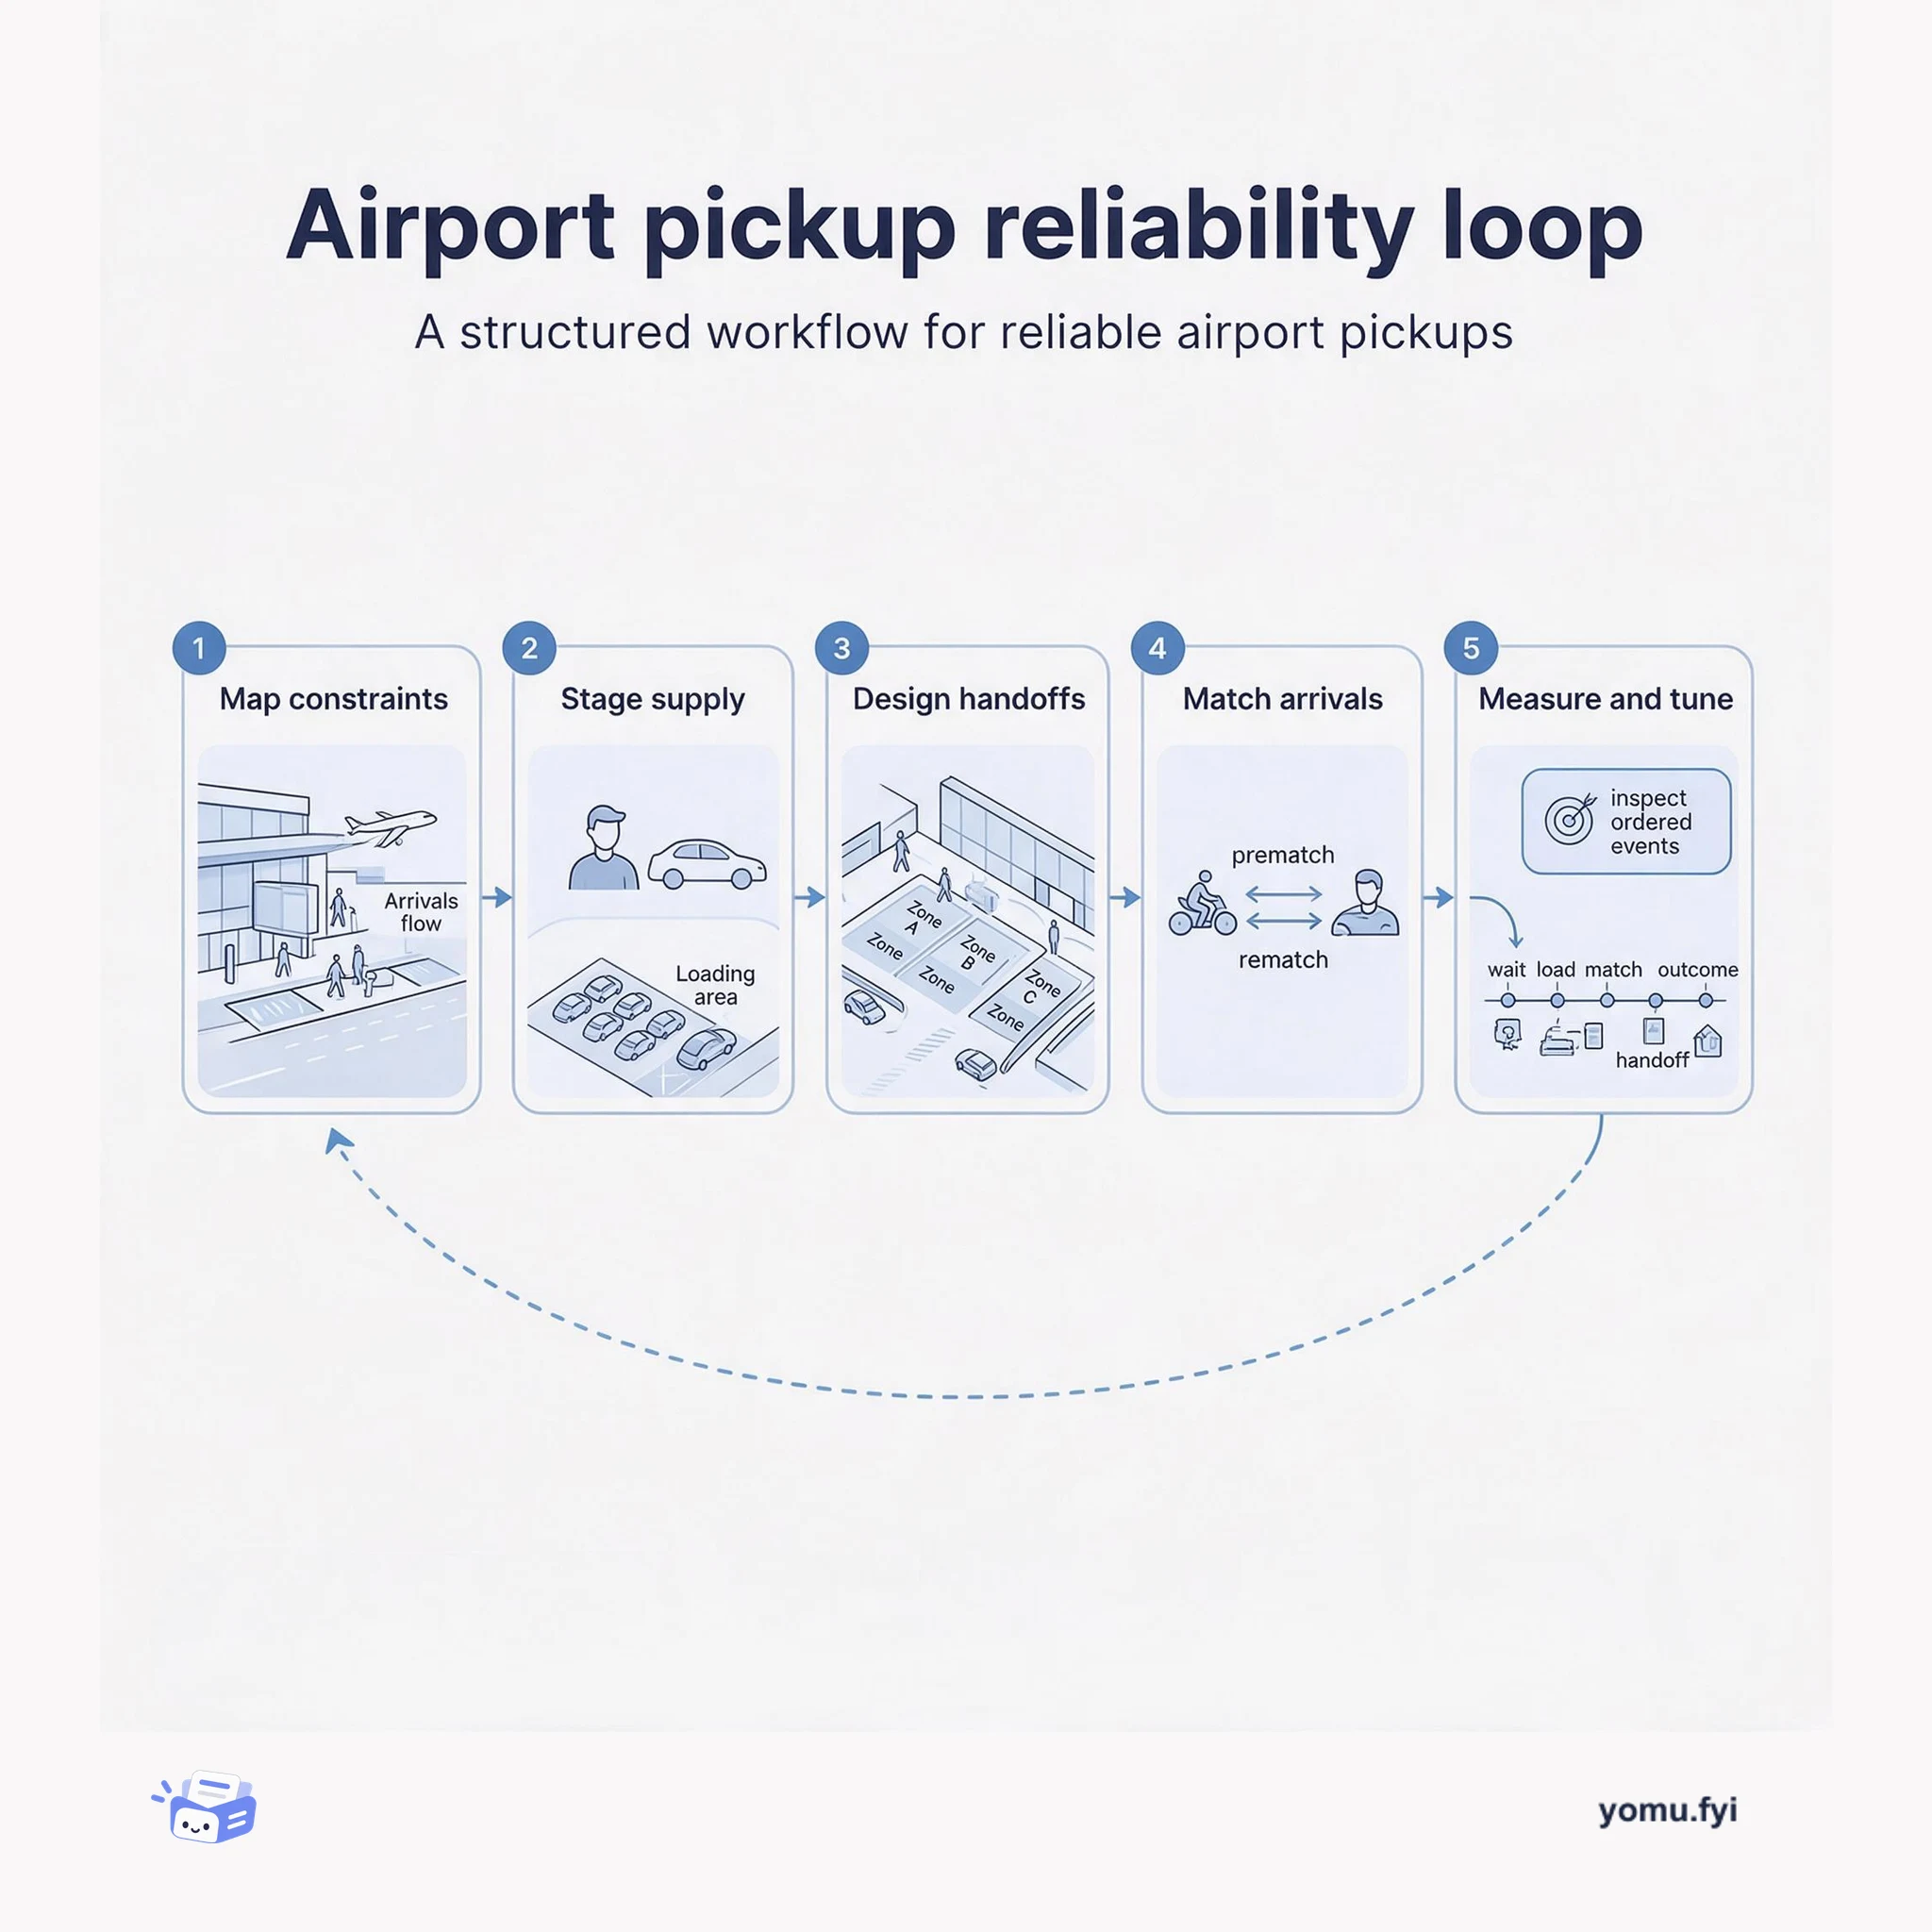
A practical checklist for designing reliable airport pickups: map curb constraints, stage drivers, simplify matching, and measure each handoff so improvements target the real bottleneck.
Keep reading
Related reading
The Good Stuff
Paid picks we use ourselves. Links carry a referral code — a subscription through one earns us a commission at no extra cost to you.