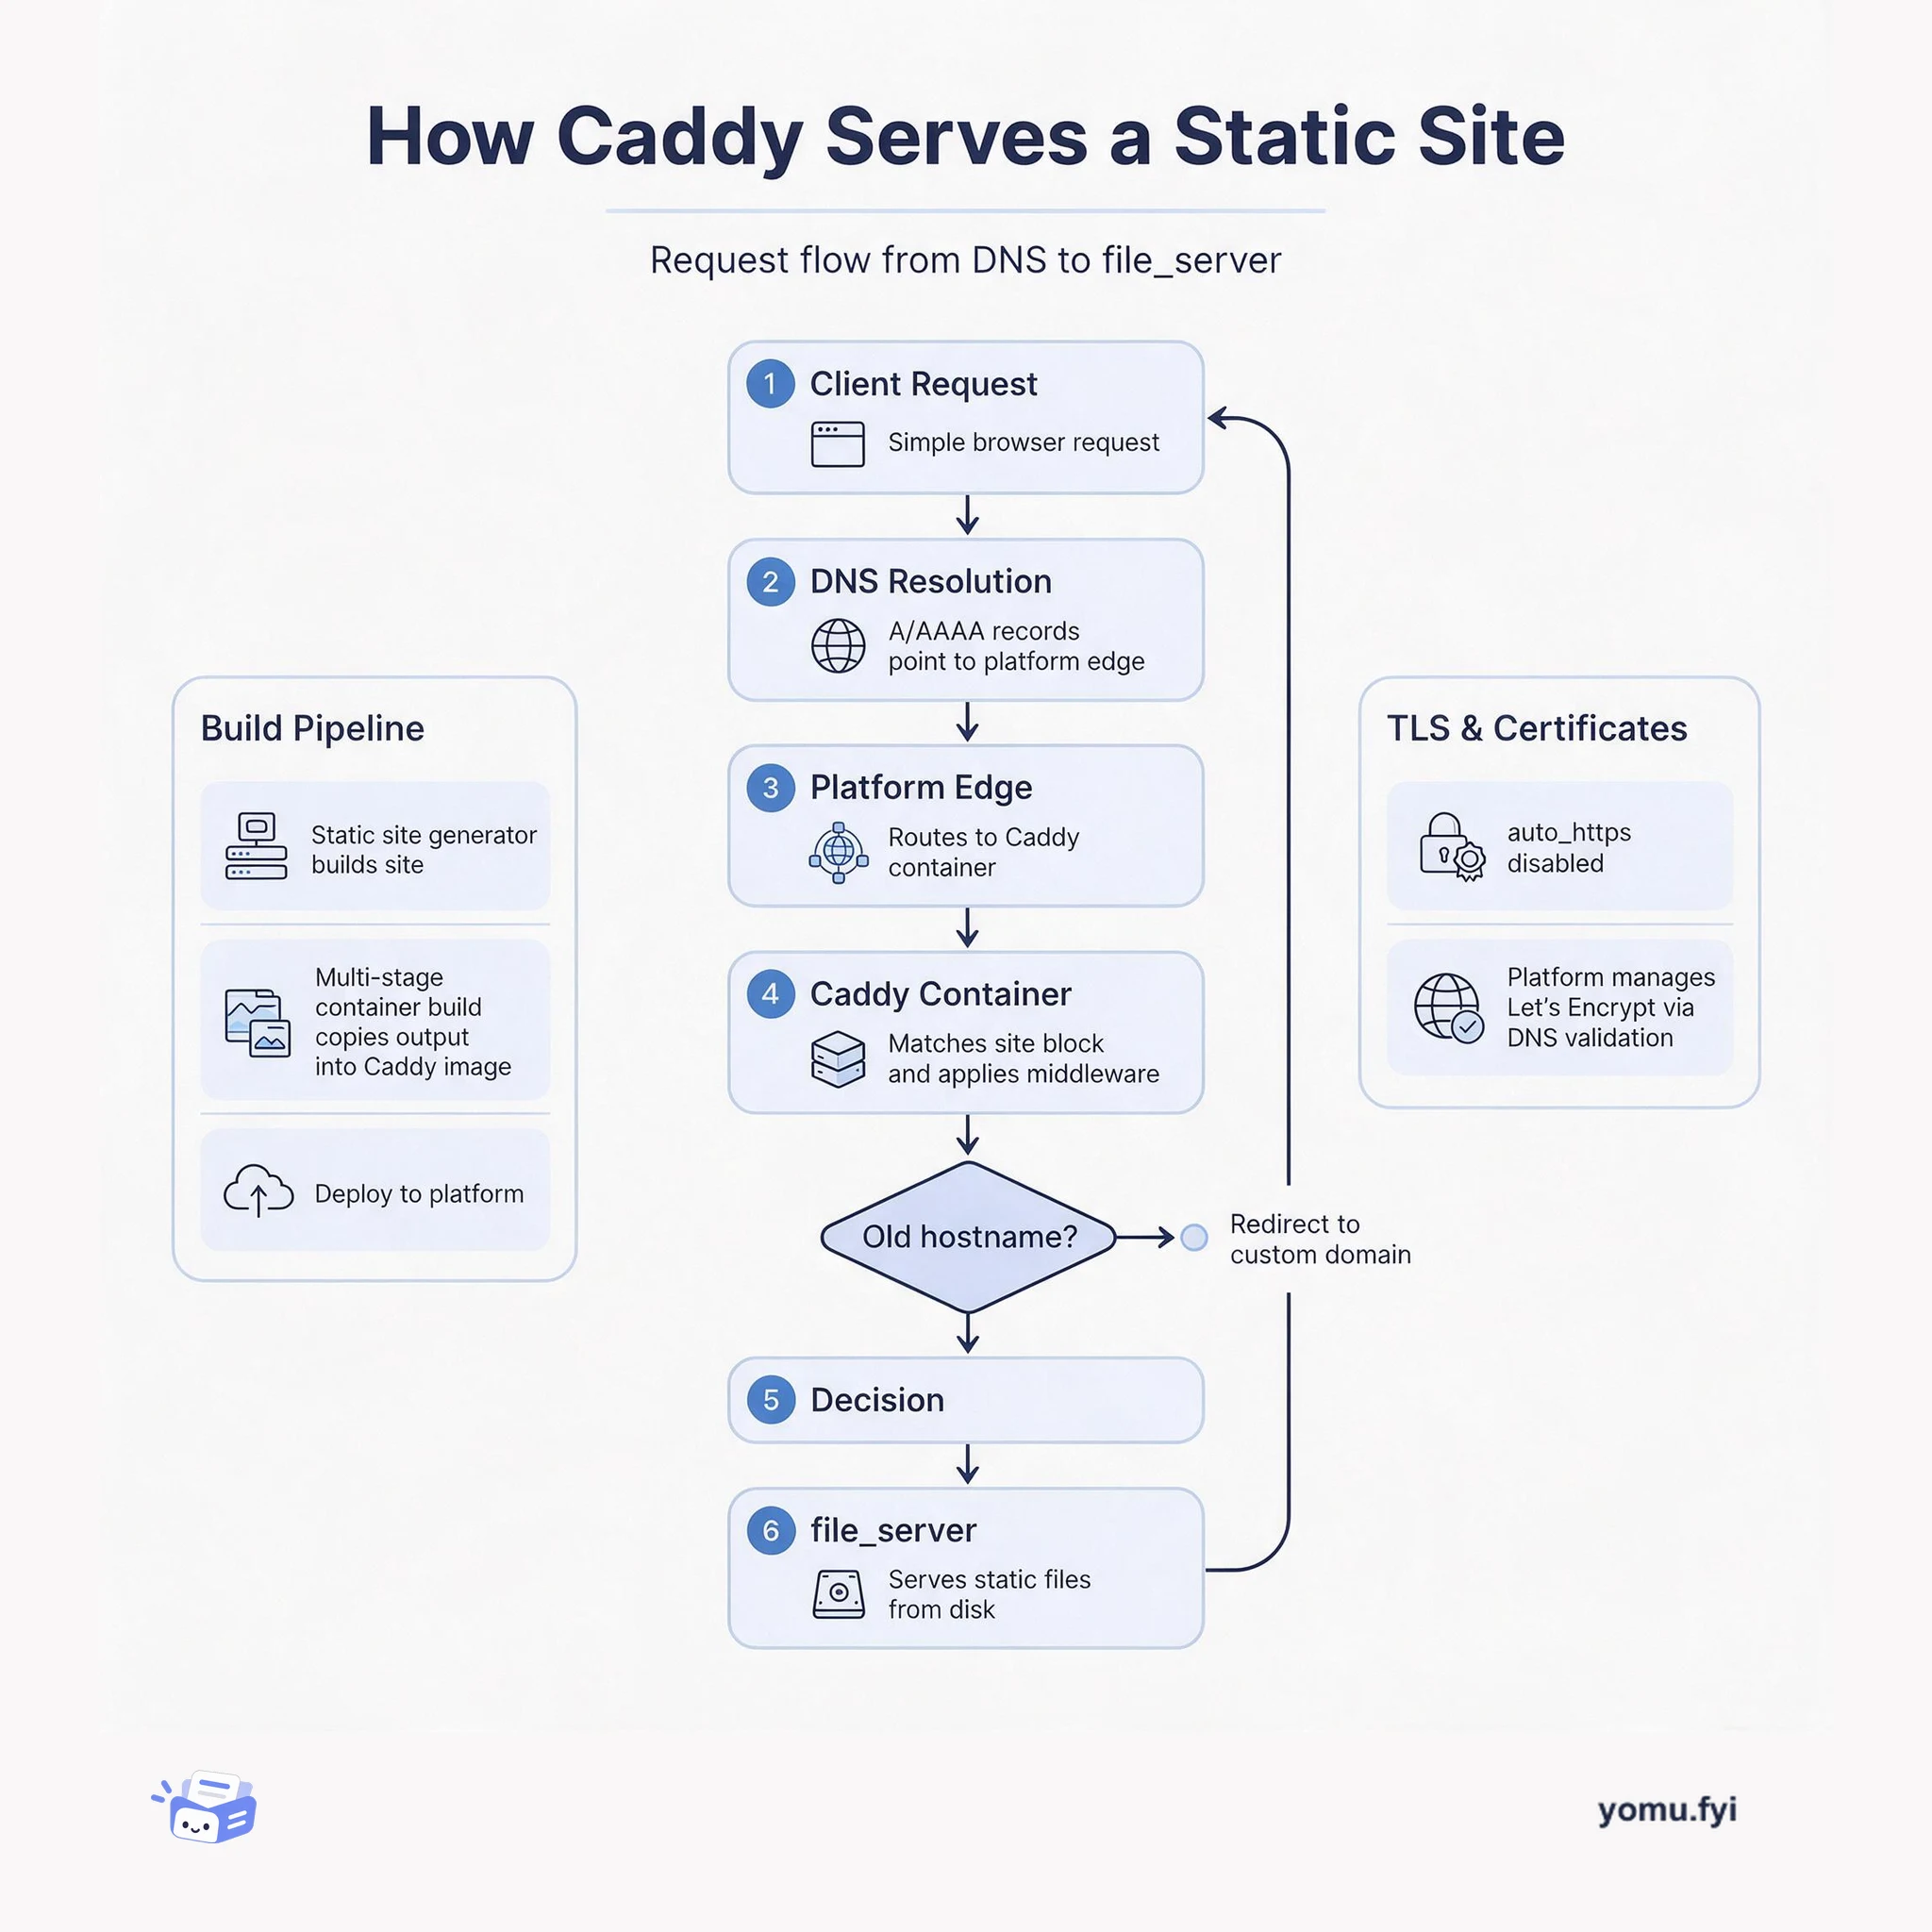
How Caddy Serves a Static Site: The Request Flow
See how Caddy handles a request for a static site, from DNS resolution through container routing to file_server, and how TLS and redirects fit into the flow.
 CloudflareDominik PichetaAnnouncement
Cloudflare introduced on-demand CPU and memory profiling for Workers and Durable Objects, accessible via the CLI or the Dashboard’s Observability page. Users can generate interactive flamegraphs and download pprof files, with each rectangle’s width representing CPU time or memory usage over a chosen duration. Profiling the R2 binding Worker revealed that genericR2JsonReplacer, called by JSON.stringify, processed nested values multiple times; fixing it made the function 2.7x faster. A different Worker with P999 memory at 133 MB (above the 128 MB limit) was found to have a partially enabled Prometheus code path accounting for 66.7% of allocations; disabling it reduced P999 memory to 118 MB and eliminated out-of-memory errors. The profiling system locates the correct data center and isolate for the Worker or Durable Object, and continuous profiling is being developed to automatically capture samples without manual initiation.
Developers previously lacked the ability to profile Workers and Durable Objects in production, relying on logs and metrics that could not pinpoint specific functions causing high CPU or memory usage.
Cloudflare introduced an on-demand profiler that can be started on a specific Worker version or Durable Object via CLI or Dashboard. The profiler runs for a user-specified duration, captures CPU or heap allocation samples, and renders them as interactive flamegraphs. The infrastructure locates the correct data center and isolate where the Worker or Durable Object is running.
The on-demand profiler captures CPU or heap samples of a specific Worker version or Durable Object in production and displays them as interactive flamegraphs.
Profiling the R2 binding Worker identified that genericR2JsonReplacer processed nested values multiple times; fixing it made the function 2.7x faster.
A Worker with memory issues had a partially enabled Prometheus code path consuming 66.7% of allocations; removing it reduced P999 memory from 133 MB to 118 MB and eliminated out-of-memory errors.
You can start via the CLI using `cf workers versions profile latest` with flags for Worker ID, duration, and profile type, or through the Cloudflare Dashboard by navigating to the Worker's Observability tab, selecting 'Flamegraph', and specifying duration and version.
Yes, when profiling a Durable Object you can choose by name which object to profile. The runtime routes the profiling request to the metal that owns the specific actor and profiles the isolate running that object.
You must explicitly start the profiling session, which may cause you to miss misbehavior periods. The memory profiler only shows allocations within the profiling window, so start-up allocations are not captured.
Summaries are generated from the original by a language model. Check the original before relying on it.
See the idea
See how Caddy handles a request for a static site, from DNS resolution through container routing to file_server, and how TLS and redirects fit into the flow.
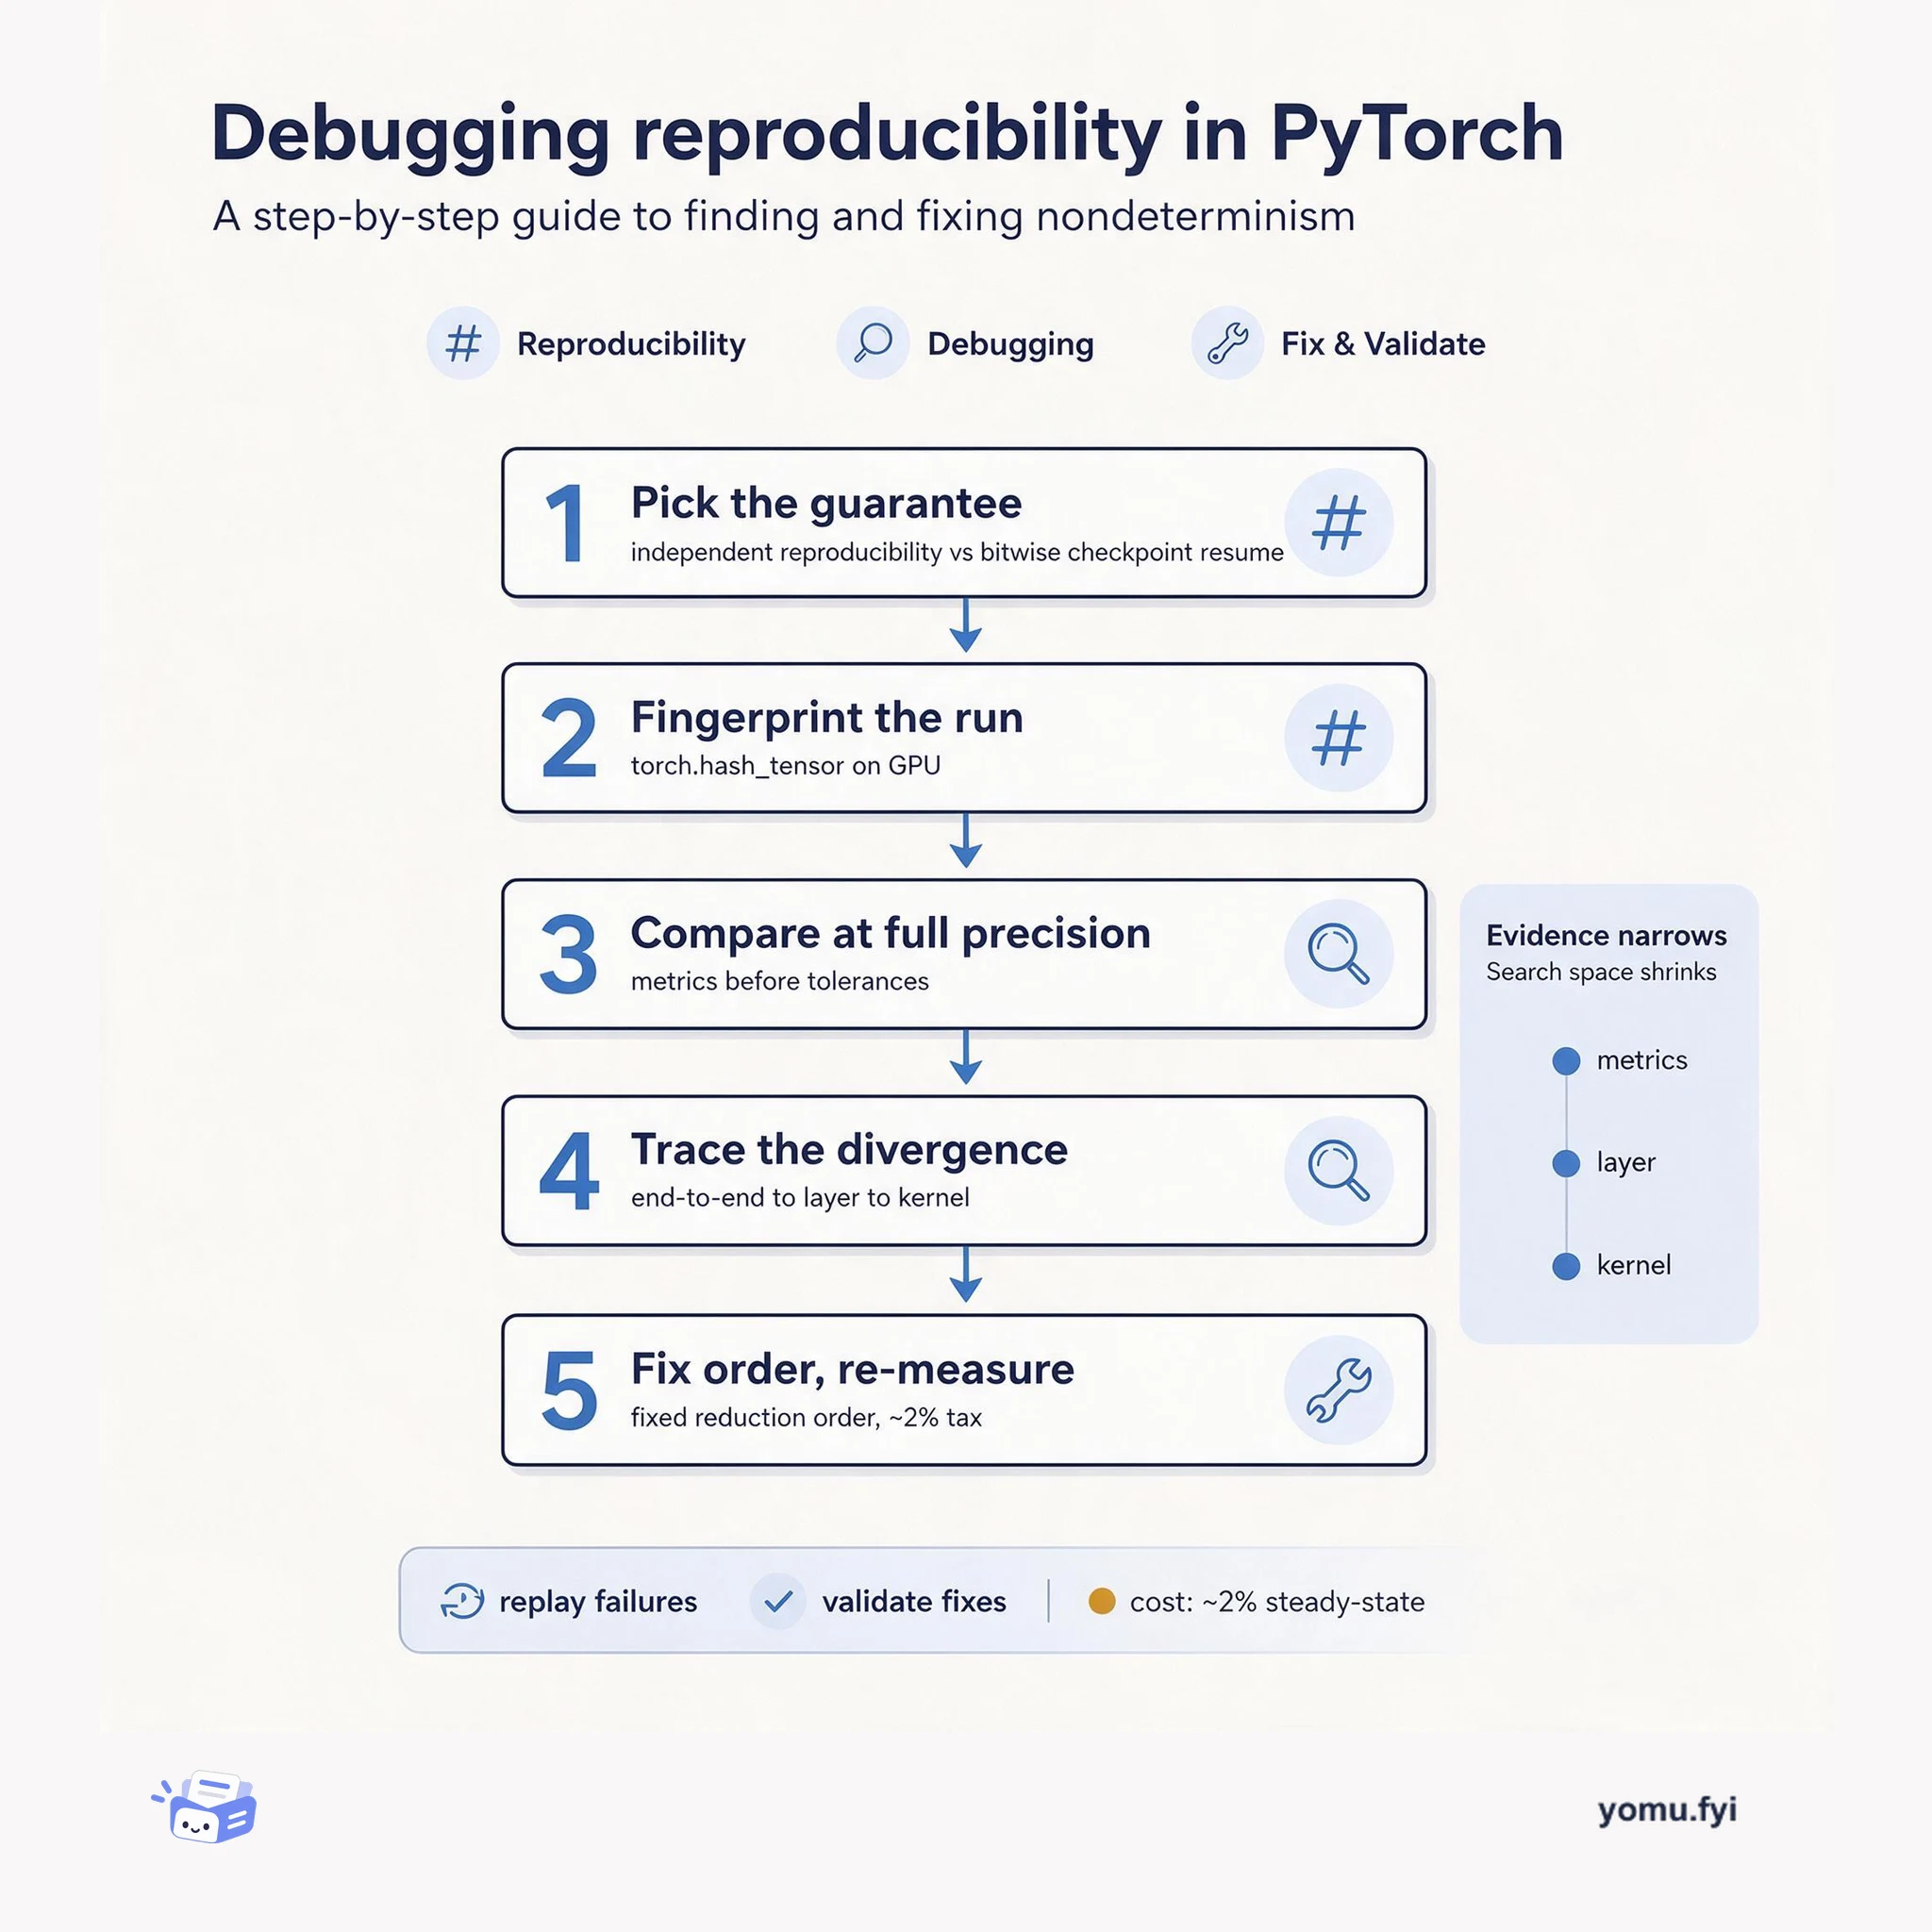
A five-checkpoint workflow for making large-scale training runs bitwise reproducible: pick the guarantee, fingerprint the run, and trace divergence down to the kernel.
Keep reading
The Good Stuff
Paid picks we use ourselves. Links carry a referral code — a subscription through one earns us a commission at no extra cost to you.
One useful email. Unsubscribe anytime.