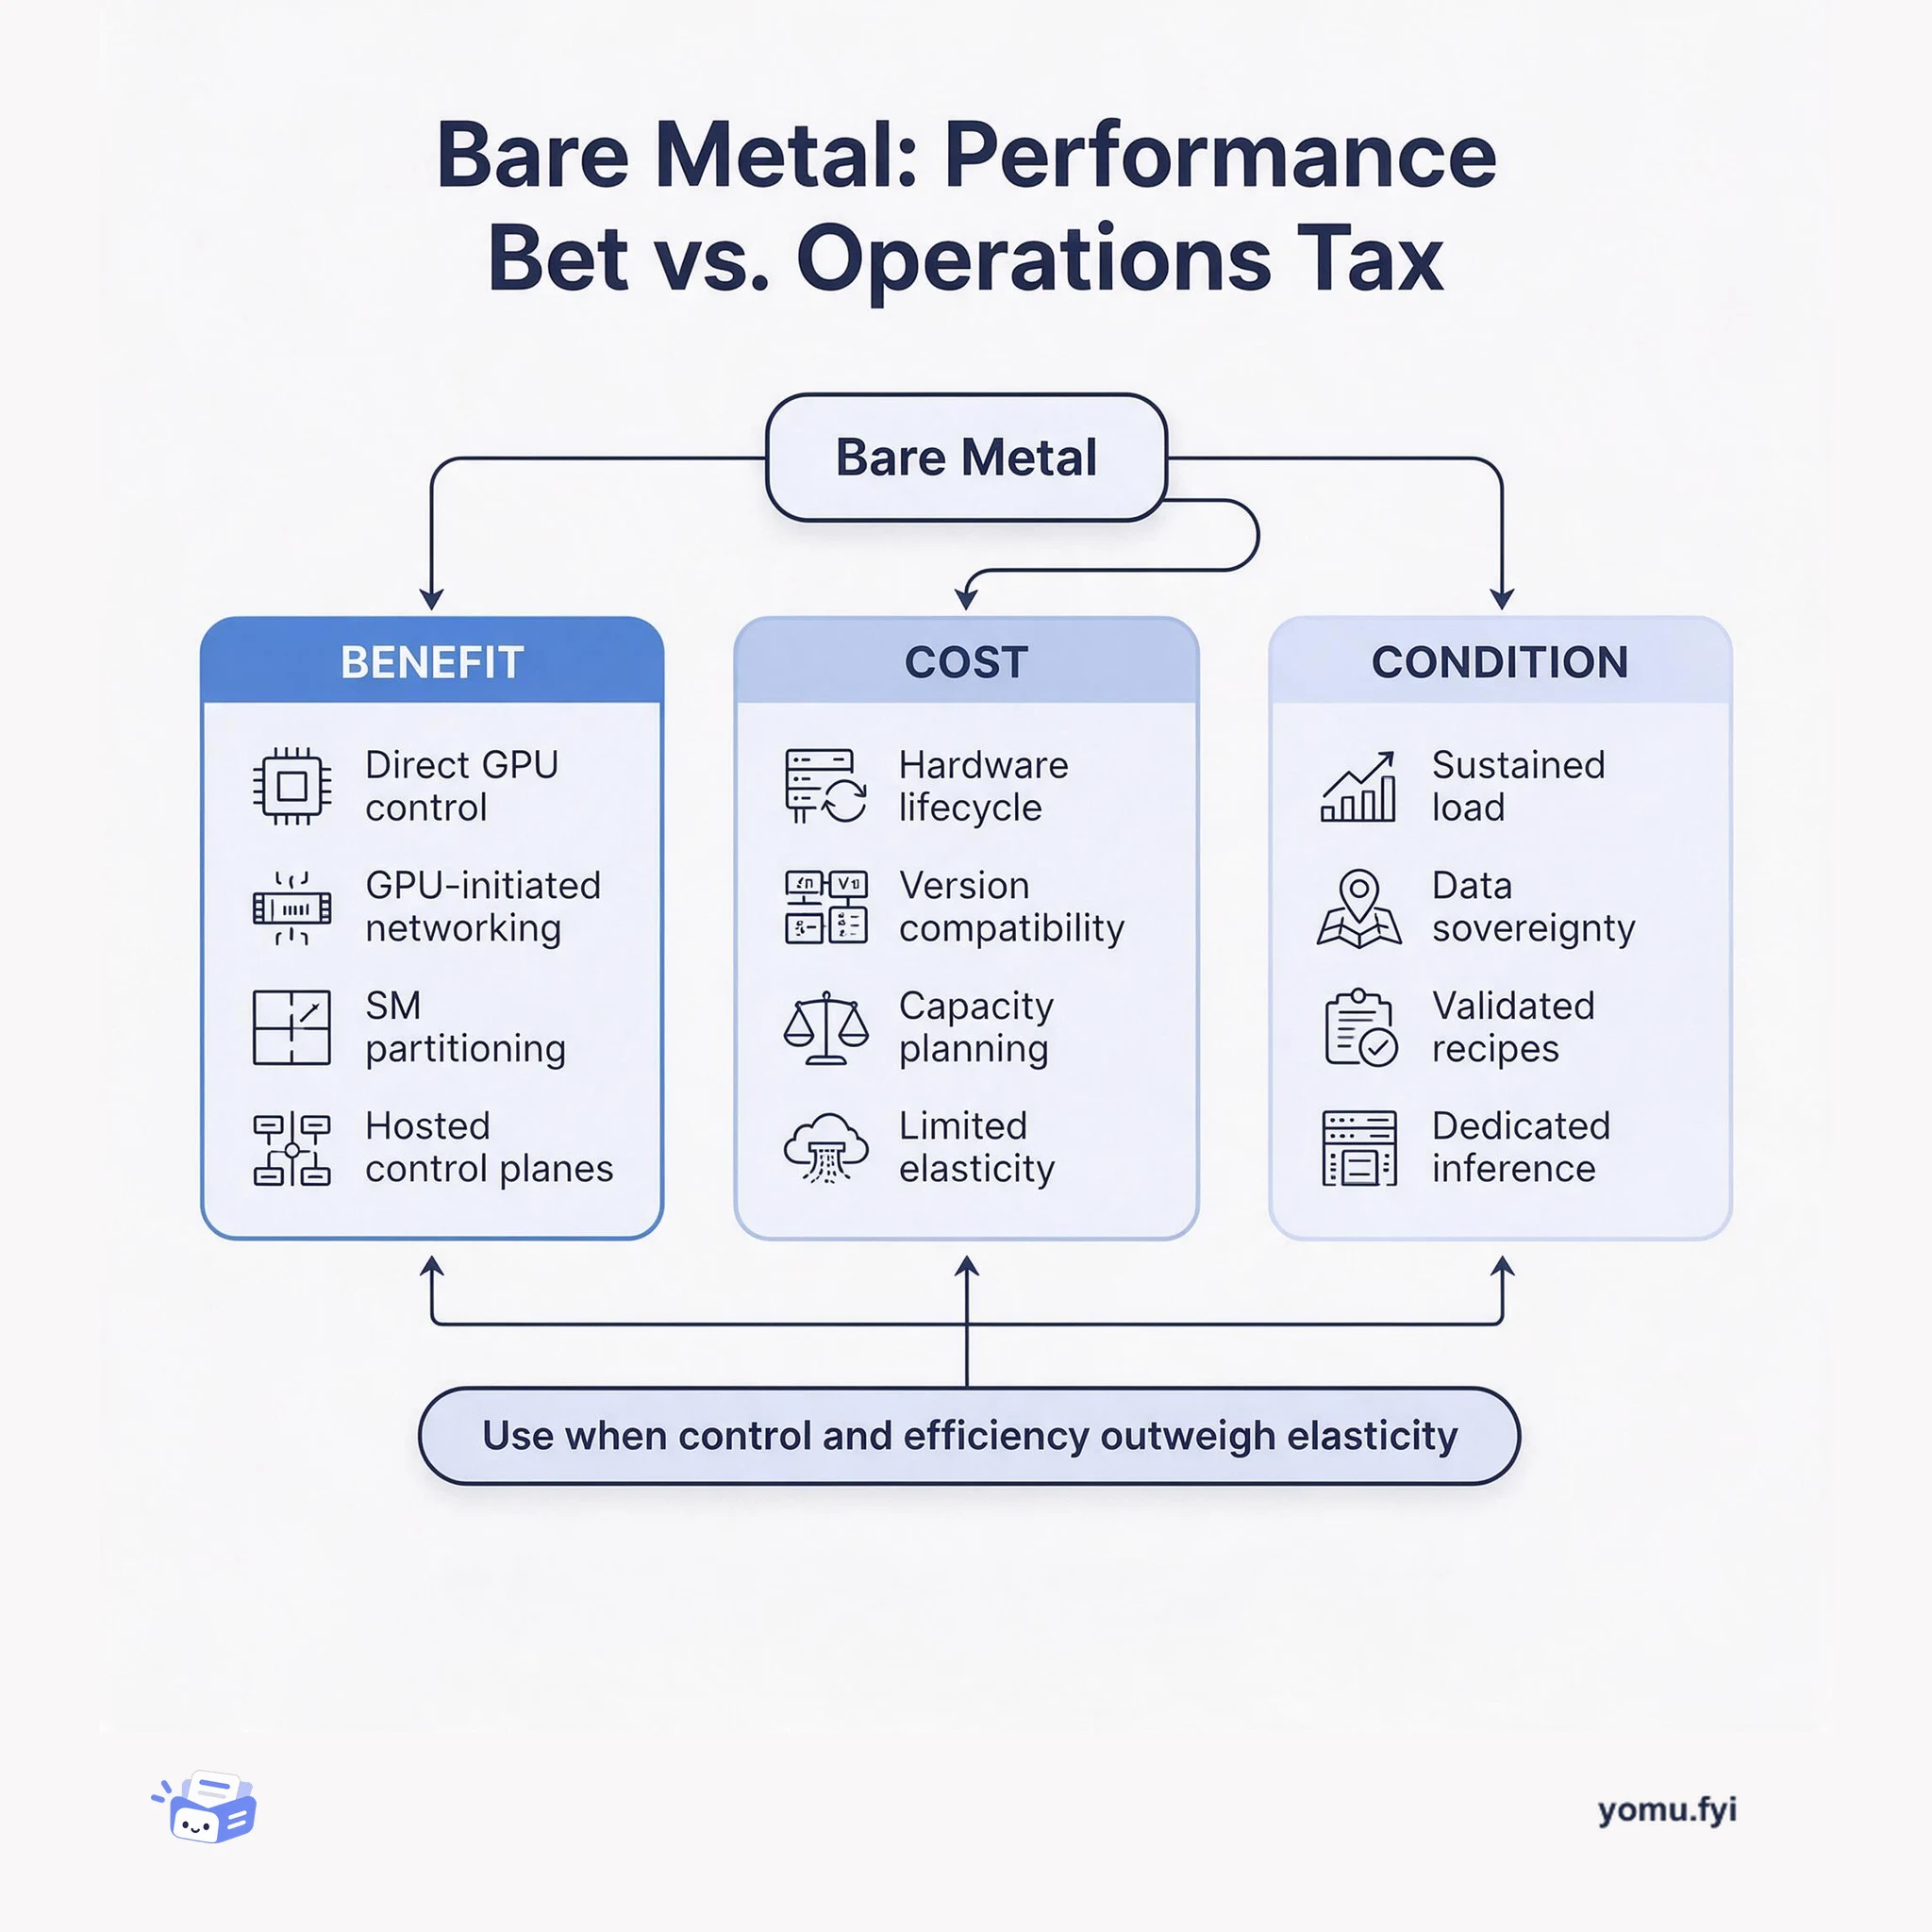
Bare Metal: Performance Bet vs. Operations Tax
Bare metal gives engineers direct control over GPU, network, and virtualization layers, but it shifts elasticity and lifecycle work onto the team. This trade-off map shows when that bargain pays off.
Loading…
Topic
816 posts about Performance. Every summary links to the original.
See the idea
Bare metal gives engineers direct control over GPU, network, and virtualization layers, but it shifts elasticity and lifecycle work onto the team. This trade-off map shows when that bargain pays off.
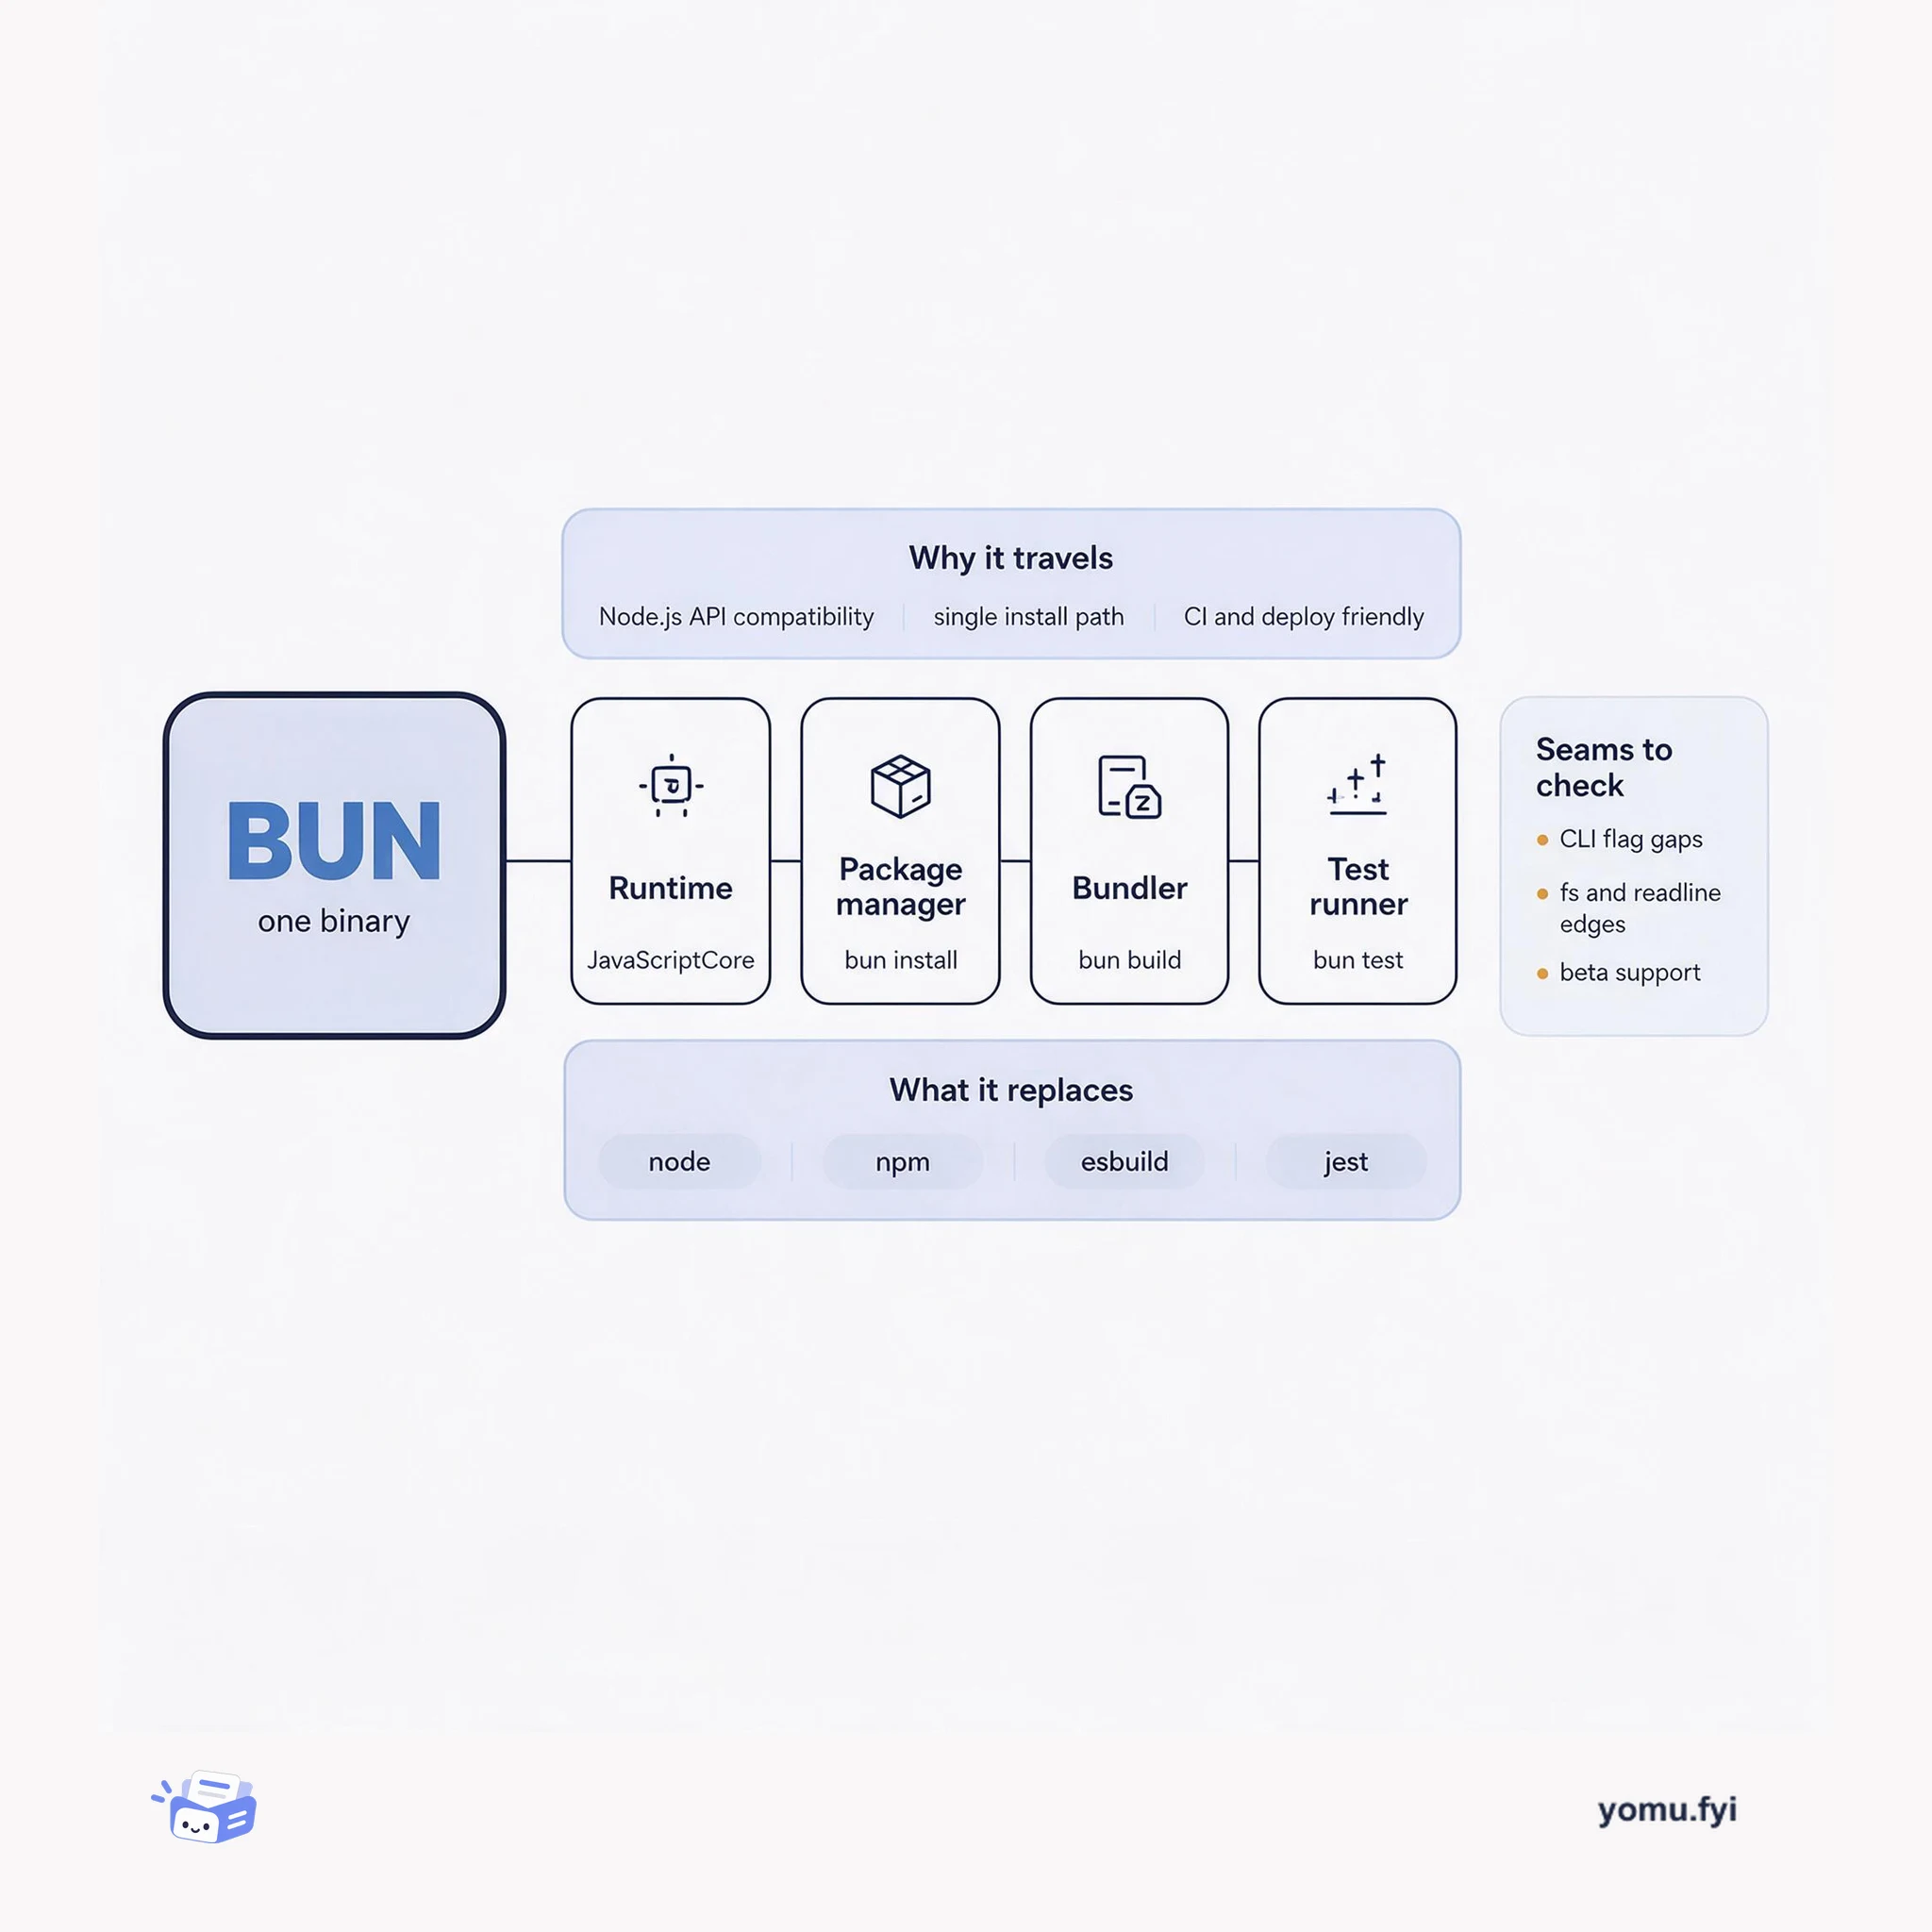
Bun packs a runtime, package manager, bundler, and test runner into one binary. Here is how those four parts fit together and where the seams still show.
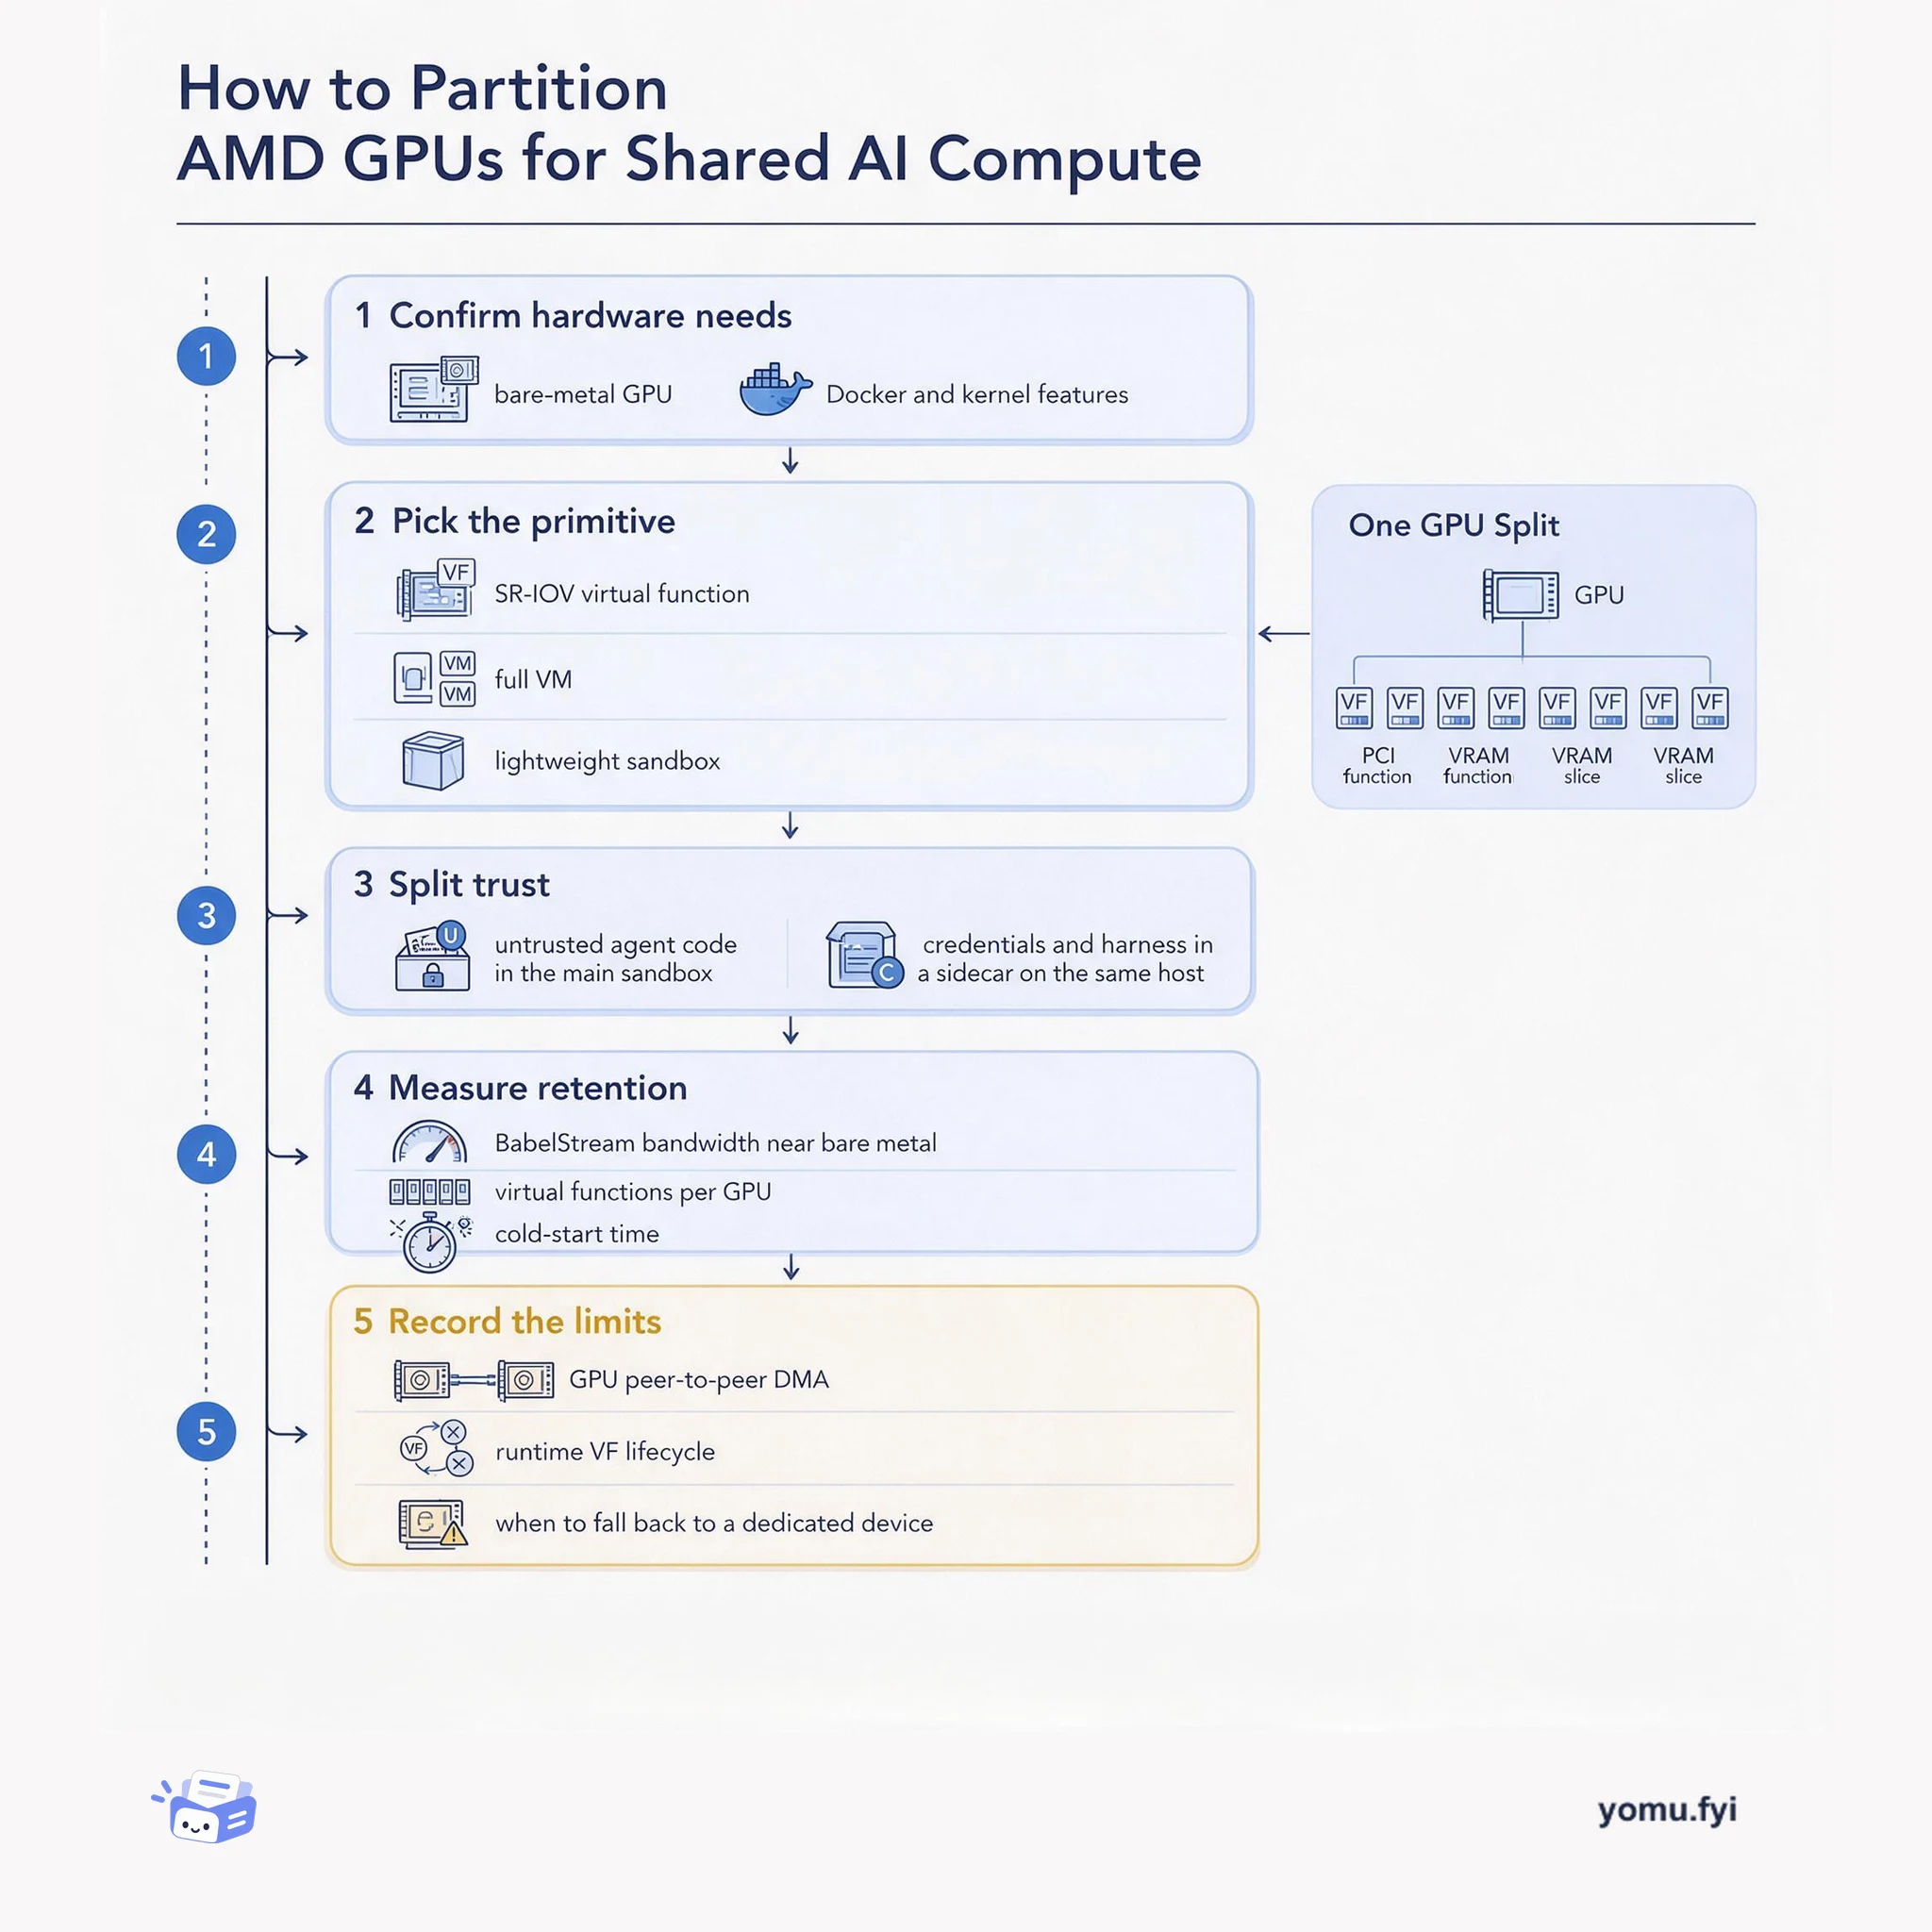
A five-step how-to for deciding when an AMD Instinct GPU should stay dedicated and when SR-IOV virtual functions, VMs, or sidecar isolation can safely share it.
The Good Stuff
Paid picks we use ourselves. Links carry a referral code — a subscription through one earns us a commission at no extra cost to you.
Newest first
The post describes systematic performance optimization to reduce fine-tuning time for the Qwen 3.8 27B model on AI Runtime from 7 hours 44 minutes to 1 hour 17 minutes, a 6x improvement. The baseline showed 98% GPU utilization, but torch traces revealed the CPU was stalling the GPU with too many small operations. Installing manually fused kernels such as flash-linear-attention and causal-conv1d reduced the number of GPU operations by 15x and improved training speed by 3.7x. Further gains came from switching from 2D padded batches to 1D packed tensors with correct position_ids, which reduced the number of batches by 36% and eliminated dynamic shape recompilation. The post emphasizes measuring what matters beyond GPU utilization and leveraging pre-built community kernels and efficient batching.
The post explains GitHub’s redesign of the stargazers API to provide star history without exposing user identities. The original endpoint returned paginated lists of stargazers, which tools used to reconstruct growth curves by fetching all pages, leading to privacy risks and expensive database queries that counted all stars on each request due to a pagination bug. GitHub first restricted access to stargazer lists to repository collaborators, but this broke tools that needed star history. Collaborating with maintainers and the Star History project, GitHub built a new endpoint that returns up to 30 weeks of daily star counts in a single request with no identities attached. The new endpoint reduces database work by filtering stars by time before aggregation, cutting requests for repositories like react/react from about 2,511 to 24.
A customer observed an extra ~32 ms tail latency on simple SELECT queries after idle periods in ClickHouse’s Native TCP protocol. The root cause was that after a TCP idle period (RTO), the congestion window resets to initcwnd (8 MSS), and with TCP_NODELAY enabled, each metadata packet (ProfileEvents, Logs, Progress) becomes a separate TCP segment, exceeding the small window and forcing an additional round trip. The ClickHouse Native protocol sends these metadata packets between Data and EndOfStream, and the unbatched writes caused the problem. The team reproduced the issue deterministically using Linux network namespaces and tc to simulate 32 ms RTT and initcwnd 8. They fixed it by batching those metadata packets into a single buffer write at the application layer, reducing tail latency from ~32 ms to ~1 ms, as confirmed by a Go client program that measured the time between the last Data packet and EndOfStream.
Google tested Gemini 4 Argon on google/adk-python, a 205,000-line Python framework with 800 source files and 17,000 unit tests. The model ran unattended for 11 hours, guided by a /goal prompt and .agents/skills rulefiles that encoded maintainer conventions. Argon first wrote a benchmark script, spent 70 minutes measuring before editing code, and proposed six optimizations across 32 files; two shipped after human code review. The shipped changes cut in-memory session prep time by about 40% in long sessions and sped up cold package imports by 21% by filtering events before copying and using lazy module accessors. The other four proposals were rejected for relying on fragile state, private library internals, or synthetic-only gains, illustrating a division of labor where the agent explores and the maintainer subtracts.
JetBrains Marketplace now provides UI freeze reports for plugin authors, accessible from the Freezes tab after enabling Marketplace reporting via the JetBrainsMarketplaceErrorReportSubmitter handler in plugin.xml. Reports are grouped by error type, with each pile showing a representative report and a thread-dump excerpt that identifies threads involved, such as the event dispatch thread (EDT), helping spot recurring patterns. Full thread dumps captured every five seconds during the freeze are available, along with optional CPU snapshots and performance metrics, and comparing dumps across samples can reveal persistent operations. The analyze-freeze skill guides AI agents through investigating IntelliJ Platform thread dumps, focusing on the EDT, coroutine behavior, and common patterns like non-cancellable read actions blocking the UI, with suggestions for fixes. Before fixing, authors should check the plugin version, keep blocking I/O outside read actions, and test changes by repeating the operation and examining fresh diagnostic evidence.
Cloudflare introduced on-demand CPU and memory profiling for Workers and Durable Objects, accessible via the CLI or the Dashboard’s Observability page. Users can generate interactive flamegraphs and download pprof files, with each rectangle’s width representing CPU time or memory usage over a chosen duration. Profiling the R2 binding Worker revealed that genericR2JsonReplacer, called by JSON.stringify, processed nested values multiple times; fixing it made the function 2.7x faster. A different Worker with P999 memory at 133 MB (above the 128 MB limit) was found to have a partially enabled Prometheus code path accounting for 66.7% of allocations; disabling it reduced P999 memory to 118 MB and eliminated out-of-memory errors. The profiling system locates the correct data center and isolate for the Worker or Durable Object, and continuous profiling is being developed to automatically capture samples without manual initiation.
Clera, an AI talent agent representing 200,000+ candidates, migrated its 500 GB production Postgres database to ClickHouse Managed Postgres after outgrowing its previous provider. The previous database suffered from point lookups taking multiple seconds, 100% CPU for six straight days, and timeouts. Clera evaluated Supabase, Neon, PlanetScale, and ClickHouse, choosing ClickHouse for its local NVMe storage that avoids network-attached disk latency. In sysbench TPC-C testing, ClickHouse showed 16–42% higher throughput than the runner-up. The team migrated 500+ tables from the EU to the US overnight using ClickPipes and manual replay, with production traffic still hitting the database. After migration, CPU usage dropped to 10–20%, and no settings have been changed since the cutover.
Salesforce Data 360 processes about eight million Apache Spark executions daily, where successful completion alone does not confirm efficient resource use. The team instrumented the shared Data Processing Controller (DPC) gateway with a DataFlint Spark listener plugin to capture per-executor CPU, memory, shuffle, and zero-task metrics without application code changes. Metrics stream through Kafka into an Iceberg lakehouse, and a curated Silver analytic layer ensures analysis uses only complete, comparable runs and correctly handles retries and missing data. Investigation revealed workloads that repeatedly allocated executors performing zero tasks, enabling targeted reductions like lowering initial executors from forty to four. After staged production rollout monitored for runtime, spill, retries, and platform pressure, weekly compute-cost run rate fell 31% while DPC job starts grew over 7%.
The Sentry Flutter SDK records breadcrumbs, user information, and diagnostic data through scope updates, adding overhead to apps. On Android, a dedicated worker isolate handles Sentry Android SDK operations to avoid blocking the main UI isolate, but both the calling isolate and the worker normalized the same data, and the encoding step produced a JSON string plus an unnecessary byte buffer copy. Removing the duplicate normalization roughly halved normalization time, while using JsonUtf8Encoder to encode directly into UTF-8 bytes reduced encoding time by 16% and eliminated the extra copy. Combined, these changes reduced total scope payload processing time by 27–30% for benchmark inputs of 1.2 KB, 23 KB, and 238 KB, as measured on a Google Pixel 4 in release mode. The optimizations are available in sentry_flutter version 9.26.0 and later.
Green contexts, available in the CUDA Driver API since 12.4 and the Runtime API since 13.1, let applications explicitly partition GPU execution resources such as SMs and workqueues. They are lightweight to create and destroy, do not implicitly synchronize unrelated work, and allow provisioning workqueues to reduce false dependencies. Streams are created from a green context rather than relying on implicit device state, making targeting explicit. Benchmarks on a Blackwell GPU show a critical kernel completing in 0.007 ms with green context partitioning, compared to 0.140 ms with high-priority streams and 3.727 ms with equal priority. The tradeoff is fewer SMs for the bulk workload, but green contexts are opt-in and can be adopted incrementally alongside existing CUDA code.
The CostBench benchmark streamed 113.2 billion stock-market quotes at one million rows per second while running aggregate and drill-down queries to compare ClickHouse Cloud and Databricks for real-time analytics under continuous ingestion. ClickHouse Cloud delivered 752× better end-to-end performance per dollar than the Databricks stack using Serverless SQL, Zerobus Ingest, liquid clustering, and incremental materialized views. ClickHouse Cloud led in all three components: preparation cost ($28.69 versus 695.60), normalized query cost ( 0.05 versus $2.65), and accumulated query runtime (56.39 seconds versus 29.10 minutes). The gap stems from ClickHouse preparing ordered raw data and current summaries on the insert path, while Databricks requires separate clustering and refresh services that cost more and can leave queries with unfinished layout work. Databricks’ new Lakehouse//RT, still in beta, was not included in this comparison.
IFCO’s data platform team, with Databricks Forward Deployed Engineering, optimized a large dbt project on Databricks to handle billions of daily tracking events for reusable packaging assets. The pipeline faces scale, unpredictable late-arriving data, and the need to reconcile history when late events change previously reported asset timelines. The team tuned incremental model settings to match Delta Lake write behaviors, including liquid clustering, deliberate merge vs. delete+insert strategies, and bounding writes to recent ingestion windows. Diagnosing performance from actual query plans rather than compiled SQL revealed that the consolidation model was scanning far more rows than necessary. These changes cut the core semantic layer job’s daily runtime by over 60 percent, retired a costly nightly full refresh, and reduced daily compute cost by 58 percent.
MongoDB 9.0 is the most advanced release in MongoDB’s history, designed to eliminate the tradeoffs that force organizations to add infrastructure, compromise security, or rethink architecture as applications grow. Transactional workloads achieve up to 20% higher throughput compared to 8.0, with find-one queries up to 35% faster and update-one queries up to 30% faster, and large deployments see nearly 2x higher throughput. Queryable Encryption now supports prefix, suffix, and substring queries, enabling partial-match searches on encrypted data throughout its lifecycle. Intelligent Workload Management queues transient traffic spikes during overload to keep clusters responsive, buying time for auto-scaling or operator intervention. The release also includes redesigned Atlas Metrics UI, enhanced OpenTelemetry integration for streaming metrics to platforms like Datadog and Prometheus, and a MongoDB extension for Hibernate ORM to ease modernization.
Cloudflare is now the fastest provider in 74% of the top 1,000 global networks, up from 60% in April 2026, representing an additional 150 networks and 38 countries. Performance is measured using connection time (TCP handshake) and the trimean of connection times, which combines the 25th, 50th, and 75th percentiles to reduce outlier influence. To expand data collection, Cloudflare introduced a new methodology using Challenge Pages, which run non-interactive background measurements fetching lightweight files from providers including Cloudflare, Amazon CloudFront, Google, Fastly, and Akamai. Challenge Pages are delivered by Turnstile and preserve privacy while providing broader reach than error-page measurements alone. This increased measurement volume narrows confidence intervals around trimean values, making rankings more stable in networks where top providers are separated by only a millisecond or two.
Cloudflare has released the BEACON dataset, an anonymized collection of billions of real-user performance measurements from 10,000 of the largest websites. The dataset reports Core Web Vitals (LCP, CLS, INP) with full histograms, enabling analysis of any percentile including the long tail. It reveals that WebKit browsers underperform Blink in 46 countries, and that resource-discovery and render-blocking contribute more to slow LCP than download time. Soft navigations in single-page applications load two to three times faster than hard navigations, but landing pages remain heavy. The dataset is publicly available on Google BigQuery and includes differential privacy via the RAPPOR algorithm to protect individual user data.
Rider 2026.2.3 is released, adding AI performance analysis to the Monitoring tool window and fixing an issue with the AI Agent Setup widget on Windows. The Monitoring tool window collects runtime data every time an application runs, allowing the AI agent to find bottlenecks and link them to code using the Analyze with AI action, which sends a prompt to the agent to begin the investigation. The agent uses the dottrace-analyze skill to show where time was spent, follow hot paths in code, and provide useful performance insights in the chat. This feature requires Windows, dotUltimate or the All Products Pack, and the AI Assistant plugin. The widget fix addresses issue RIDER-143160, where clicking its taskbar icon with display scaling below 175% failed to open the widget, and updates are available from the IDE, Toolbox App, or website.
Red Hat conducted a performance and scale test of the argocd-agent pull architecture for GitOps, using 42 physical machines, 500 spoke clusters, and software including OpenShift 4.21 and OpenShift GitOps 1.20. The pull model decentralizes reconciliation to lightweight agents on each managed cluster, which pull configurations from a central hub, improving security by eliminating inbound administrative ports and reducing cross-cluster network traffic by up to 80%. In the bootstrap scenario, generating and syncing 31,200 applications across 480 clusters completed in 13 minutes 3 seconds, while the sync-to-commit scenario, which includes a polling delay, took 13 minutes. The test revealed bottlenecks including Kubernetes API limits on the hub, informer processing slowdowns causing watch restarts, event writer retry issues under load, and ApplicationSet controller RAM consumption. The team also deleted all 31,200 applications in 4 minutes 53 seconds using cascading deletion, and the insights are informing future OpenShift GitOps releases.
The back/forward cache (bfcache) allows instant page restores by freezing snapshots, yet its hits register no events in traditional telemetry, creating a blind spot for teams. Sentry’s bfcacheMetricsIntegration fills this gap by modeling three browser-provided signals as application metrics: a navigation counter with hit/miss outcome, a per-reason counter for misses via the notRestoredReasons API, and a distribution of fallback reload duration. The integration is opt-in and launched in JavaScript SDKs v11; detailed miss reasons are currently Chromium-only due to browser API support. Users can query these metrics to break down bfcache health by route, release, or browser, enabling discovery of regressions caused by unload listeners, cache-control headers, or third-party scripts. This turns the bfcache from an invisible performance feature into a measurable, trackable signal that teams can monitor and improve.
The post describes the reproduction of AI2’s OLMo 3 7B pre-training using MaxText on Google Cloud TPUs, covering both stages, matching the reference loss curve and held-out metrics. PyTorch weights were converted to JAX with logit parity, KL divergence 1.5e-3 and 98.75% top-1 agreement, and held-out evaluations caught a data loader bug that made incorrect gains appear. The run demonstrated reliability via exact checkpoint-resume with zero loss delta, resilience to a 75% capacity loss via resize with 1% throughput preservation, and seamless TPU generation change. Performance optimizations achieved 44.5% MFU on Ironwood, and head reshaping from 32 heads by 128 to 16 by 256 yielded 12.4% faster throughput at identical parameters and FLOPs. The post emphasizes that faithful reproduction requires verification on generalization metrics and provides instructions for readers to reproduce the run with open sourced code.
Rendering a pull request with over a million changed lines and hundreds of threaded comments requires a fundamentally different architecture than a code-only diff. The standard virtualized approach fails because comment heights depend on render-time factors like markdown wrapping, expandable sections, and reply composers. The team split the document’s height into two independent domains: deterministic code geometry and dynamic block geometry for comments. A single idle- and scroll-gated measurement pass, scoped to the viewport, corrects heights without causing reflows mid-scroll. The result is a pull request view where a million-line diff with hundreds of comments opens, scrolls, and behaves like a normally sized pull request.
The best engineering reads, once a week.