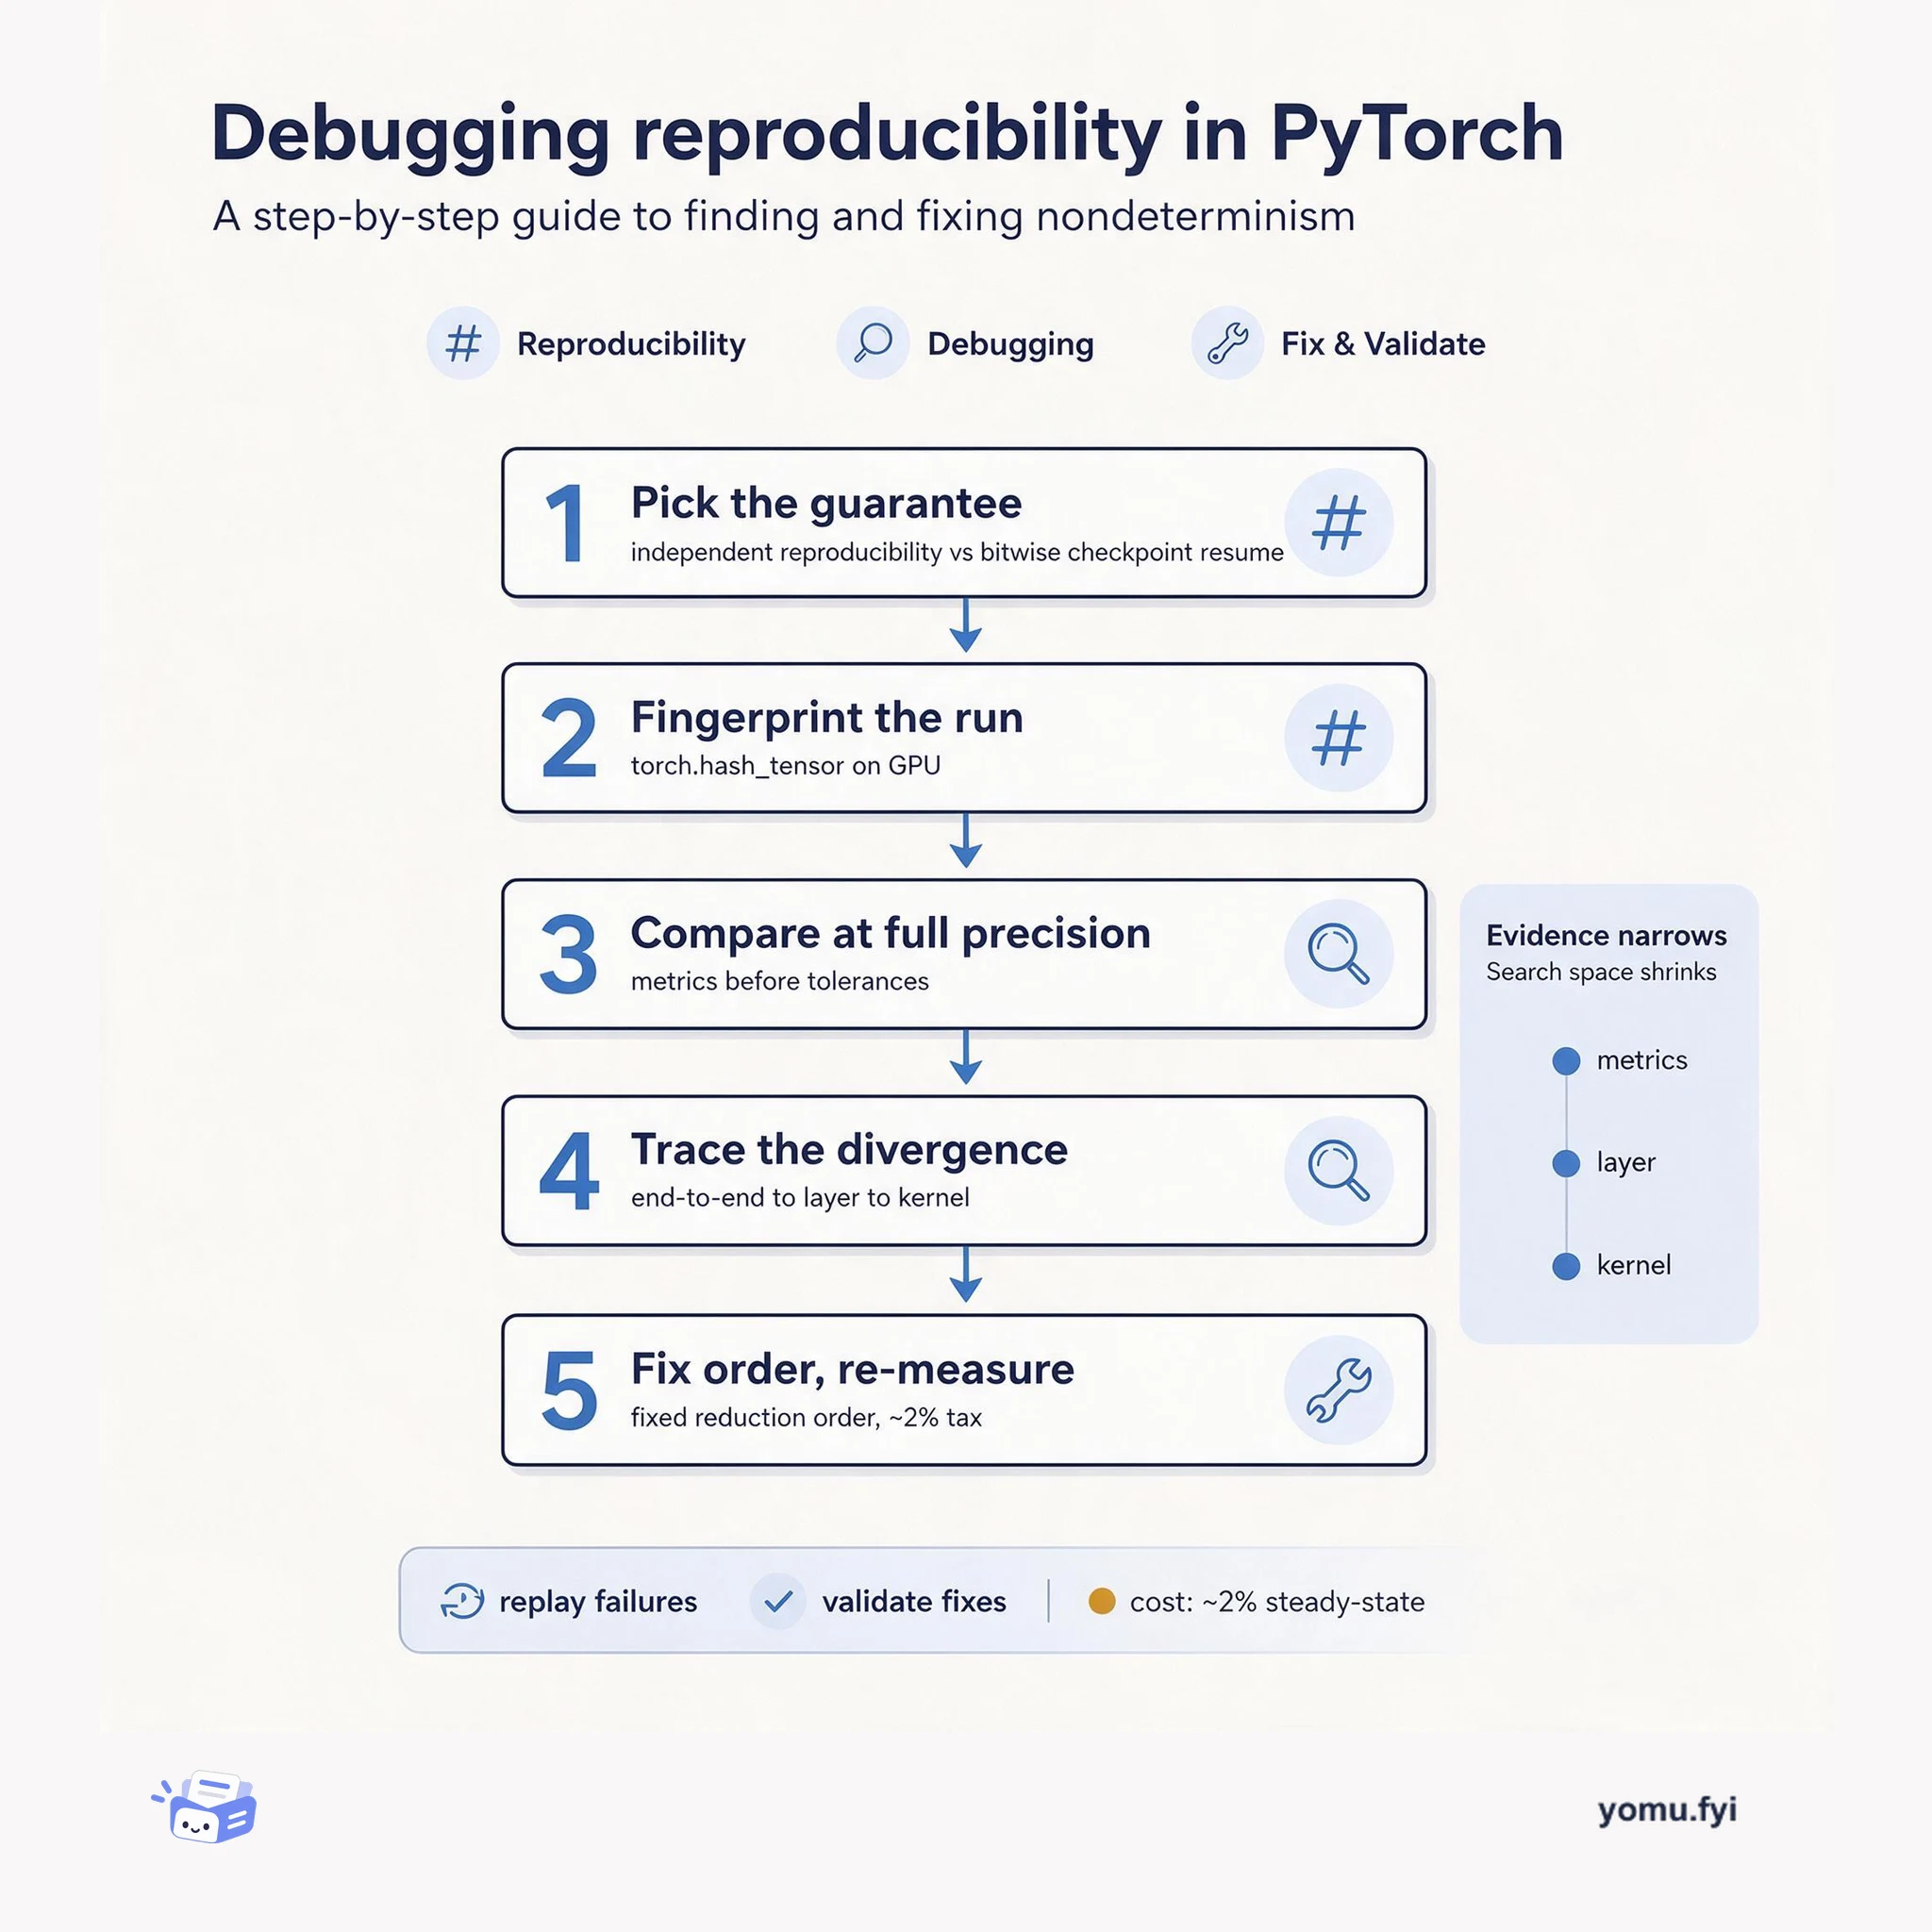
Five Checkpoints to Bitwise-Deterministic Training Runs
A five-checkpoint workflow for making large-scale training runs bitwise reproducible: pick the guarantee, fingerprint the run, and trace divergence down to the kernel.
Loading…
Topic
20 posts about Debugging. Every summary links to the original.
See the idea
A five-checkpoint workflow for making large-scale training runs bitwise reproducible: pick the guarantee, fingerprint the run, and trace divergence down to the kernel.
The Good Stuff
Paid picks we use ourselves. Links carry a referral code — a subscription through one earns us a commission at no extra cost to you.
Newest first
Lauterbach and JetBrains have integrated TRACE32 debugging tools with CLion, enabling embedded developers to debug applications on target hardware directly from the IDE. The integration uses the Debug Adapter Protocol (DAP) to connect CLion to TRACE32 through the TRACE32 Debug Adapter, allowing developers to control execution, step through code, and inspect variables while TRACE32 handles target hardware communication. Two workflows are supported: launching a new TRACE32 PowerView session from CLion with scripts to configure the connection, or attaching to an existing TRACE32 instance. The integration requires CLion 2026.2.4 or later, TRACE32 PowerView 09.2026 (or build 195402), and TRACE32 Debug Adapter version 0.1.2 or later, with detailed configuration examples in the Lauterbach knowledge base. This brings code editing, navigation, and hardware debugging into one workflow, and a free webinar on October 27, 2026 will demonstrate the integration in action.
JetBrains Marketplace now provides UI freeze reports for plugin authors, accessible from the Freezes tab after enabling Marketplace reporting via the JetBrainsMarketplaceErrorReportSubmitter handler in plugin.xml. Reports are grouped by error type, with each pile showing a representative report and a thread-dump excerpt that identifies threads involved, such as the event dispatch thread (EDT), helping spot recurring patterns. Full thread dumps captured every five seconds during the freeze are available, along with optional CPU snapshots and performance metrics, and comparing dumps across samples can reveal persistent operations. The analyze-freeze skill guides AI agents through investigating IntelliJ Platform thread dumps, focusing on the EDT, coroutine behavior, and common patterns like non-cancellable read actions blocking the UI, with suggestions for fixes. Before fixing, authors should check the plugin version, keep blocking I/O outside read actions, and test changes by repeating the operation and examining fresh diagnostic evidence.
Seer Agent, Sentry’s AI debugging assistant, now performs write actions through the Sentry API, such as setting up custom dashboards, creating monitors and alerts, and assigning, resolving, and archiving issues. It defaults to the user’s permission level and explicitly requests permission for tasks outside its write scope, with permissions not persisting beyond a single chat. The agent can also incorporate infrastructure data from external monitoring platforms like Datadog and Google Cloud Platform via Seer Connectors, using API keys instead of OAuth. This allows Seer Agent to diagnose issues by connecting front-end and back-end data beyond Sentry’s native scope. These updates evolve Seer Agent from a conversational rubber duck into a proactive debugging assistant that can act on behalf of users.
Logpoints in IntelliJ IDEA provide a way to inspect a running Java process without suspending it, making them useful when println logging or regular breakpoints would be disruptive. The walkthrough uses a Dockerized gRPC client and server whose incorrect tenant discount is traced by attaching to the server and adding expressions at runtime, without rebuilding or redeploying. Progressive logging shows the tenant value as JetBrains while the expected value is jetbrains, and the correct-discount block is never entered; the supplied fix uses equalsIgnoreCase and returns 2,000 basis points. The article also demonstrates testing changes through logpoint side effects, extending gRPC deadlines selectively, logging in dependencies, and using the ij-debugger AI agent skill. IntelliJ IDEA 2026.2 adds faster placement and instrumentation that removes debugger-introduced overhead, although heavy expressions still execute in the VM.
Spring Security can reject a request before execution reaches a controller breakpoint, leaving developers to determine the effective roles and whether bypassing authorization is safe for debugging. IntelliJ IDEA’s security inlays read the live SecurityFilterChain during an active debug session, show role or authority requirements, link to configuration, and let developers unlock an exact URI and HTTP method either with all listed roles or with a chosen username and authority set. The debugger populates an artificial Authentication in the running application’s SecurityContext without changing configuration, while CSRF checks and method-level authorization still apply separately. Unlocks last for the debug session or until relocked, affect every client reaching that route, and have limitations including Servlet-only support, no programmatic API, and a null @AuthenticationPrincipal result.
Rider 2026.3’s first Early Access build is available through the website and Toolbox App, introducing updates for editing, debugging, plugin discovery, code completion, and test coverage. Rainbow brackets color matching pairs by nesting level, helping with deeply nested code; the option is disabled by default and can be enabled under Settings | Editor | General | Appearance. Data breakpoints can now be created by right-clicking an editor variable or through the Breakpoints tool window, while retaining read/write access, conditions, logging, validation, and other options. Bundled game-development plugins are grouped under a new Game Development category, with a matching JetBrains Marketplace tag, and completion suggestions can be narrowed or hidden using icon-based filters. Rider’s dotCover integration adds coverage for TUnit tests when JetBrains.dotCover.Framework is installed, with Microsoft.Testing.Platform 2.3.0 or later required.
CLion 2026.2.2 adds an AI skill for diagnosing ARM Cortex-M hard faults through dedicated MCP tooling. Embedded debugging typically requires decoding CFSR and HFSR, matching the faulting program counter to disassembly, and reproducing crashes because default handlers often report only that a fault occurred. When triggered by a stopped hard-fault-family handler or relevant fault evidence, the skill provides decoded status registers, the hardware-stacked exception frame, SVD-decoded peripheral registers, disassembly, and nearby memory to an agent. It supports any debugging tool, including Lauterbach TRACE32, Segger J-Link, and ST-LINK, and can produce a bug location and fix, with optional rerunning to verify the program. The skill is enabled by default but requires CLion’s MCP server; it works in AI chat and CLI mode for Claude Code and Codex, while GitHub Copilot supports CLI mode only.
Go treats errors as values rather than moving error handling outside normal control flow: functions return an error alongside other results, and callers check it. The guide presents the built-in error interface, returning errors with errors.New, wrapping failures with fmt.Errorf and %w, and distinguishing nil success from non-nil failure. It also explains panic and recover for unexpected failures, including deferred recovery in services that must continue handling other requests, while warning that panics should not replace ordinary error handling. Its best practices emphasize adding context, choosing informative custom error types, inspecting wrapped errors with errors.Is, errors.As, and errors.AsType, and logging errors when they are handled or cannot be returned. The conclusion recommends balancing early crashes with recovery when restarting is costly or when independent goroutines can continue safely.
Cursor's desktop app faces disruptive crashes as usage and features such as subagents, instant grep, and browser use have expanded, with most failures caused by out-of-memory conditions. The team measures instability across Electron's multi-process architecture using telemetry, per-session and per-request crash rates, minidumps, stack traces, crash breadcrumbs, and dashboards that update within minutes. Its two-pronged debugging strategy combines feature-level experiments and oversize-message instrumentation with bottom-up analysis based on a crash watcher, Chrome DevTools Protocol (CDP) stacks, automated daily investigations, opt-in heap snapshots, and low-rate allocation profiling. Findings led to chunking large data, killswitches, lifecycle fixes for leaks, and process isolation for extensions, while prevention uses Bugbot rules, stress tests, garbage collection, performance tests, and automated rollbacks. OOM-per-session fell 80% from its late-February peak and OOM-per-request fell 73% since March 1.
Debug Mode is an agent loop for coding bugs that combines runtime information with human verification, addressing issues that can stump conventional coding agents. After the user describes a bug, it reads the codebase, proposes multiple hypotheses, and instruments the code with logging statements designed to test them. The user reproduces the issue while the agent collects variable states, execution paths, and timing information, then uses those logs to identify a root cause and produce a targeted fix, often a two- or three-line modification. The user reproduces the bug again with the fix; if it works, the agent removes its instrumentation, while a failed verification prompts additional logging and refinement until the user considers the problem solved.
The post outlines research problems for the next phase of AI programming, centered on making coding systems predict actions, perform larger edits, understand codebases, and debug software. Proposed directions include low-latency next-action models for keystrokes, locations, files, terminal commands, and edits; background execution for “perfect edits” and pseudocode compilation; and multi-file changes supported by stronger tool use, reasoning, and agent trajectories. For context, retrieval alone is described as insufficient for codebase questions requiring multiple hops, while useful context may span documentation, source, history, UI pixels, logs, and messages. The post recommends combining retrieval, recurrence, and long-context attention, alongside specialized rerankers, multi-hop embedders, caching, and codebase-level retrieval. For reliability, it proposes calibrated bug detection, always-on AI linting, runtime-state tracking through cursor/debug, and improved debugger tool use, while noting trade-offs involving latency, false positives, infrastructure, and user experience.
fly-proxy, a Rust-based proxy, leaked memory because its obsolete custom HoneycombLayer retained child spans under a long-lived parent span. The post follows a request from browser input through DNS, TCP, TLS, HTTP/2, and asynchronous Rust components including an aya-built eBPF program, tokio, hyper, and tracing, before explaining how the leak surfaced. In the custom layer, every closed child span was added to its parent’s collection, so each request consumed a small amount of memory while a high-level async task remained alive. Removing that legacy code fixed the primary problem: memory usage barely exceeded 50MB during a load test, while remaining growth came from queues and latency data retained for processing rather than the identified leak.
Node.js applications can be difficult to debug because asynchronous workflows complicate stack traces, while crashes may require core-dump analysis through complex command-line tools. The article presents a layered toolkit: production-oriented logging with Pino or Winston, interactive inspection through Node Inspect and Chrome DevTools, IDE integrations, and the standalone ndb debugger. Running node --inspect-brk launches an application for inspection at chrome://inspect, where breakpoints, stepping, call stacks, heap snapshots, and memory profiling are available; ndb additionally supports edit-in-place changes. For catastrophic crashes, llnode maps JavaScript frames and objects to C/C++ representations from a core dump generated with process.abort, while debug filters namespaced logs and trace and clarify improve asynchronous traces and remove Node.js internals, respectively, for local debugging.
Node.js applications can lose visibility into failures and experience downtime when processes crash or shut down without useful logging and recovery practices. The post presents lessons from consulting and a talk on the Node.js process lifecycle, focusing on graceful shutdown, error visibility, and fast restart after catastrophic errors. It recommends keeping startup lean by prebuilding data or compiling assets, then contrasts process.exit(), which accepts an exit code, with process.abort(), which terminates immediately and may generate a core dump for llnode-based postmortem debugging. It also explains beforeExit and exit, including their differing asynchronous-work behavior, and introduces SIGTERM and SIGINT as operating-system signals that applications can handle. The intended result is a restartable process strategy that reduces downtime, while preserving evidence needed to investigate crashes.
Heroku investigated mysterious H13s—“Connection closed” without response—affecting Ruby applications during dyno deployments or scaling, especially at high traffic levels. The failure involved a race between SIGTERM shutting down Puma and the router’s separate system continuing to deliver a few requests, but comparison with other webservers indicated Puma needed to handle the condition. A reproduction used Rack applications that sent SIGTERM to Puma and themselves, plus parallel curl requests, reproducing curl exit code 52 and Heroku H13s. Debugging showed Puma relied on process termination to close accepted sockets; Puma 4 instead closes binder listeners before shutdown, allowing the router to retry connections while preserving responses for in-flight requests.
Python 3.7 is presented as an upgrade for developers seeking new language features, library improvements, and performance gains over earlier Python 3 releases. The article focuses on data classes, where the @dataclass decorator inspects typed attributes and generates an init method, reducing boilerplate for data-oriented classes. It also covers asyncio.run for simpler asynchronous execution, breakpoint() for entering pdb, module-level getattr for lazy loading, and context variables that keep values separate across execution contexts. Dictionary insertion order becomes part of the language specification in 3.7, while OrderedDict remains available for advanced behavior; reported improvements include 10–30% faster startup, 45–70% faster common sorting cases, 5.5-times-faster dict.copy(), and 4–6-times-faster namedtuple creation.
Jennice Colaco is a backend developer who has worked on Shopify’s Marketing Technology team for 10 months. She holds a Bachelor of Applied Science in Computer Engineering from the University of Toronto, and describes her team’s work as building tools that help merchants market products to customers. She treats programming languages as problem-solving tools, is improving her Ruby skills, and uses byebug to step through code line by line when debugging. Her workday combines early planning, coding, pull-request reviews, pairing sessions, and Slack collaboration, while difficult problems are approached through reading, research, whiteboarding, and asking peers for support. She is taking an in-house Ruby course and describes Shopify’s culture as supportive of individual growth, with ongoing conversations about healthy work environments.
An August 11, 2016 incident caused increased routing latency in Heroku’s EU Common Runtime, even though CPU, packet, memory, request, and socket metrics remained normal. The routing layer received EADDRINUSE while connecting to dynos, leading engineers to investigate Linux TCP port allocation, TIME_WAIT, and the Erlang VM’s system calls with strace. They found that the VM called bind() with 0.0.0.0:0 before connect(), forcing Linux to allocate an ephemeral source port without knowing the destination; this made the ephemeral port range an effective per-instance traffic limit and could fail before 65,536 connections. Testing reproduced the failures and showed that setting SO_REUSEADDR before bind(), exposed in Erlang as {reuseaddr, true}, removed the bind errors; the corresponding Vegur patch was deployed a few days later.
Ruby exposes method metadata and caller-stack information, but before Ruby 2.2 it was difficult to identify the method ultimately reached by super, especially in metaprogrammed code. The example defines Dog#bark and SchneemsDog#bark, then extends an instance with DoubleBark, whose bark method calls super twice; inspecting the class hierarchy incorrectly reports Dog#bark because the module is not an ancestor of the instance's class. Ruby 2.2 adds Method#super_method, a feature proposed in request #9781 and accepted into the Ruby trunk, which returns the method Ruby will invoke for super, including the correct SchneemsDog#bark in this case. Calling source_location on that returned Method provides the location of the actual implementation and avoids the custom metaprogramming previously needed to trace it.
The Heroku Routing team describes a manual created to preserve hard-earned operational knowledge from developing and maintaining Erlang systems at scale. That knowledge had typically been passed informally through incident simulations, code reviews, and similar practices, leaving no persistent record for new team members. The manual presents itself as a guide to being an “Erlang medic” during failures, combining tips, tricks, code snippets, and practices for understanding failure sources and debugging running production systems. It is available as a free PDF under a Creative Commons License at erlang-in-anger.com, and was released in time for the Chicago Erlang conference, where Routing team members and Erlang community participants could discuss real-world applications.
The best engineering reads, once a week.