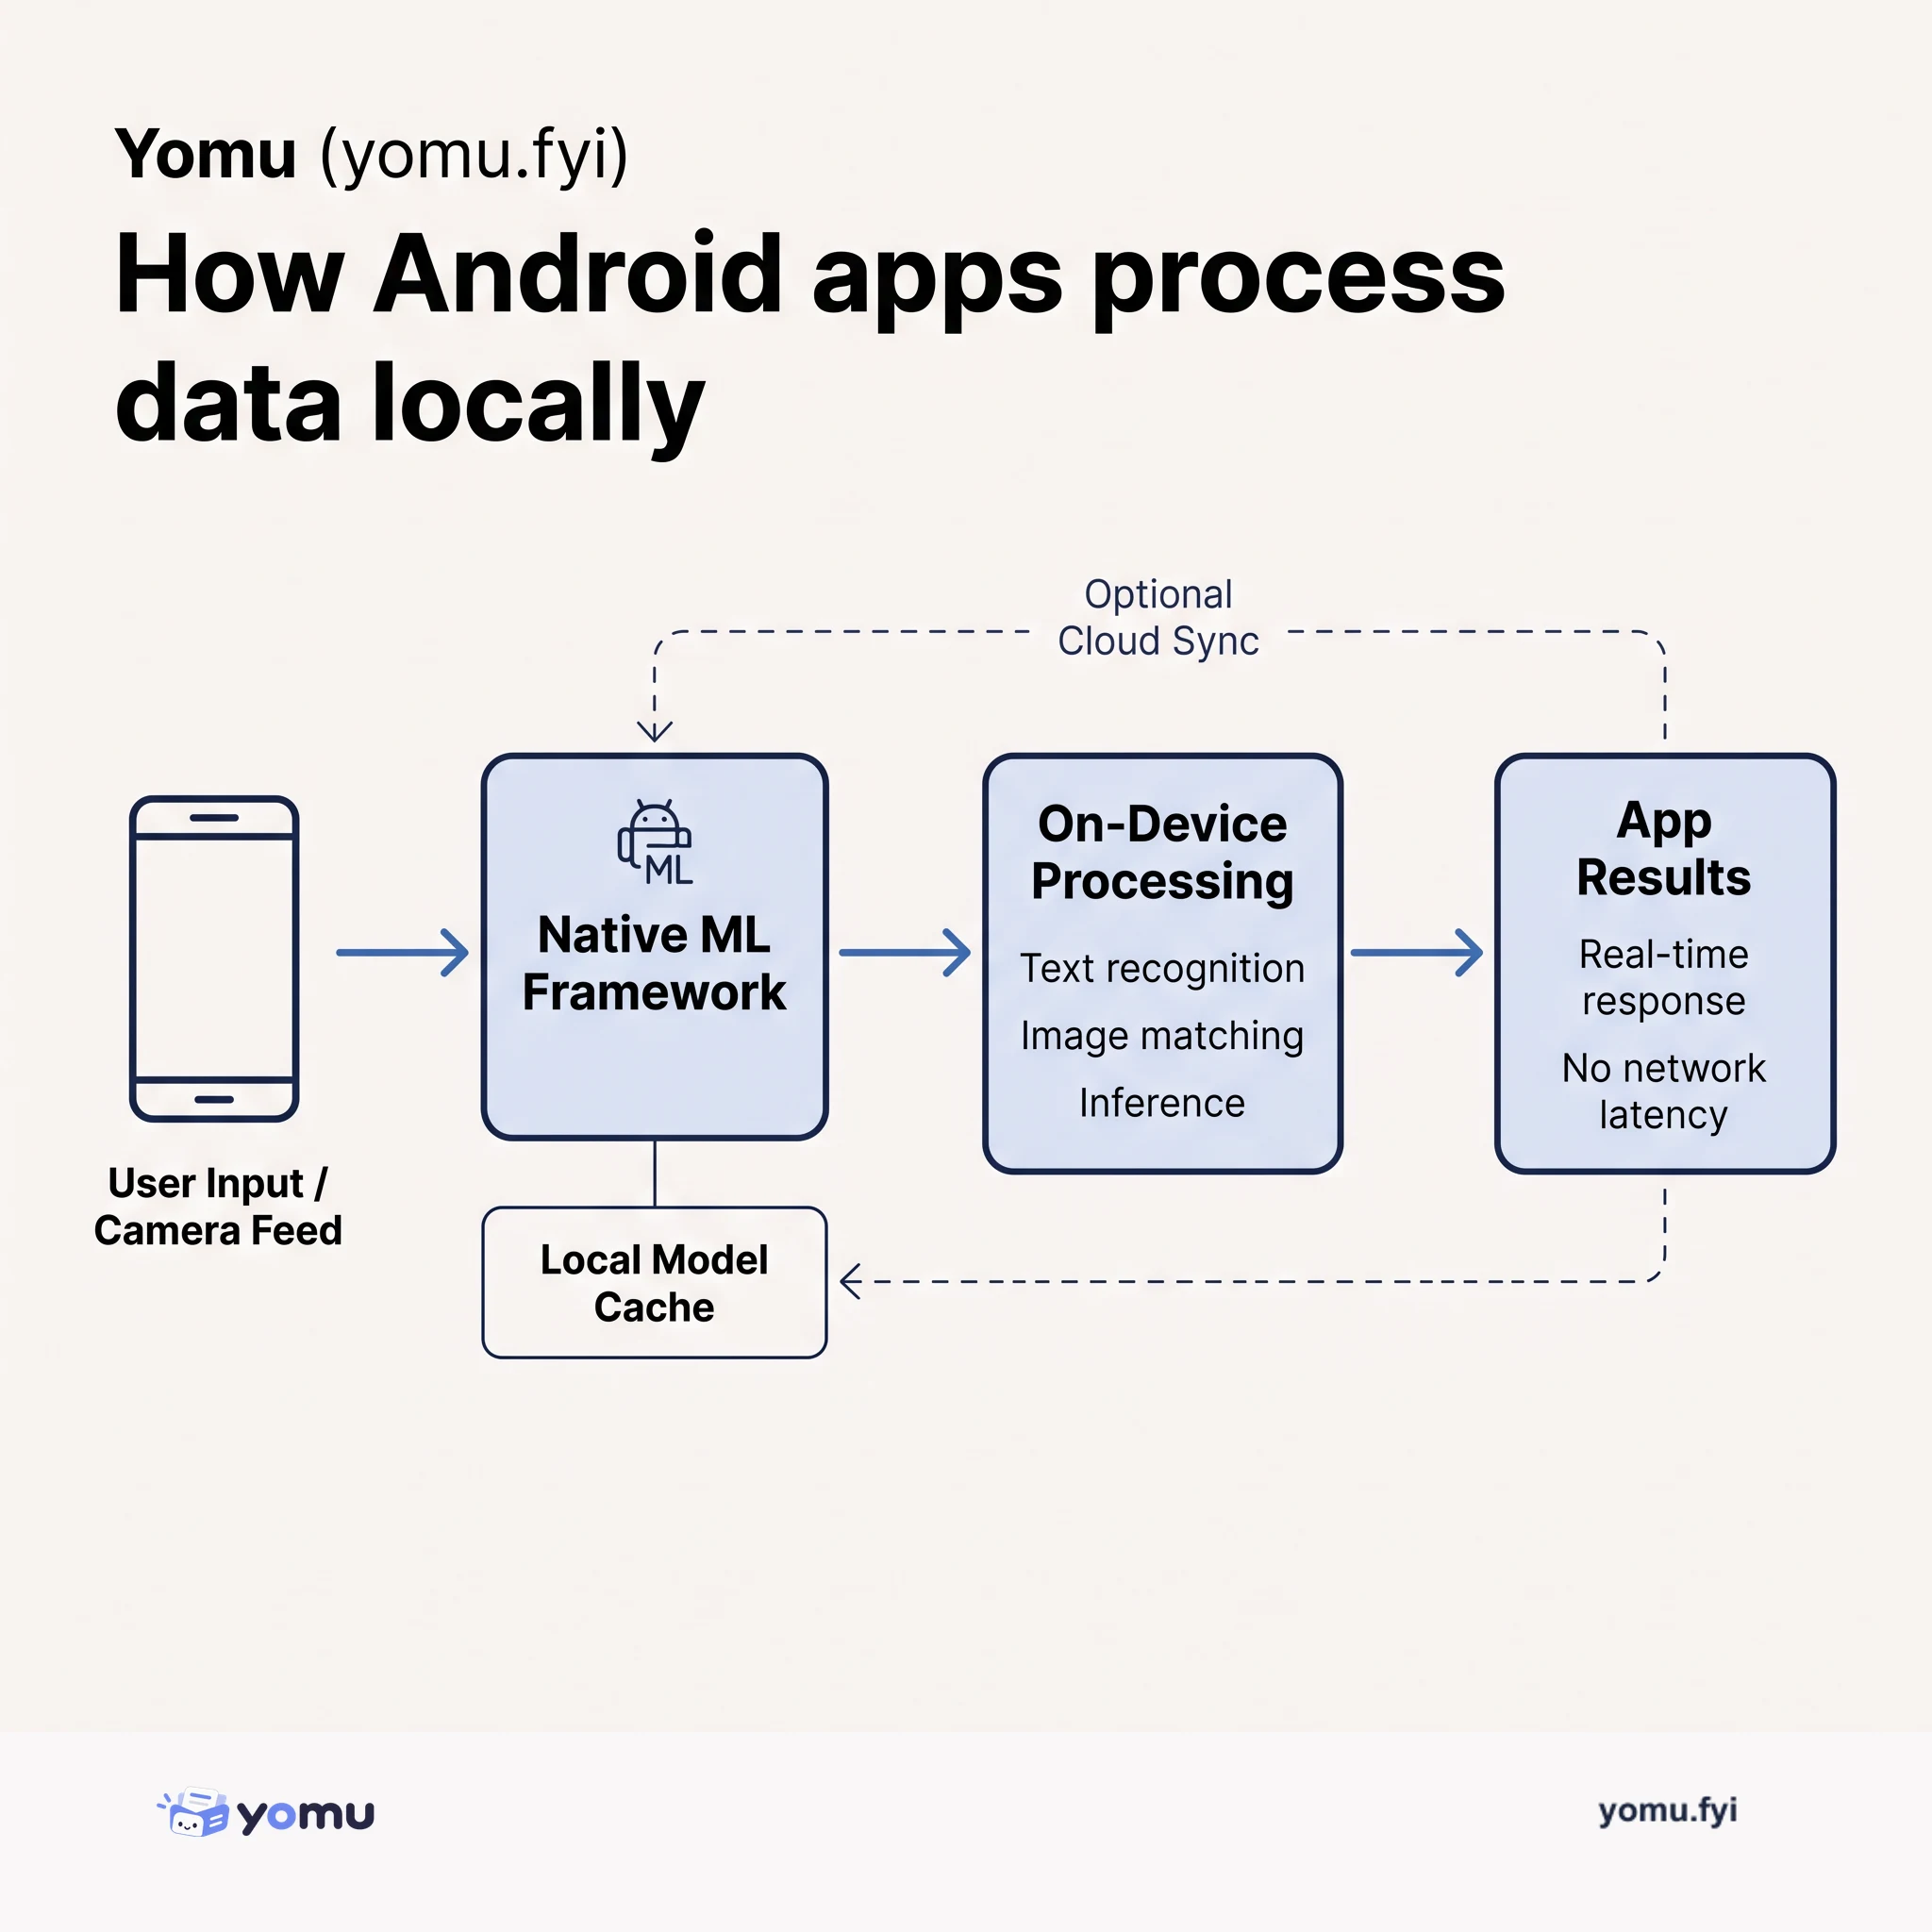
How Android Apps Handle Real-Time Local Processing
Android's on-device machine learning stack lets apps run inference, image recognition, and text processing locally without sending data to servers, reducing latency and protecting privacy.
 SentryIvan TustanivskyiAnnouncement
Unreal Engine games frequently experience performance issues such as frame-rate drops, hitches, and network degradation that do not register as application crashes. To address the lack of live production telemetry, the Sentry Unreal SDK introduces automatic performance metrics. The integration periodically samples frame times, network health, active UObject counts, physical memory usage, and garbage collection pause durations across desktop, console, and Android platforms. Telemetry entries attach contextual hardware and environment attributes alongside trace IDs to connect aggregate latency spikes directly to underlying traces and spans. Enabled by default in Unreal SDK version 1.11.0, this telemetry provides developers with fleet-wide visibility into hardware-specific bottlenecks across game releases.
Unreal Engine performance stats typically remain confined to local developer machines, leaving teams without visibility into in-the-wild player issues like frame drops, hitches, or network degradation that do not generate crash reports.
Sentry introduced automatic performance metrics in Unreal SDK 1.11.0, automatically sampling frame times, network health indicators, and engine stats such as memory and garbage collection pause duration with hardware and trace attributes.
Sentry Unreal SDK captures frame times split across game thread, render thread, and GPU work time to identify subsystem bottlenecks.
Performance telemetry is sampled at configurable intervals, defaulting to twice per second for frame time at 60 FPS, every 10 seconds for network metrics, and every 60 seconds for memory and UObject counts.
Metrics include contextual attributes like GPU model, CPU core count, RAM, map name, and trace IDs, linking aggregate performance spikes directly to corresponding spans and errors.
Summaries are generated from the original by a language model. Check the original before relying on it.
See the idea
Android's on-device machine learning stack lets apps run inference, image recognition, and text processing locally without sending data to servers, reducing latency and protecting privacy.
Keep reading
The Good Stuff
Paid picks we use ourselves. Links carry a referral code — a subscription through one earns us a commission at no extra cost to you.
One useful email. Unsubscribe anytime.
