Anomaly Detection: From Baseline to Action
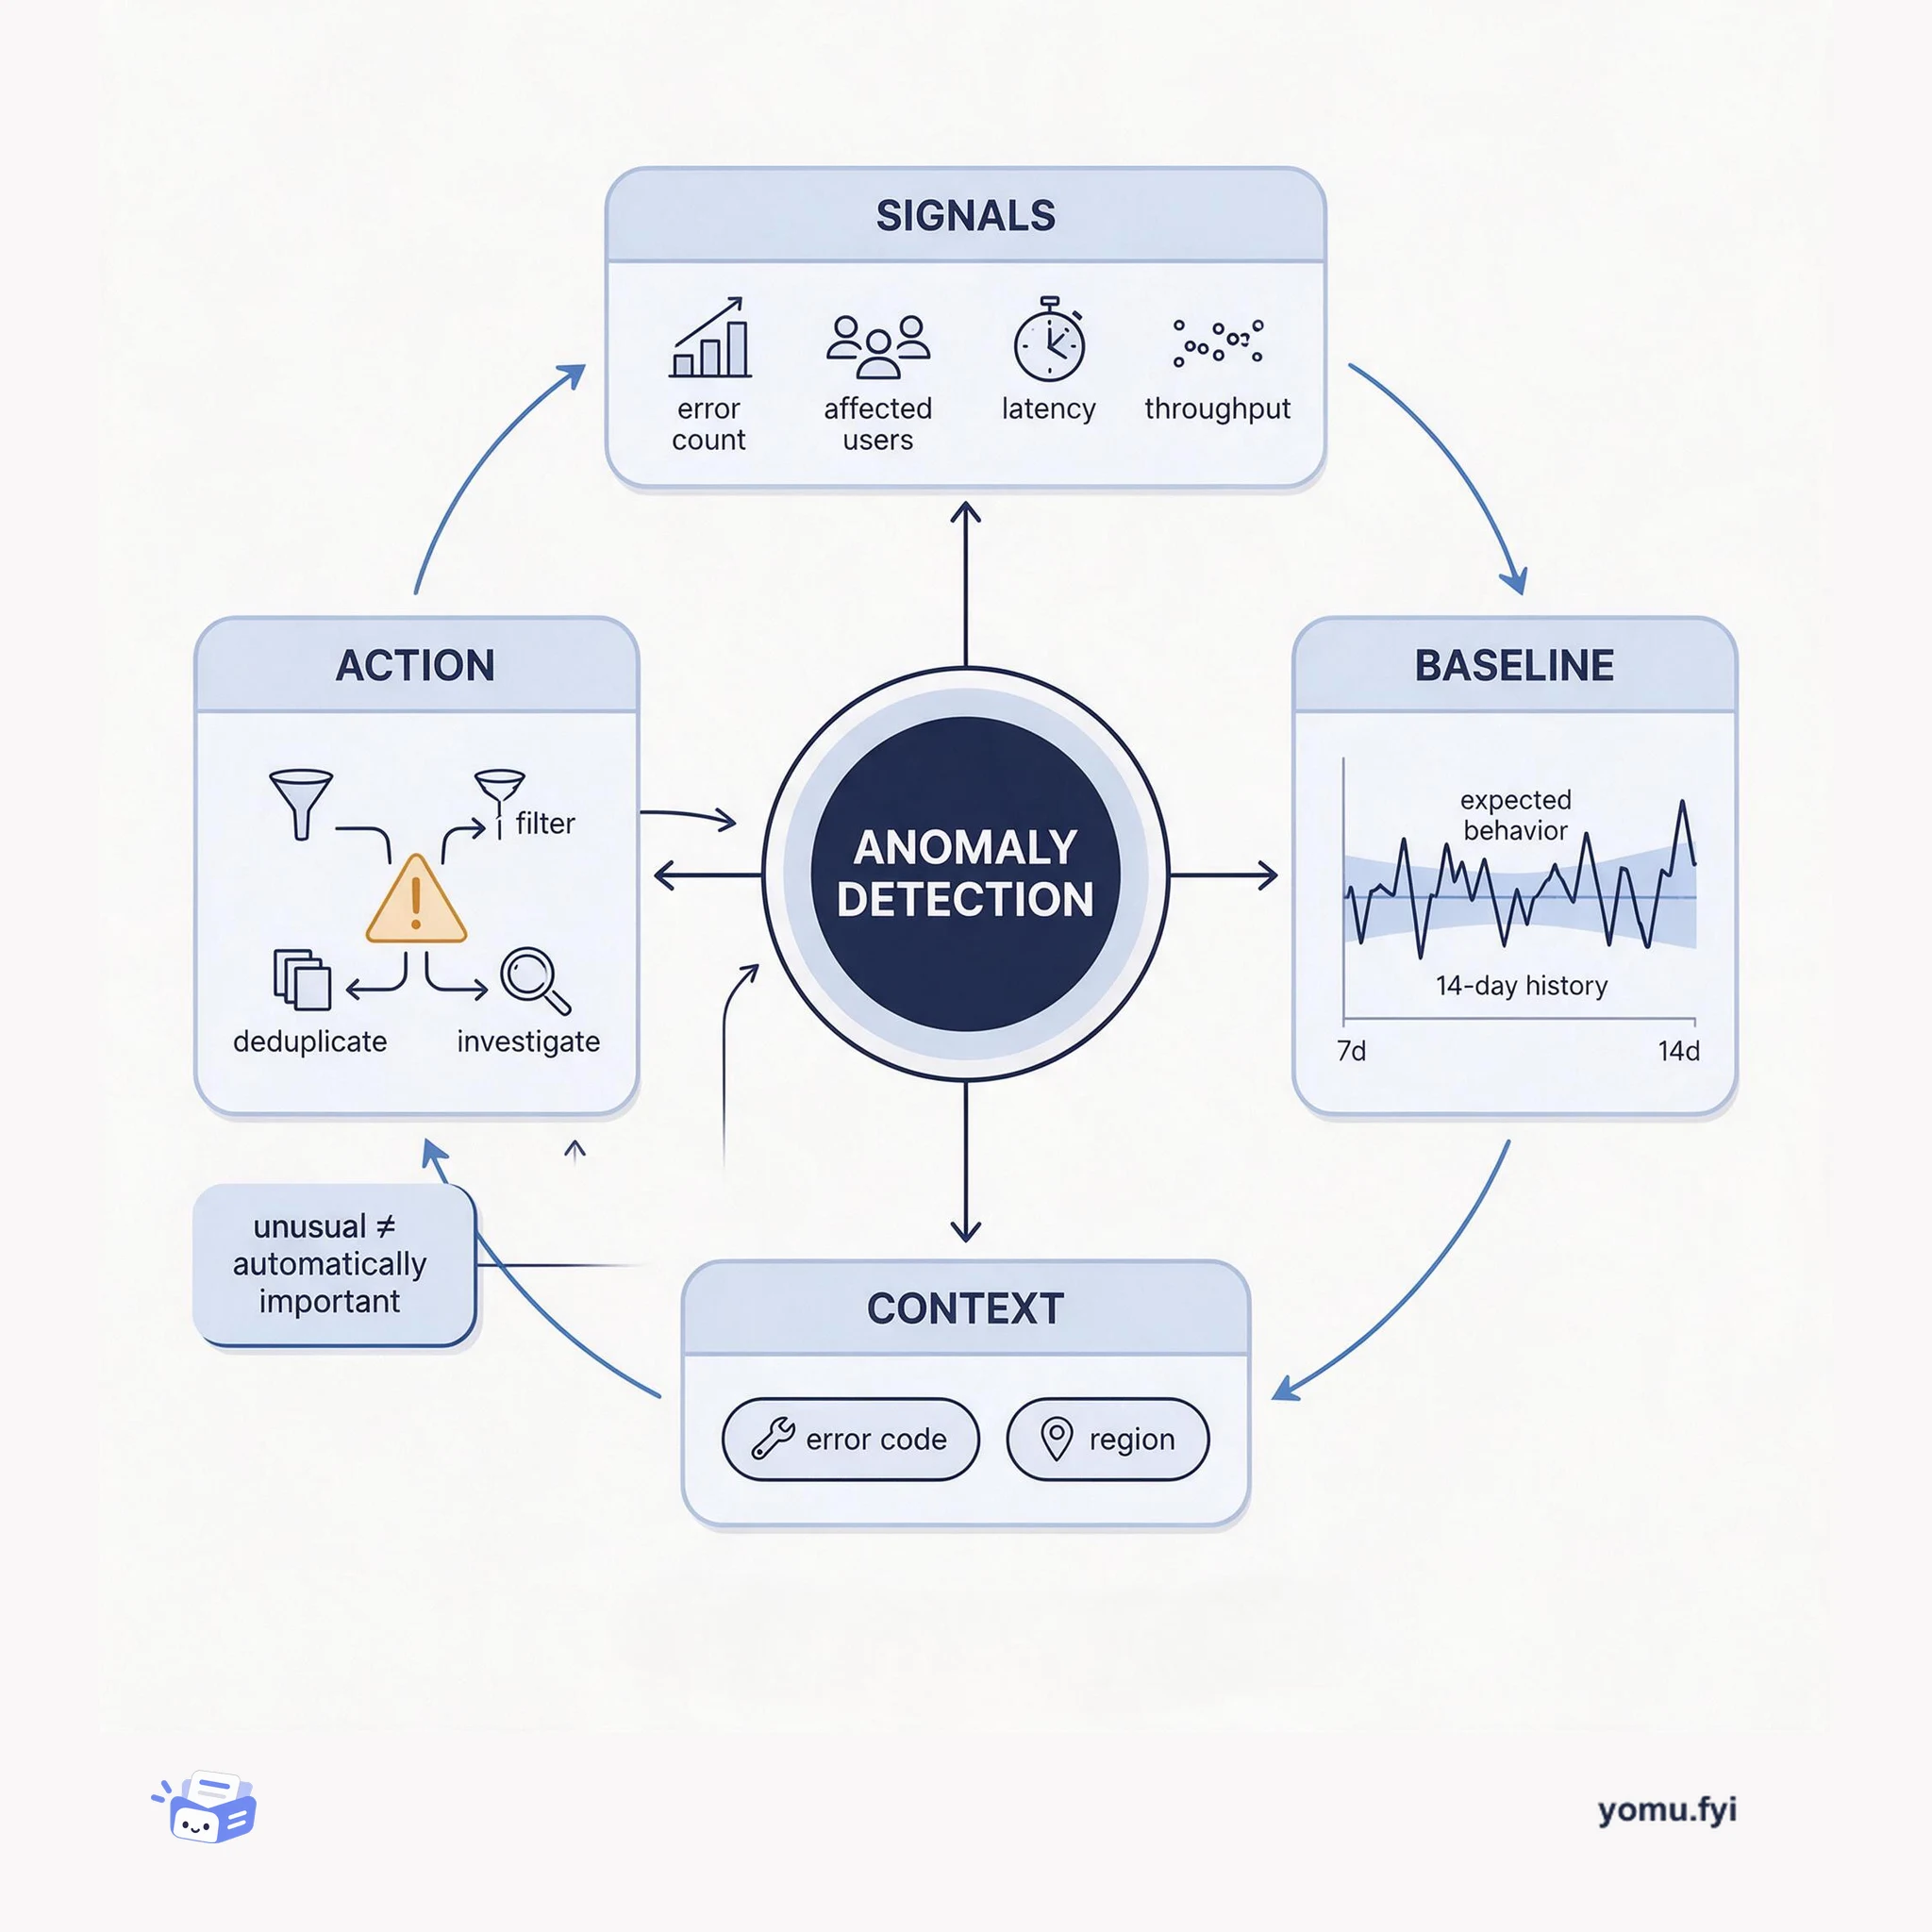
Anomaly detection identifies meaningful departures from expected behavior. This explainer shows how signals, baselines, context, and alert routing turn unusual measurements into engineer-ready findings.
Loading…
Topic
198 posts about Monitoring. Every summary links to the original.
See the idea
Anomaly detection identifies meaningful departures from expected behavior. This explainer shows how signals, baselines, context, and alert routing turn unusual measurements into engineer-ready findings.
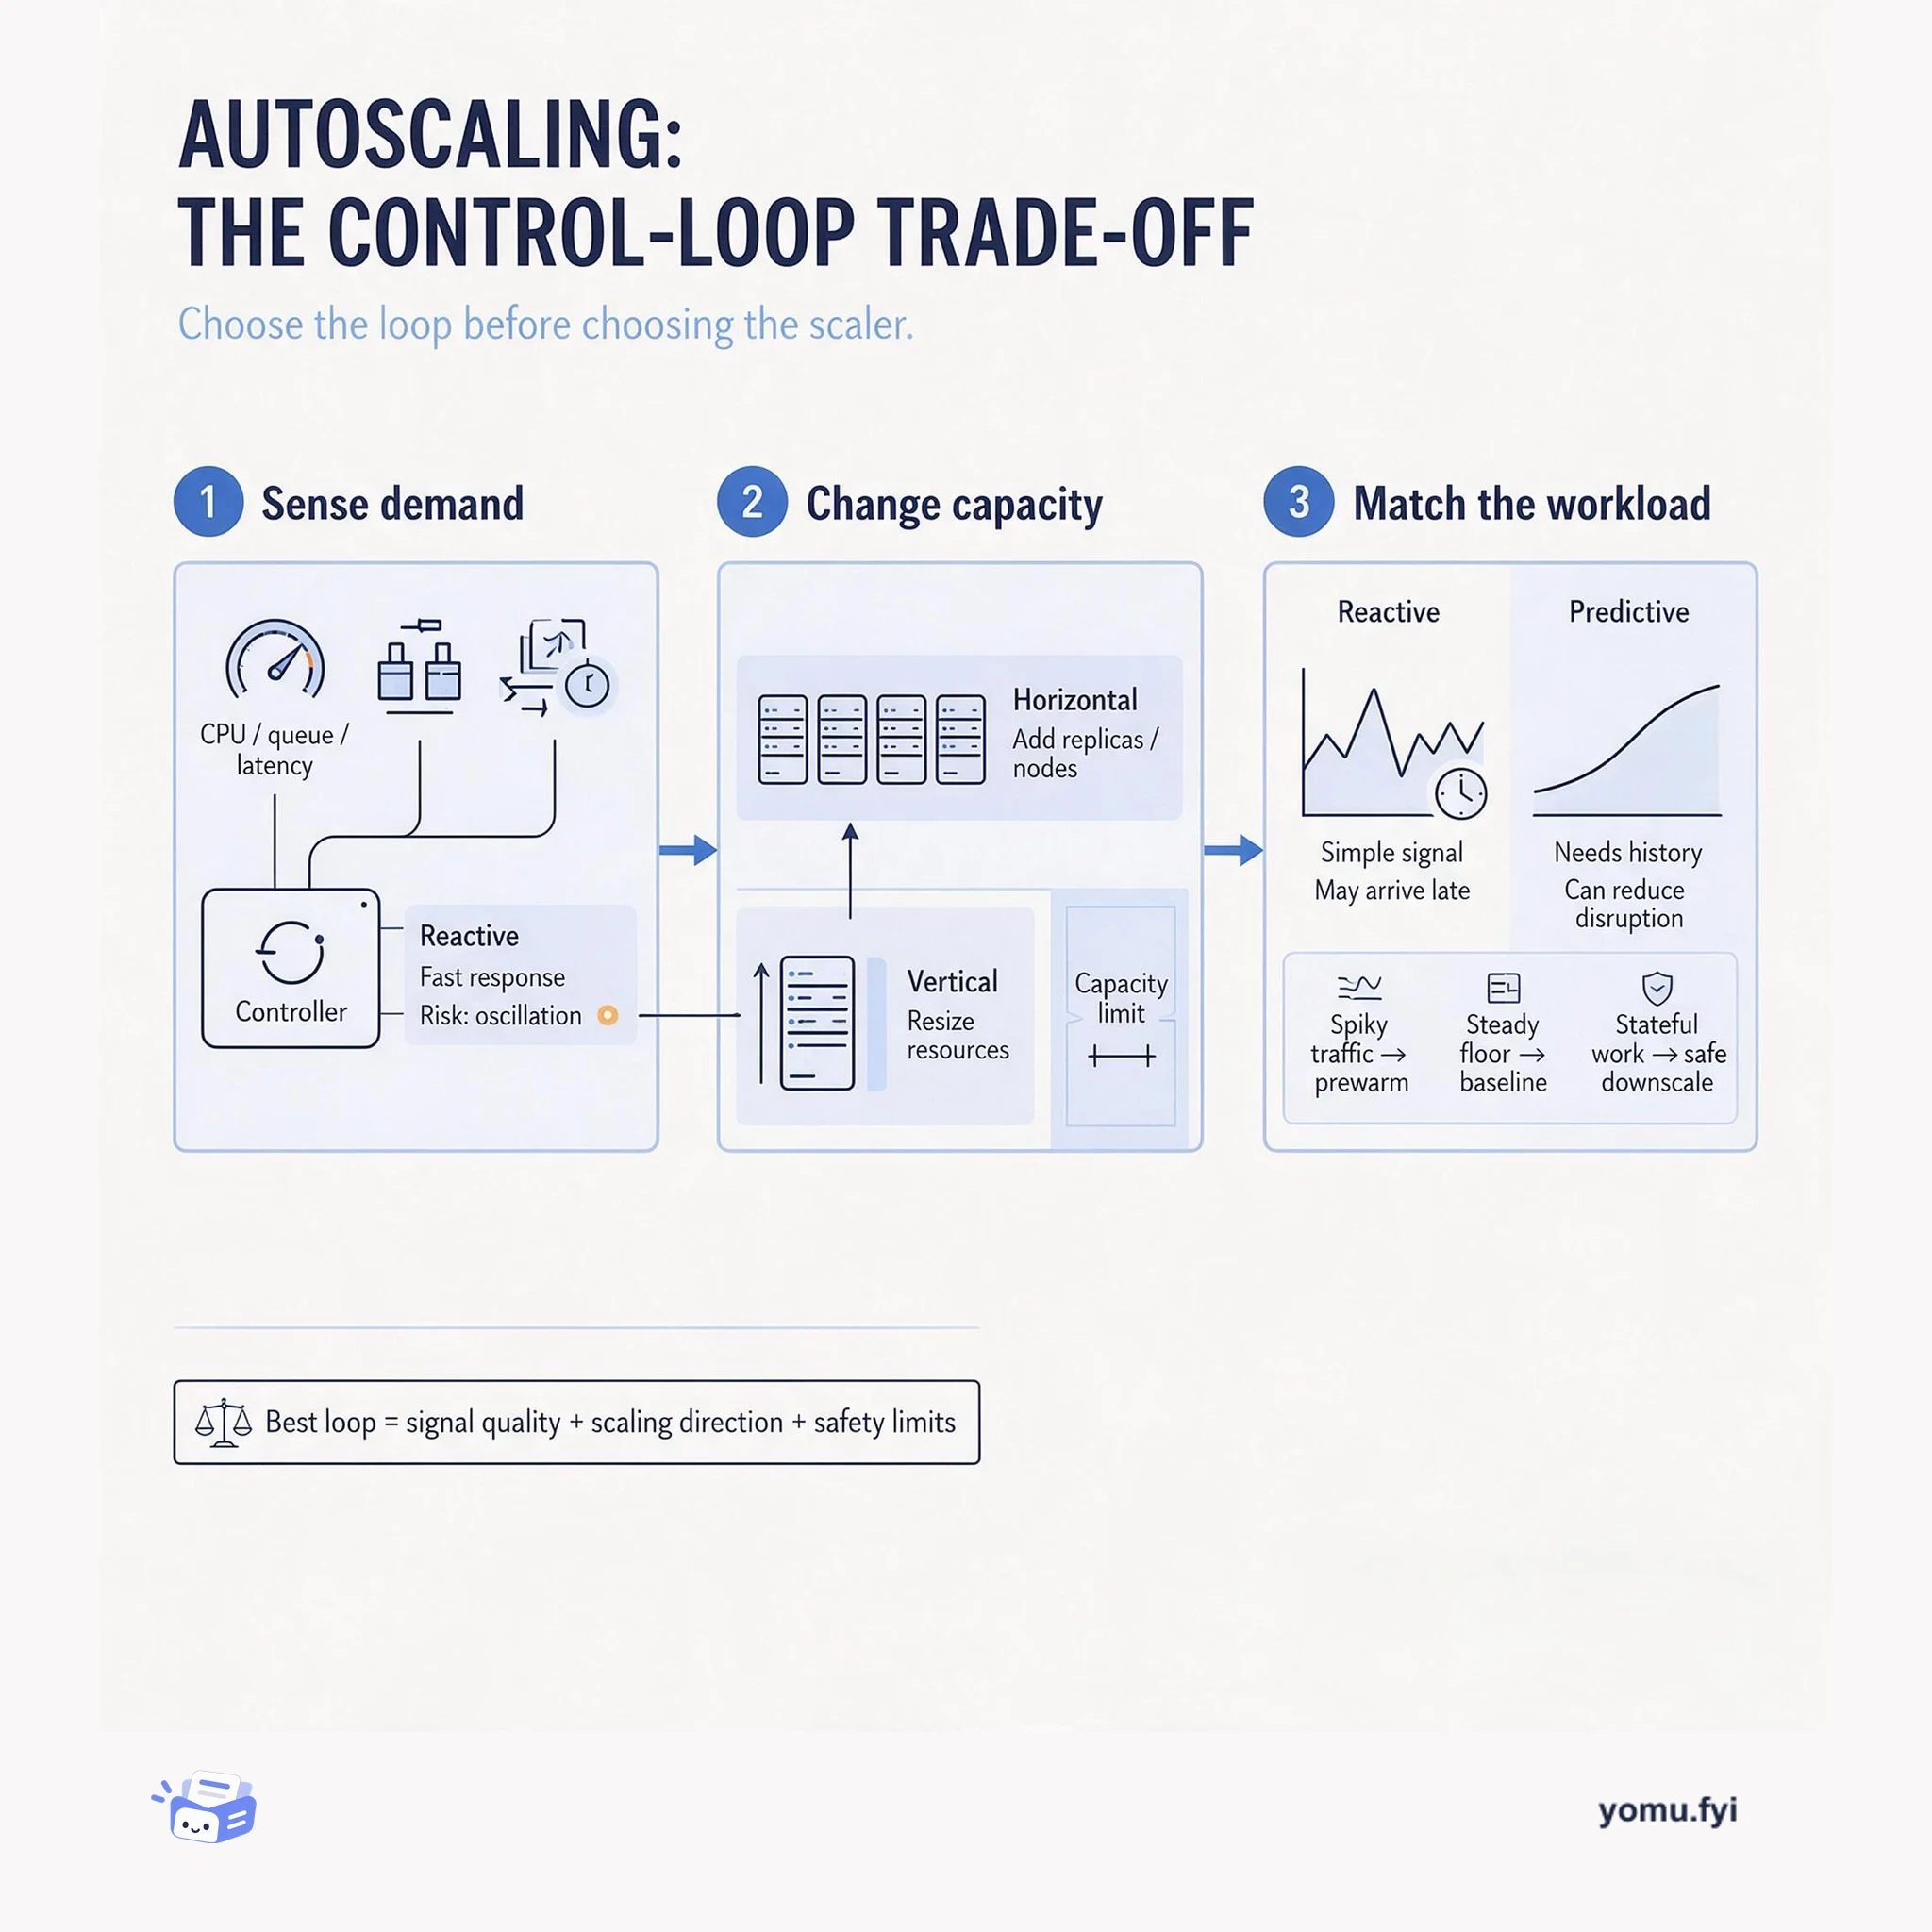
Autoscaling trades responsiveness, stability, and cost: this explainer shows how signal choice, scaling direction, and capacity limits shape the right control loop for a workload.
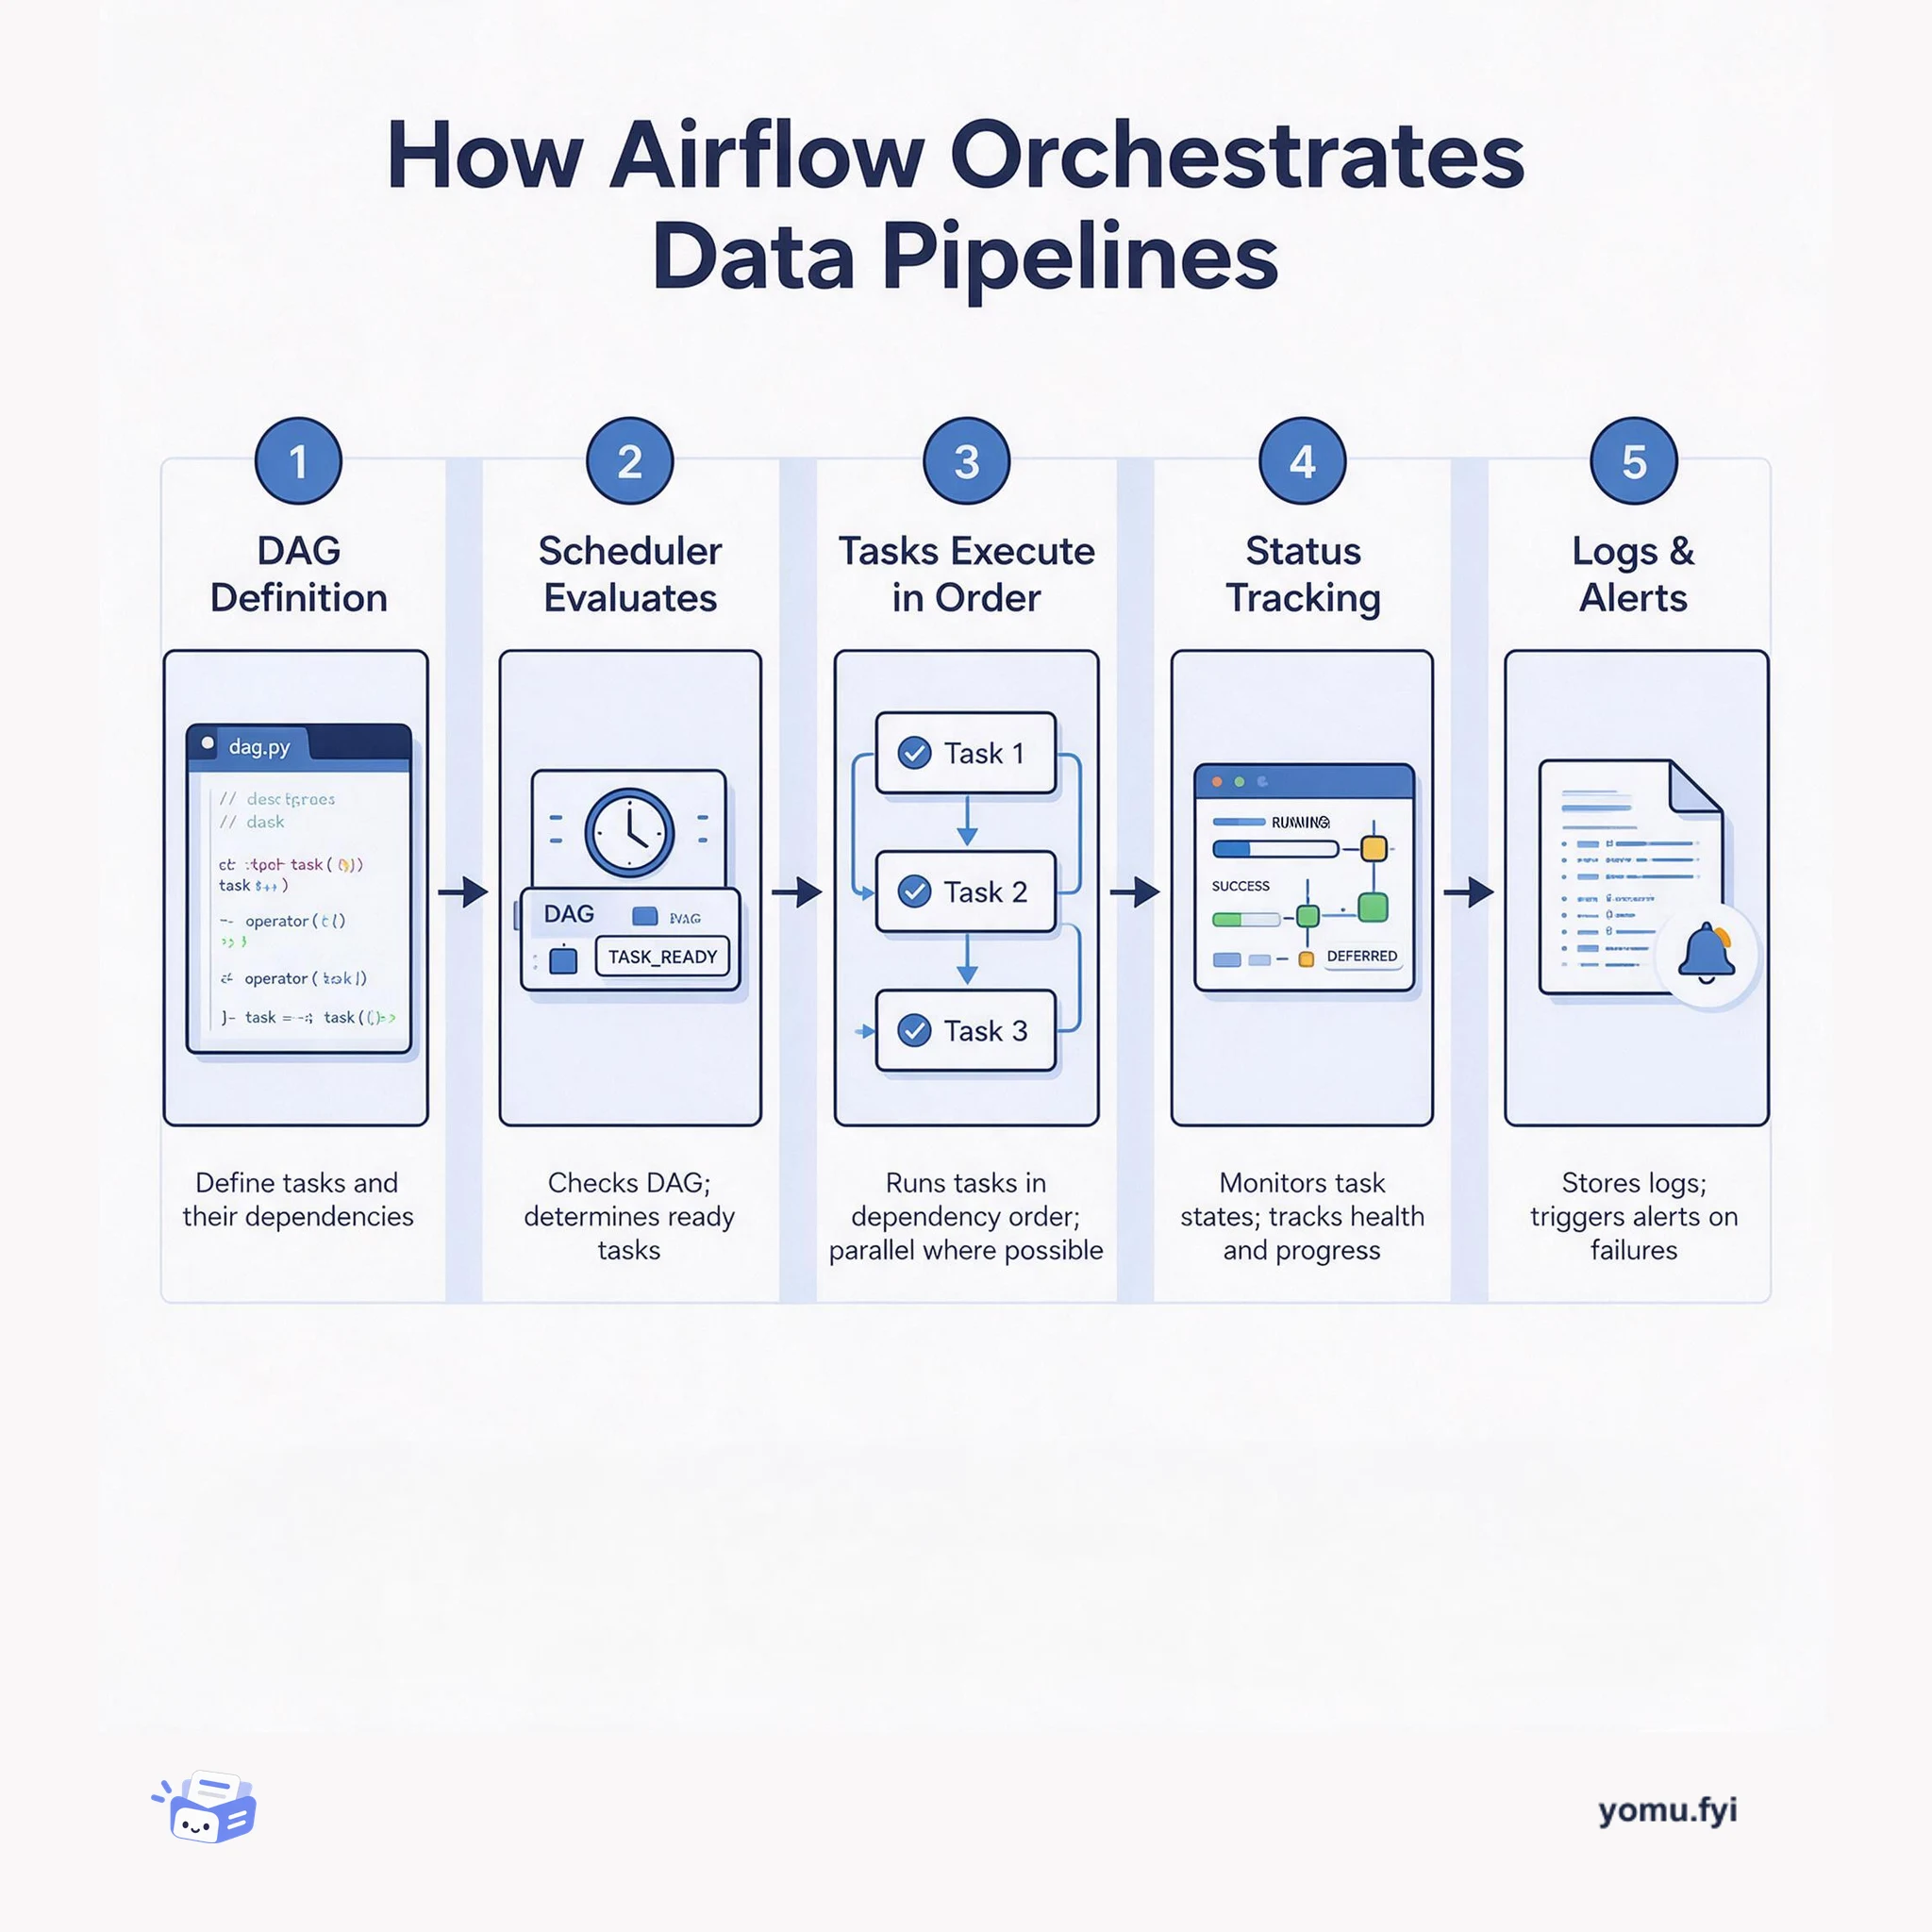
Airflow is a workflow orchestration platform that schedules, monitors, and manages data pipelines by defining tasks as code, executing them in dependency order, and tracking their success or failure.
The Good Stuff
Paid picks we use ourselves. Links carry a referral code — a subscription through one earns us a commission at no extra cost to you.
Newest first
eBay’s Monetization Team lacked a dedicated observability platform, causing fee behavior issues to often be discovered through customer complaints or post-transaction analysis. Data warehouse data arrived with delays, and engineers and business teams had to manually query multiple sources. Minerva solves this with an asynchronous observability pipeline: the fee-processing service places a small record on a local queue, a background producer publishes it to an event stream, and a consumer enriches the data before storing it in ClickHouse. ClickHouse’s columnar storage and MergeTree engine allow fast aggregation queries on records with nearly 250 columns; a proof of concept on 1.1 billion rows returned queries in 0.11 to 0.72 seconds. The design keeps observability off the critical fee path, prioritizing fee-processing availability while providing configurable, context-aware monitoring.
Cyber Week compresses a year’s worth of system failures into 72 hours, making it the ultimate stress test for communication infrastructure. Developers must optimize APIs with rate limiting, caching, and traffic shaping to absorb sudden spikes without dropping connections. Email delivery requires early IP warmup, SPF/DKIM/DMARC configuration, and limiting promotional sends to recently engaged customers to maintain inbox placement. Voice pipelines need proactive capacity planning for Calls Per Second quotas, fallback URLs, and STIR/SHAKEN attestation to prevent fraud and dropped calls. Monitoring should use a unified dashboard with per-channel metrics, correlation IDs, and pre-written runbooks rehearsed in game days to turn inevitable failures into routine events.
MongoDB Atlas’s integration with DataDog now sends custom cluster-level labels as tags on DataDog metrics objects, allowing users to organize and categorize monitoring data in meaningful ways. Users define key-value labels in MongoDB at the cluster level using the Data API or configuration endpoints, and these labels automatically appear as tags in DataDog. These tags can filter metrics in the Metrics Explorer, group data for dashboards, and set alert priorities based on attributes such as environment, application, or region. For instance, tag-based monitors can trigger a P2 alert for production clusters exceeding query targeting thresholds while assigning lower priority to non-production clusters. This enhancement, available on Atlas M10 cluster tiers and higher, leverages existing MongoDB labeling infrastructure to improve observability and drive business-specific alerting and dashboarding logic.
Seer Agent, Sentry’s AI debugging assistant, now performs write actions through the Sentry API, such as setting up custom dashboards, creating monitors and alerts, and assigning, resolving, and archiving issues. It defaults to the user’s permission level and explicitly requests permission for tasks outside its write scope, with permissions not persisting beyond a single chat. The agent can also incorporate infrastructure data from external monitoring platforms like Datadog and Google Cloud Platform via Seer Connectors, using API keys instead of OAuth. This allows Seer Agent to diagnose issues by connecting front-end and back-end data beyond Sentry’s native scope. These updates evolve Seer Agent from a conversational rubber duck into a proactive debugging assistant that can act on behalf of users.
Agentforce Health Monitoring (AHM) addresses silent availability failures in production AI agents that traditional monitoring misses because agents can appear healthy even when unreachable. The team unified telemetry from approximately five or six locations across sessions, reasoning steps, tool calls, errors, and escalations into a coherent representation. End-to-end alerting latency was reduced from roughly 20 minutes to several minutes by converting Data 360 ingestion to streaming and simplifying query complexity. AHM provides 16+ built-in metrics including agent availability, error rate, response/escalation rate, engagement, and latency, with a drill-down interface connecting alerts to session context. The roadmap includes cost, TTFT/TTLT, toxicity, feedback metrics, RAG Quality Monitoring integration, and eventually a runtime insight agent for root-cause analysis and automated remediation.
Gray failures are partial customer-facing problems that can leave health checks green while a subset of users quietly fails. RADAR (Reliability Anomaly Detection, Alerting, and Root-cause analysis) addresses this gap by collecting error counts and distinct affected users, segmented by error code and region, then applying the unsupervised streaming SPOT model. SPOT learns normal behavior from the previous 14 days using a single risk parameter, while downstream stages enrich, filter, deduplicate, and route alerts before providing anomaly details and AI/BI Genie-backed dashboards for investigation. Running RADAR internally reduced incident-discovery time by 95% with over 90% precision and no human needed to spot the pattern. The post also describes a Databricks scaffold that maps metrics, detection, alerting, and root-cause analysis to platform components and can be assembled by an AI agent from a metric, scaffold, and prompt.
An account of three days in the Netherlands covers talks at PGDay Lowlands in Utrecht and Percona Live 2026 in Amsterdam, including a five-minute presentation on ClickHouse integrations and a PostgreSQL 19 monitoring session. pg_clickhouse uses a foreign data wrapper to expose ClickHouse tables as PostgreSQL foreign tables, allowing existing queries, ORMs, and dashboards to continue working while pushable work runs in ClickHouse; 15 of 22 TPC-H queries at scale factor 1 are fully pushed down. pg_stat_ch captures per-query execution events in a shared-memory ring buffer and sends batches to ClickHouse, dropping events rather than blocking PostgreSQL when ClickHouse is unavailable. The monitoring talk covered PostgreSQL 19 logging, WAL and I/O statistics, WAIT FOR, new system views, and multixact and wraparound changes. The post also reports talks on optimizer hints and plan stabilization, and says both conferences will return in 2027.
Modern storefronts can appear healthy while malicious JavaScript diverts affiliate credit, hijacks searches or clicks, tampers with analytics, or loads further code. Cloudflare describes four operations spanning eight payloads that Page Shield ML detected in live traffic; humans verified the findings afterward, while seven payloads were absent from VirusTotal and none received a malicious verdict from URLScan. The detection system represents JavaScript as a graph with a graph neural network (GNN), sends fewer than 0.3% of analyzed scripts to a lightweight LLM on Workers AI, and uses a teacher cohort of frontier models for difficult investigations. This combination handles minification, renaming, some obfuscation, and behavior gated by device, time, geography, referrer, browser state, or cooldowns. The post concludes that continuous browser visibility and runtime context are needed because static, one-time scans can miss selectively executed attacks.
The August ClickStack update covers five releases, v2.34 through v2.38, with dashboards as the main focus. Dashboard variables are generally available, letting filters supply selected values to raw SQL, builder fields, Lucene, and PromQL queries, while chained filters can narrow one another. Charts add formulas for combining series, a metrics explorer previews emitted metrics, and release markers align service versions with events such as latency spikes. The update also introduces the TimeSeries engine and PromQL support in private preview for Managed ClickStack and experimentally in open source, alongside a beta LLM observability dashboard, alerting improvements, OIDC collector authentication, and MCP server changes, including up to ten notification targets, alert names and tags, evaluation history through the API, and richer webhook payloads.
After ReSharper’s out-of-process (OOP) architecture launched, users reported slower Windows startup, and profiling traced the delay to Microsoft Defender scanning the separate process. Defender spends only a couple of seconds on processes in write-protected paths but can add tens of seconds when ReSharper loads DLLs from a user installation directory. The investigation used Microsoft Defender ETW logs and direct CPU-time measurements, with cold-start tests repeated 10 times inside an 8-vCPU, 8-GB Hyper-V VM; JetBrains IDEs took roughly 10–40 seconds to scan, while Microsoft IDEs and other editors stayed under one second. Collaboration with Microsoft led to Defender optimizations in version 1.449.454.0, improving scanning for ReSharper OOP and Rider in write-protected directories. JetBrains also released the Defender Performance Tool for live monitoring, offline snapshots, and CSV export.
PostgreSQL 19 adds four system views for lock contention, recovery, autovacuum priorities, and dynamic shared memory allocations. The article presents pg_stat_lock as cumulative, cluster-wide statistics with one row per lock type, reporting waits, total wait time, fastpath_exceeded, and stats_reset; waits and wait_time count only successfully acquired locks that exceeded deadlock_timeout, while fast-path overflow attempts are counted separately. Examples reset statistics, reproduce a 2.5-second table lock, and scan 140 partitions, producing 1 wait, 2201.783 milliseconds, and 422 fast-path overflows. The post describes recovery and autovacuum views, noting that autovacuum scores suggest likely priorities rather than guarantees because scoring and worker scheduling can differ. DSM registry entries expose name, type, and size; NULL means initialization failed.
Cliparr’s video size estimator was intended to predict output size from target bitrate multiplied by clip duration, but real-world results could vary because its VBR encoder changes bitrate with content. Rather than manually testing a matrix of formats, codecs, and quality settings, the author extracted the browser-based export engine into Cliparr Convert, a standalone static converter, and instrumented it with anonymous Sentry Application Metrics. Completed conversions record actual and estimated bytes, their ratio and delta, plus attributes such as output format, quality, and estimator basis; counters also track conversion completion and the progressive web app installation funnel. The resulting dashboard exposed an estimate that was off by 83% and supports grouping real usage by conversion conditions, while sending only numeric metrics and not media, filenames, or URLs.
Sending email to Google requires understanding differences between consumer Gmail and Google Workspace, plus the authentication and reputation signals used by Google’s filtering systems. The guide says SPF and DKIM are required for all senders, while DMARC is required for senders exceeding 5,000 messages per day to Google inboxes; it also gives a bounce example for missing alignment. It recommends keeping user-reported spam below 0.1%, never reaching 0.3%, and providing one-click unsubscribe handling. Google Postmaster Tools reports compliance, spam rate, authentication success, and delivery errors, while the Feedback-ID header enables aggregate complaint analysis by campaign or sender ID. Workspace administrators can apply additional filters, so successful delivery to Gmail does not guarantee placement in a corporate Workspace inbox.
GPU-pruner addresses idle GPU allocation in Kubernetes by identifying workloads whose hardware activity remains below a configured threshold, rather than relying on browser sessions, network traffic, or pod lifetime. It queries Prometheus for NVIDIA Data Center GPU Manager metrics, including engine activity and GPU utilization, and treats peak performance below 1% throughout a default 35-minute observation window as idle. After tracing an idle pod through ownerReferences or KServe labels, it scales the parent resource to zero, preserving workload metadata for later restoration. Slack notifications, grace periods, lookback checks, and dry-run mode provide safeguards, while Prometheus label handling must preserve the workload namespace and pod identity in DCGM telemetry.
Indra Renewable Technologies consolidated a fragmented EV-charging data estate spanning Cosmos DB, Synapse, Azure Data Lake Storage, Azure Functions, Power BI, and other services onto Databricks. The migration began with a parallel Synapse prototype and expanded to Delta tables, a consolidated fleet pipeline, and greater use of Databricks for operational workloads. A medallion architecture stores raw fleet data in bronze, transforms it with PySpark in silver, and publishes gold tables for reporting and client delivery; one pipeline now serves three clients and improved performance by 60% to 70%. Unity Catalog, serverless SQL warehouses, AI/BI dashboards, and Genie Agents support governed self-service analytics, while reported results include 80% to 90% business cost savings, 90% storage savings, and query latency falling from 24.4 seconds to 3.5 seconds.
Grab’s data mesh uses the Signals Marketplace to publish, discover, and reuse trusted data products, while certification establishes ownership, documentation, lineage, and quality controls but does not prevent runtime failures. Data Production Issues (DPIs) turn data-quality signals into an operational workflow that begins when Kinabalu detects unhealthy contract tests and closes when the underlying condition recovers. Triage promotes meaningful contract breaches, deduplicates repeated signals, groups related issues, and records affected assets, intervals, contracts, tests, and dependencies. For diagnosis, the Data Health API exposes a portable taxonomy of UPSTREAM_ERROR, PLATFORM_ERROR, JOB_ERROR, and DATA_ERROR, allowing ownership to follow the likely root cause while platforms retain detailed internal diagnostics. Combined with Hugo’s diagnosis and remediation patterns, the approach is presented as reducing resolution time and feeding operational reliability back into certification.
The article examines whether ClickHouse is “winning” observability by separating the storage-and-query question from the broader work of collection, schema design, correlation, visualization, alerting, and investigation. It argues that ClickHouse fits telemetry because its columnar layout stores fields separately, enabling compression and allowing analytical queries to read only selected columns across millions or billions of events; ordering keys, sparse primary indexes, and data-skipping indexes further reduce work. The discussion covers both rich, wide events and conventional logs, traces, and metrics, and presents ClickStack as a combination of ClickHouse, an OpenTelemetry Collector, and a UI that preserves familiar workflows. The conclusion is qualified: ClickHouse has become the de facto storage and query engine for many teams and a strong default for large telemetry workloads, but it has not won observability as a whole, while full-text indexes, PromQL support, and broader product layers remain important.
Traditional application monitoring treats AI workflows as black boxes, leaving engineering teams unable to determine whether incorrect responses result from model hallucinations or erroneous upstream tool data. MLflow provides AI observability by capturing distributed traces containing model calls, prompts, retrieved context, execution latencies, and tool interactions. In an example mortgage lending application, trace inspection revealed that an AI assistant accurately summarized raw JSON data returned by an internal pipeline tool rather than hallucinating conflicting metrics. Beyond latency attribution and tool debugging, MLflow is compatible with OpenTelemetry and provides automatic tracing integrations for frameworks such as LangChain and Claude Code. Capturing these traces enables teams to evaluate subsequent application versions, detect model provider shifts, and identify tool regressions before reaching users.
Session replay software varies fundamentally based on architecture, distinguishing tools designed for product analytics from those built for developer debugging. Recording approaches split into DOM snapshot and mutation capture, which optimizes for compression and structured debugging, versus pixel capture, which favors visual fidelity for complex animations. Privacy depends heavily on masking location, where client-side masking redacts data before network transmission, whereas server-side scrubbing acts after transmission. For engineering teams, integration depth connects replays natively to traces, console errors, and backend issues rather than requiring timestamp lookups across separate products. Performance costs across CPU, memory, and network require benchmarking on target applications alongside strategies like error-based sampling.
With the 2026.2 release, JetBrains expanded its OpenTelemetry plugin from Rider to IntelliJ IDEA, GoLand, PyCharm, and WebStorm. The tool captures logs, metrics, traces, and service maps locally without requiring an external observability backend. Developers can search structured log records, plot metric values over time, inspect distributed spans, and verify communication paths across databases and message queues during local runs. To ingest telemetry, the plugin automatically configures OpenTelemetry Protocol environment variables for supported run configurations and terminal sessions, or accepts forwarded data from existing collectors. Additionally, experimental Model Context Protocol support allows AI coding agents to query gathered logs, spans, and service topology.
The best engineering reads, once a week.