Five Checkpoints to Bitwise-Deterministic Training Runs
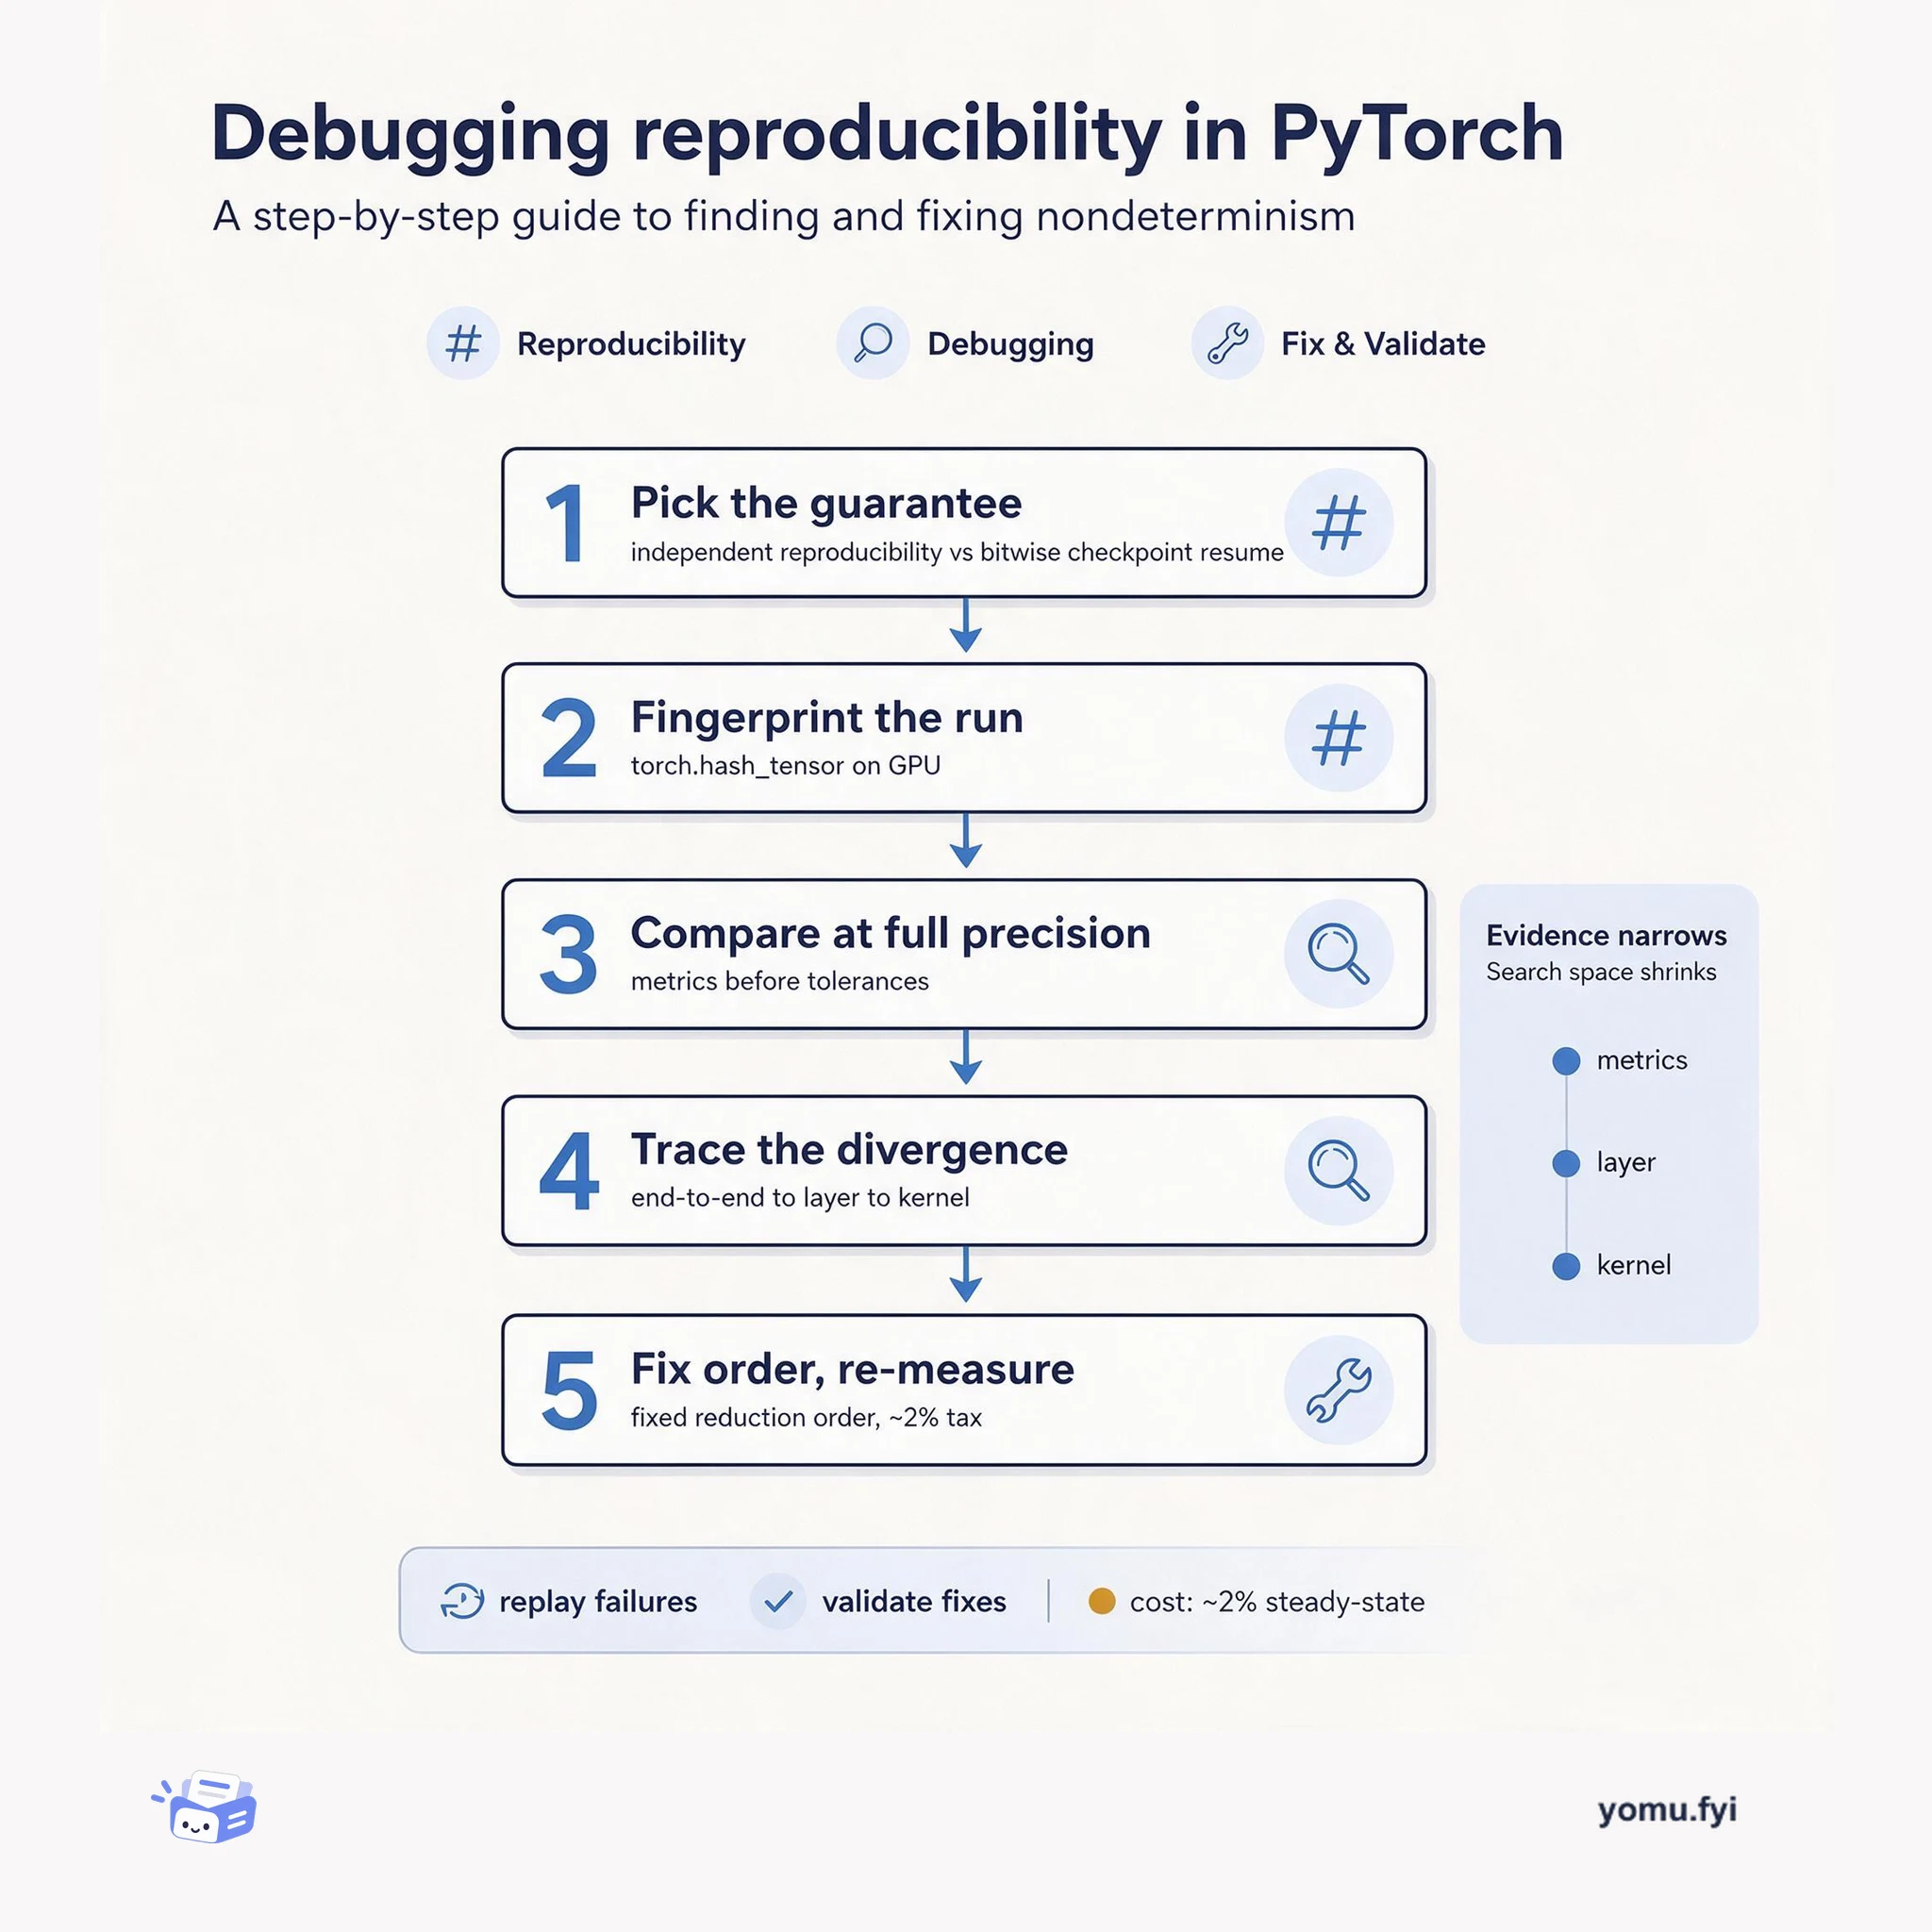
A five-checkpoint workflow for making large-scale training runs bitwise reproducible: pick the guarantee, fingerprint the run, and trace divergence down to the kernel.
 JetbrainsJakub ChrzanowskiAnnouncement
JetBrains Marketplace now provides UI freeze reports for plugin authors, accessible from the Freezes tab after enabling Marketplace reporting via the JetBrainsMarketplaceErrorReportSubmitter handler in plugin.xml. Reports are grouped by error type, with each pile showing a representative report and a thread-dump excerpt that identifies threads involved, such as the event dispatch thread (EDT), helping spot recurring patterns. Full thread dumps captured every five seconds during the freeze are available, along with optional CPU snapshots and performance metrics, and comparing dumps across samples can reveal persistent operations. The analyze-freeze skill guides AI agents through investigating IntelliJ Platform thread dumps, focusing on the EDT, coroutine behavior, and common patterns like non-cancellable read actions blocking the UI, with suggestions for fixes. Before fixing, authors should check the plugin version, keep blocking I/O outside read actions, and test changes by repeating the operation and examining fresh diagnostic evidence.
When a user reports that the IDE stopped responding and a plugin is suspected, reproducing the freeze is often impossible without detailed diagnostic data such as thread dumps captured during the stall.
Register the JetBrainsMarketplaceErrorReportSubmitter error handler in plugin.xml to enable Marketplace reporting. Then access freeze reports from the Freezes tab, use thread dumps and the analyze-freeze skill to investigate UI freezes.
UI freeze reports are grouped by error type and show representative reports with thread-dump excerpts, allowing pattern recognition without opening every occurrence.
Full thread dumps are captured every five seconds during a freeze, and comparing them across samples can reveal whether the same operation remains on the stack.
The analyze-freeze skill provides guidance for AI agents to investigate thread dumps, focusing on the EDT and common patterns like non-cancellable read actions blocking the UI.
Register the JetBrainsMarketplaceErrorReportSubmitter error handler in plugin.xml under the com.intellij extensions. This handler is available since IntelliJ Platform 2023.3 and requires no custom implementation. Users can then submit reports through the IDE's error-reporting UI or automatically if they enable background reporting.
Reports include a thread-dump excerpt showing threads involved in the freeze, full thread dumps captured every five seconds, and optionally a CPU snapshot (snapshot.jfr), an analysis report (report.txt), and performance metrics (open-telemetry-metrics.csv).
Save the SKILL.md file from the gist, add full thread dumps and other files, then ask your AI agent to read the skill and analyze the dumps starting with the EDT, tracing what prevents it from progressing, and citing dump evidence for each conclusion.
Summaries are generated from the original by a language model. Check the original before relying on it.
See the idea
A five-checkpoint workflow for making large-scale training runs bitwise reproducible: pick the guarantee, fingerprint the run, and trace divergence down to the kernel.
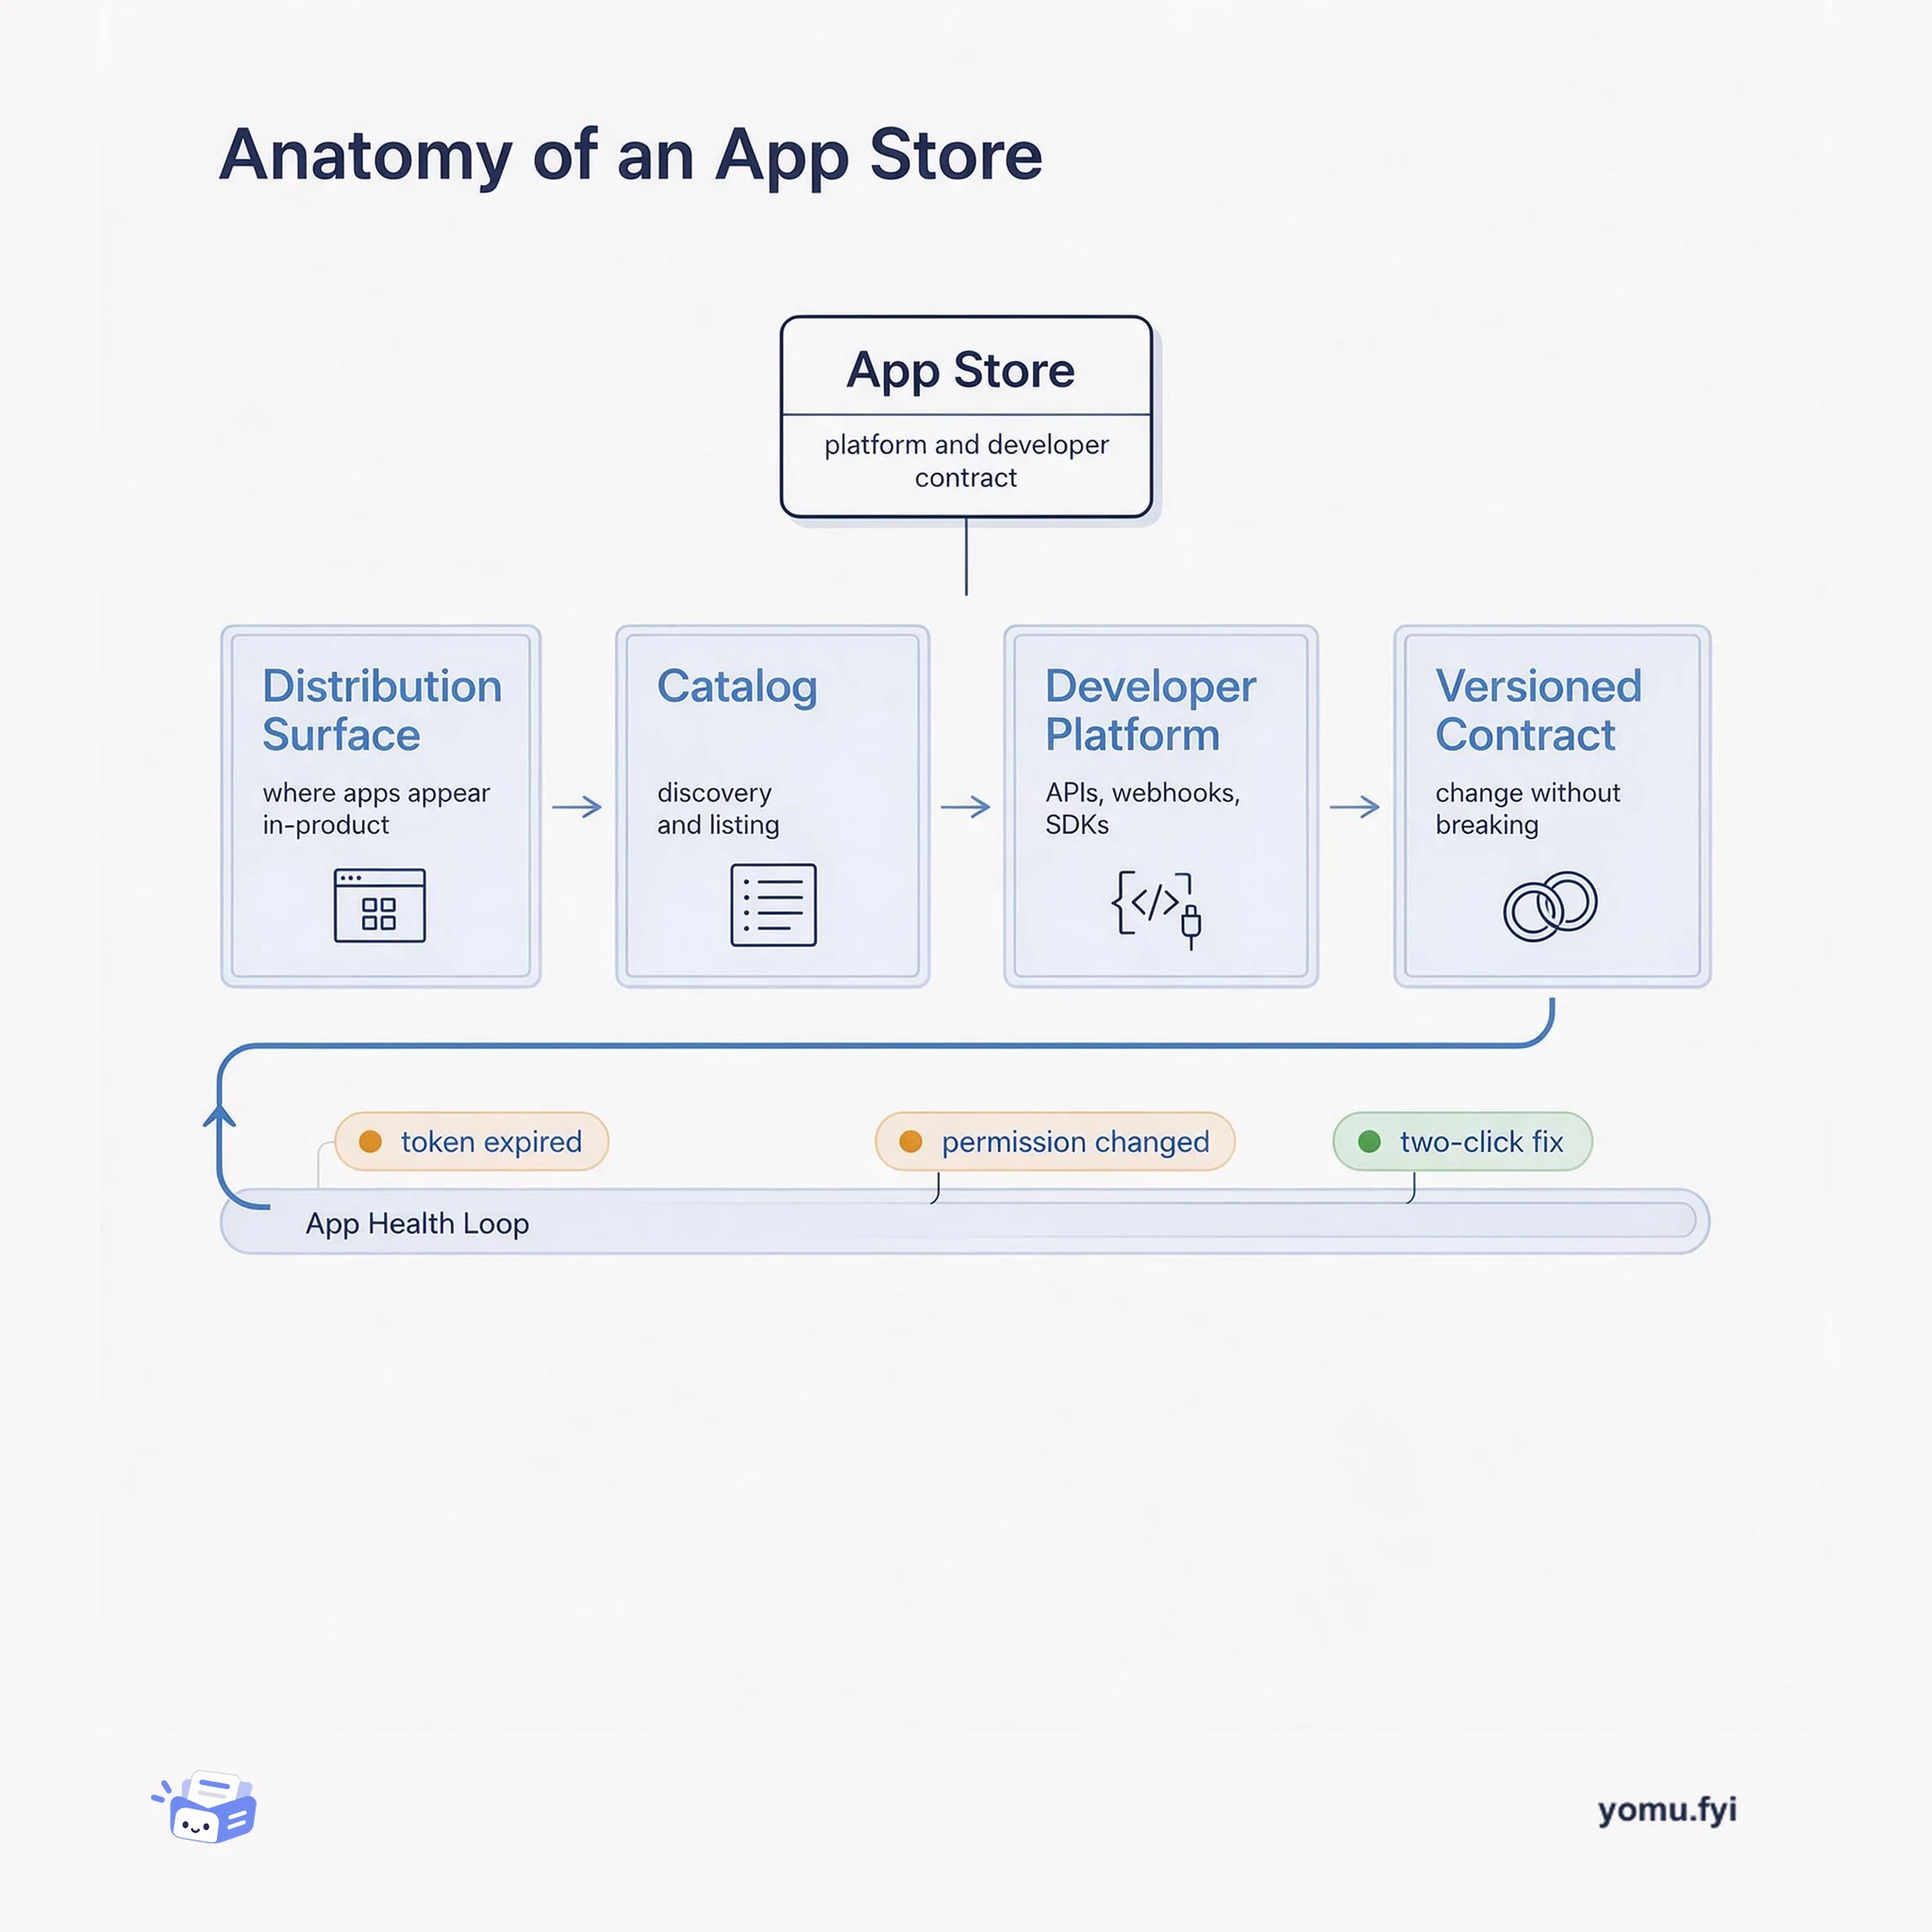
An app store is a distribution surface, a versioned contract, and a health loop between a platform and its developers. Here is how those parts fit together and why each one fails loudly if ignored.
Keep reading
The Good Stuff
Paid picks we use ourselves. Links carry a referral code — a subscription through one earns us a commission at no extra cost to you.
One useful email. Unsubscribe anytime.