Analytics Is a Signal-Selection Problem
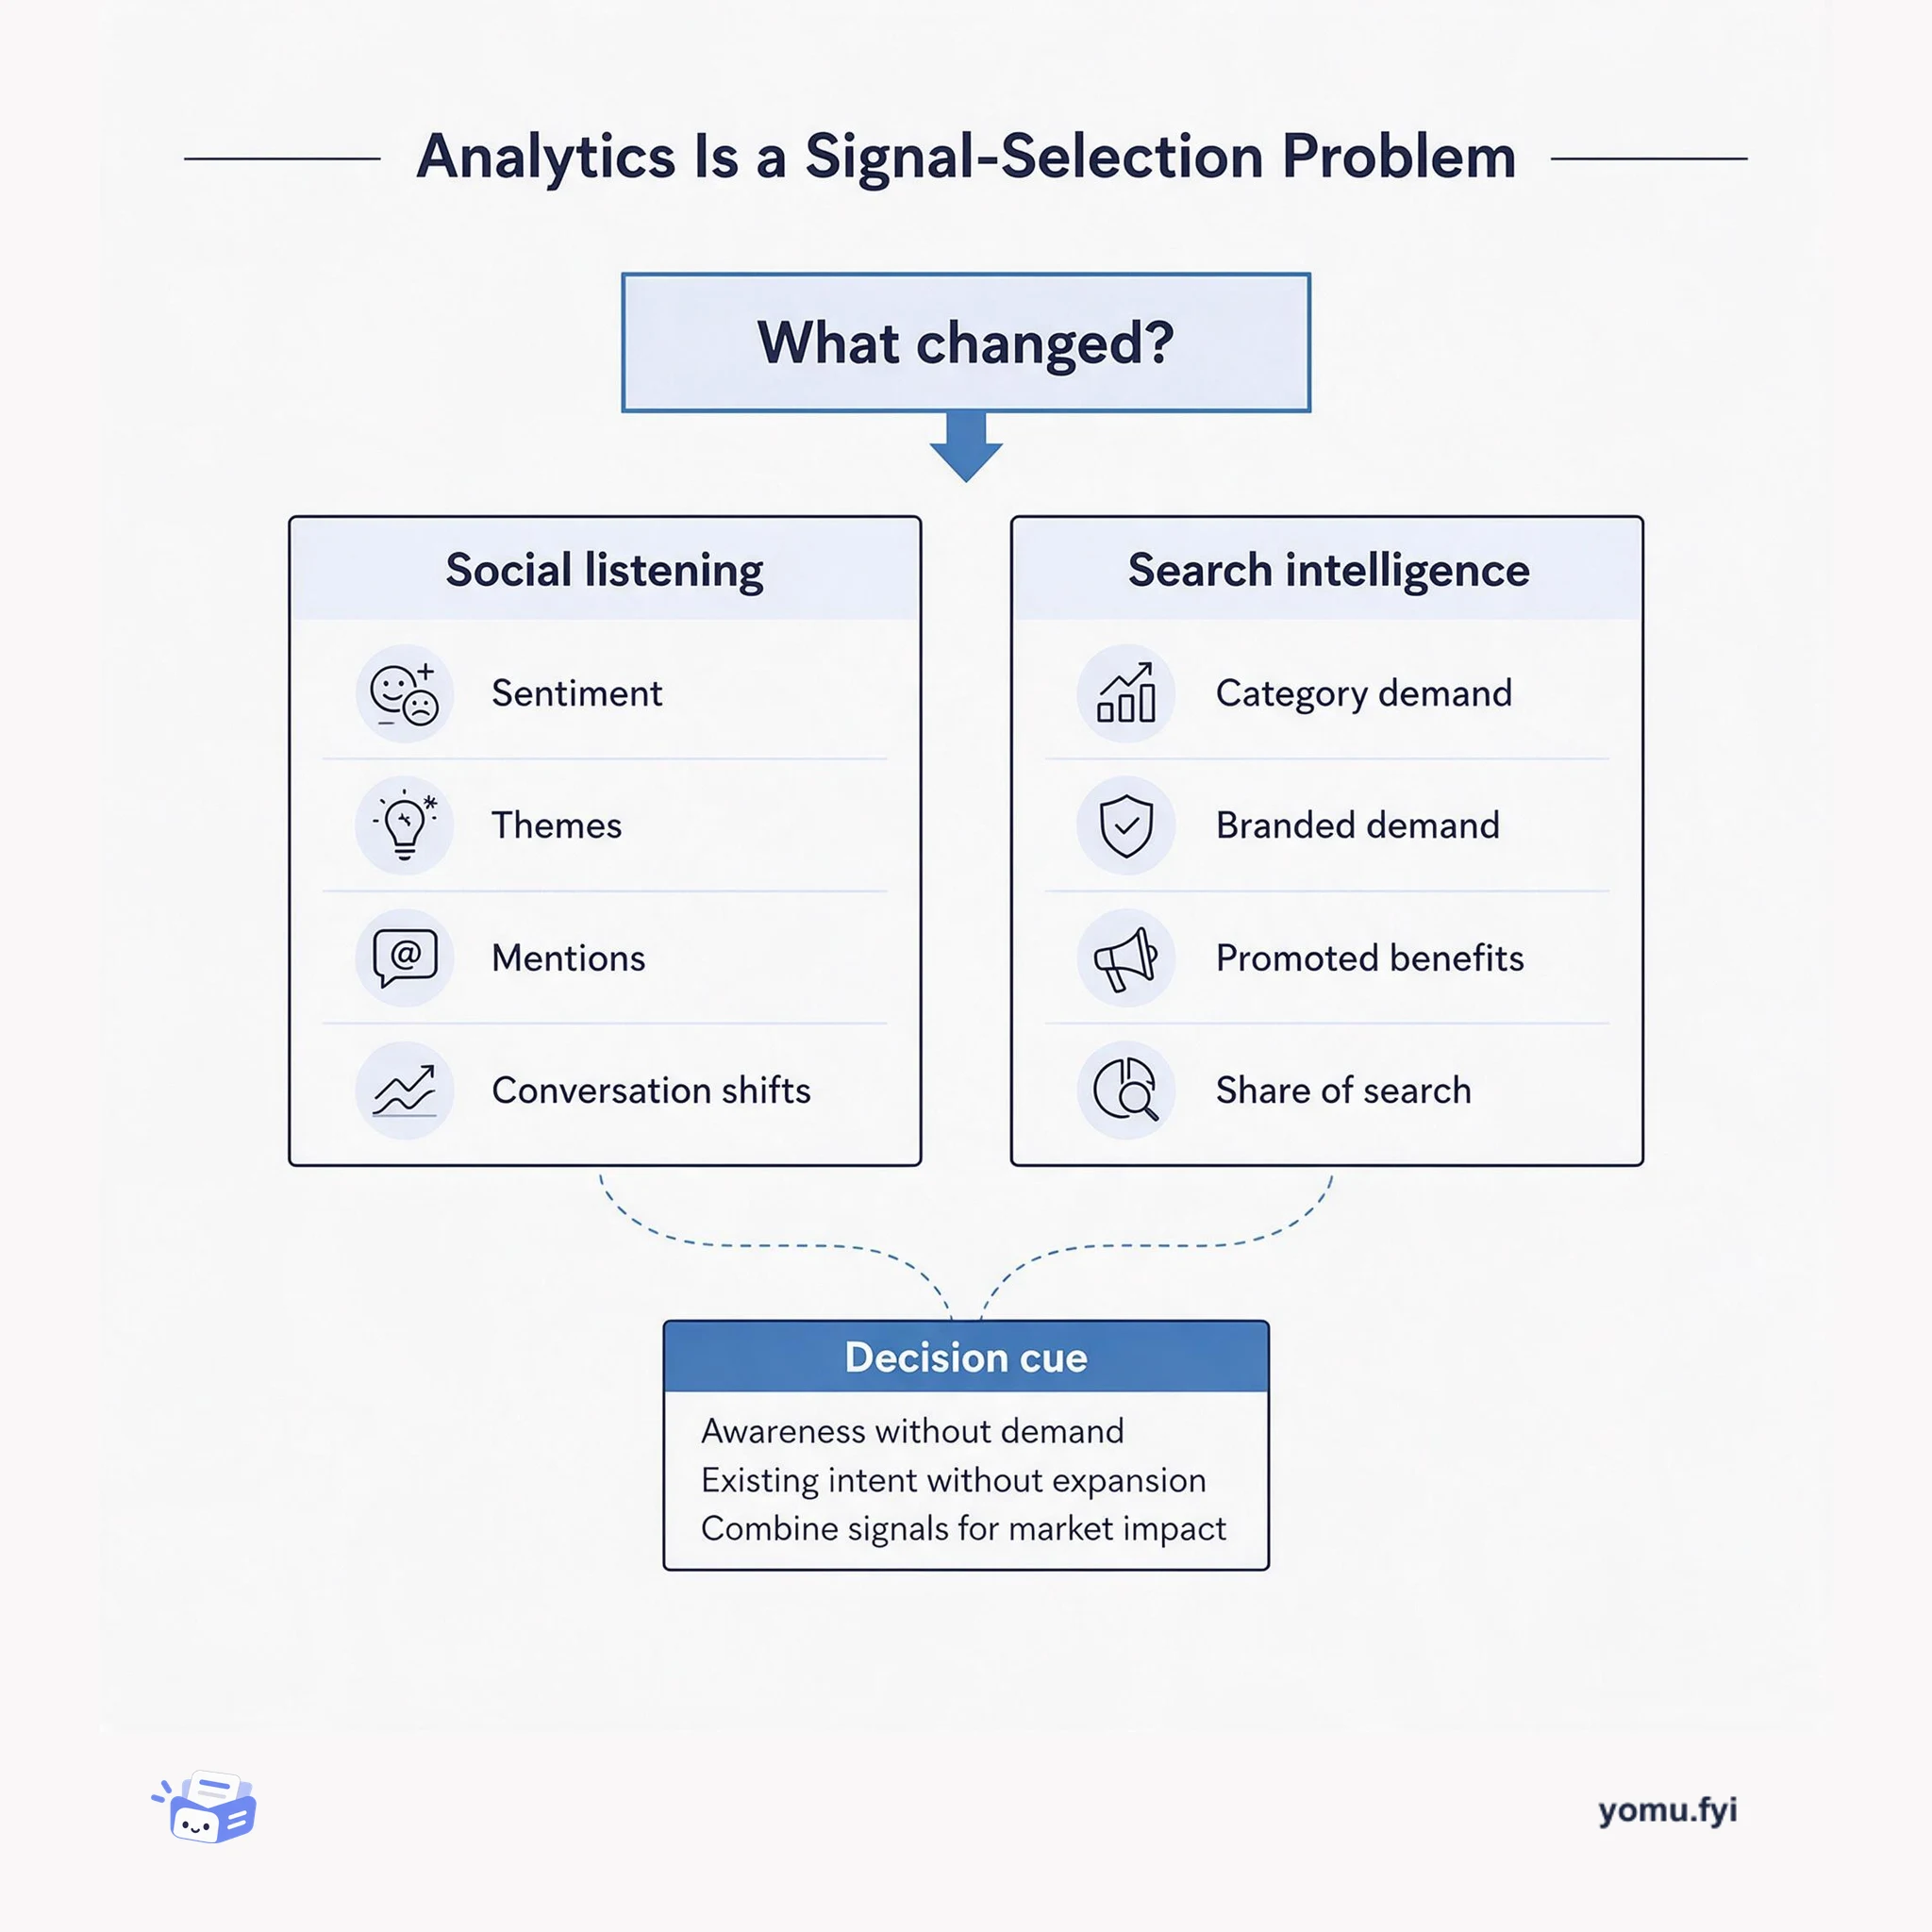
Compare social listening with search intelligence to see which signals answer questions about perception, demand, and campaign impact—and when combining them is more useful.
Loading…
Topic
66 posts about Data Analytics. Every summary links to the original.
See the idea
Compare social listening with search intelligence to see which signals answer questions about perception, demand, and campaign impact—and when combining them is more useful.
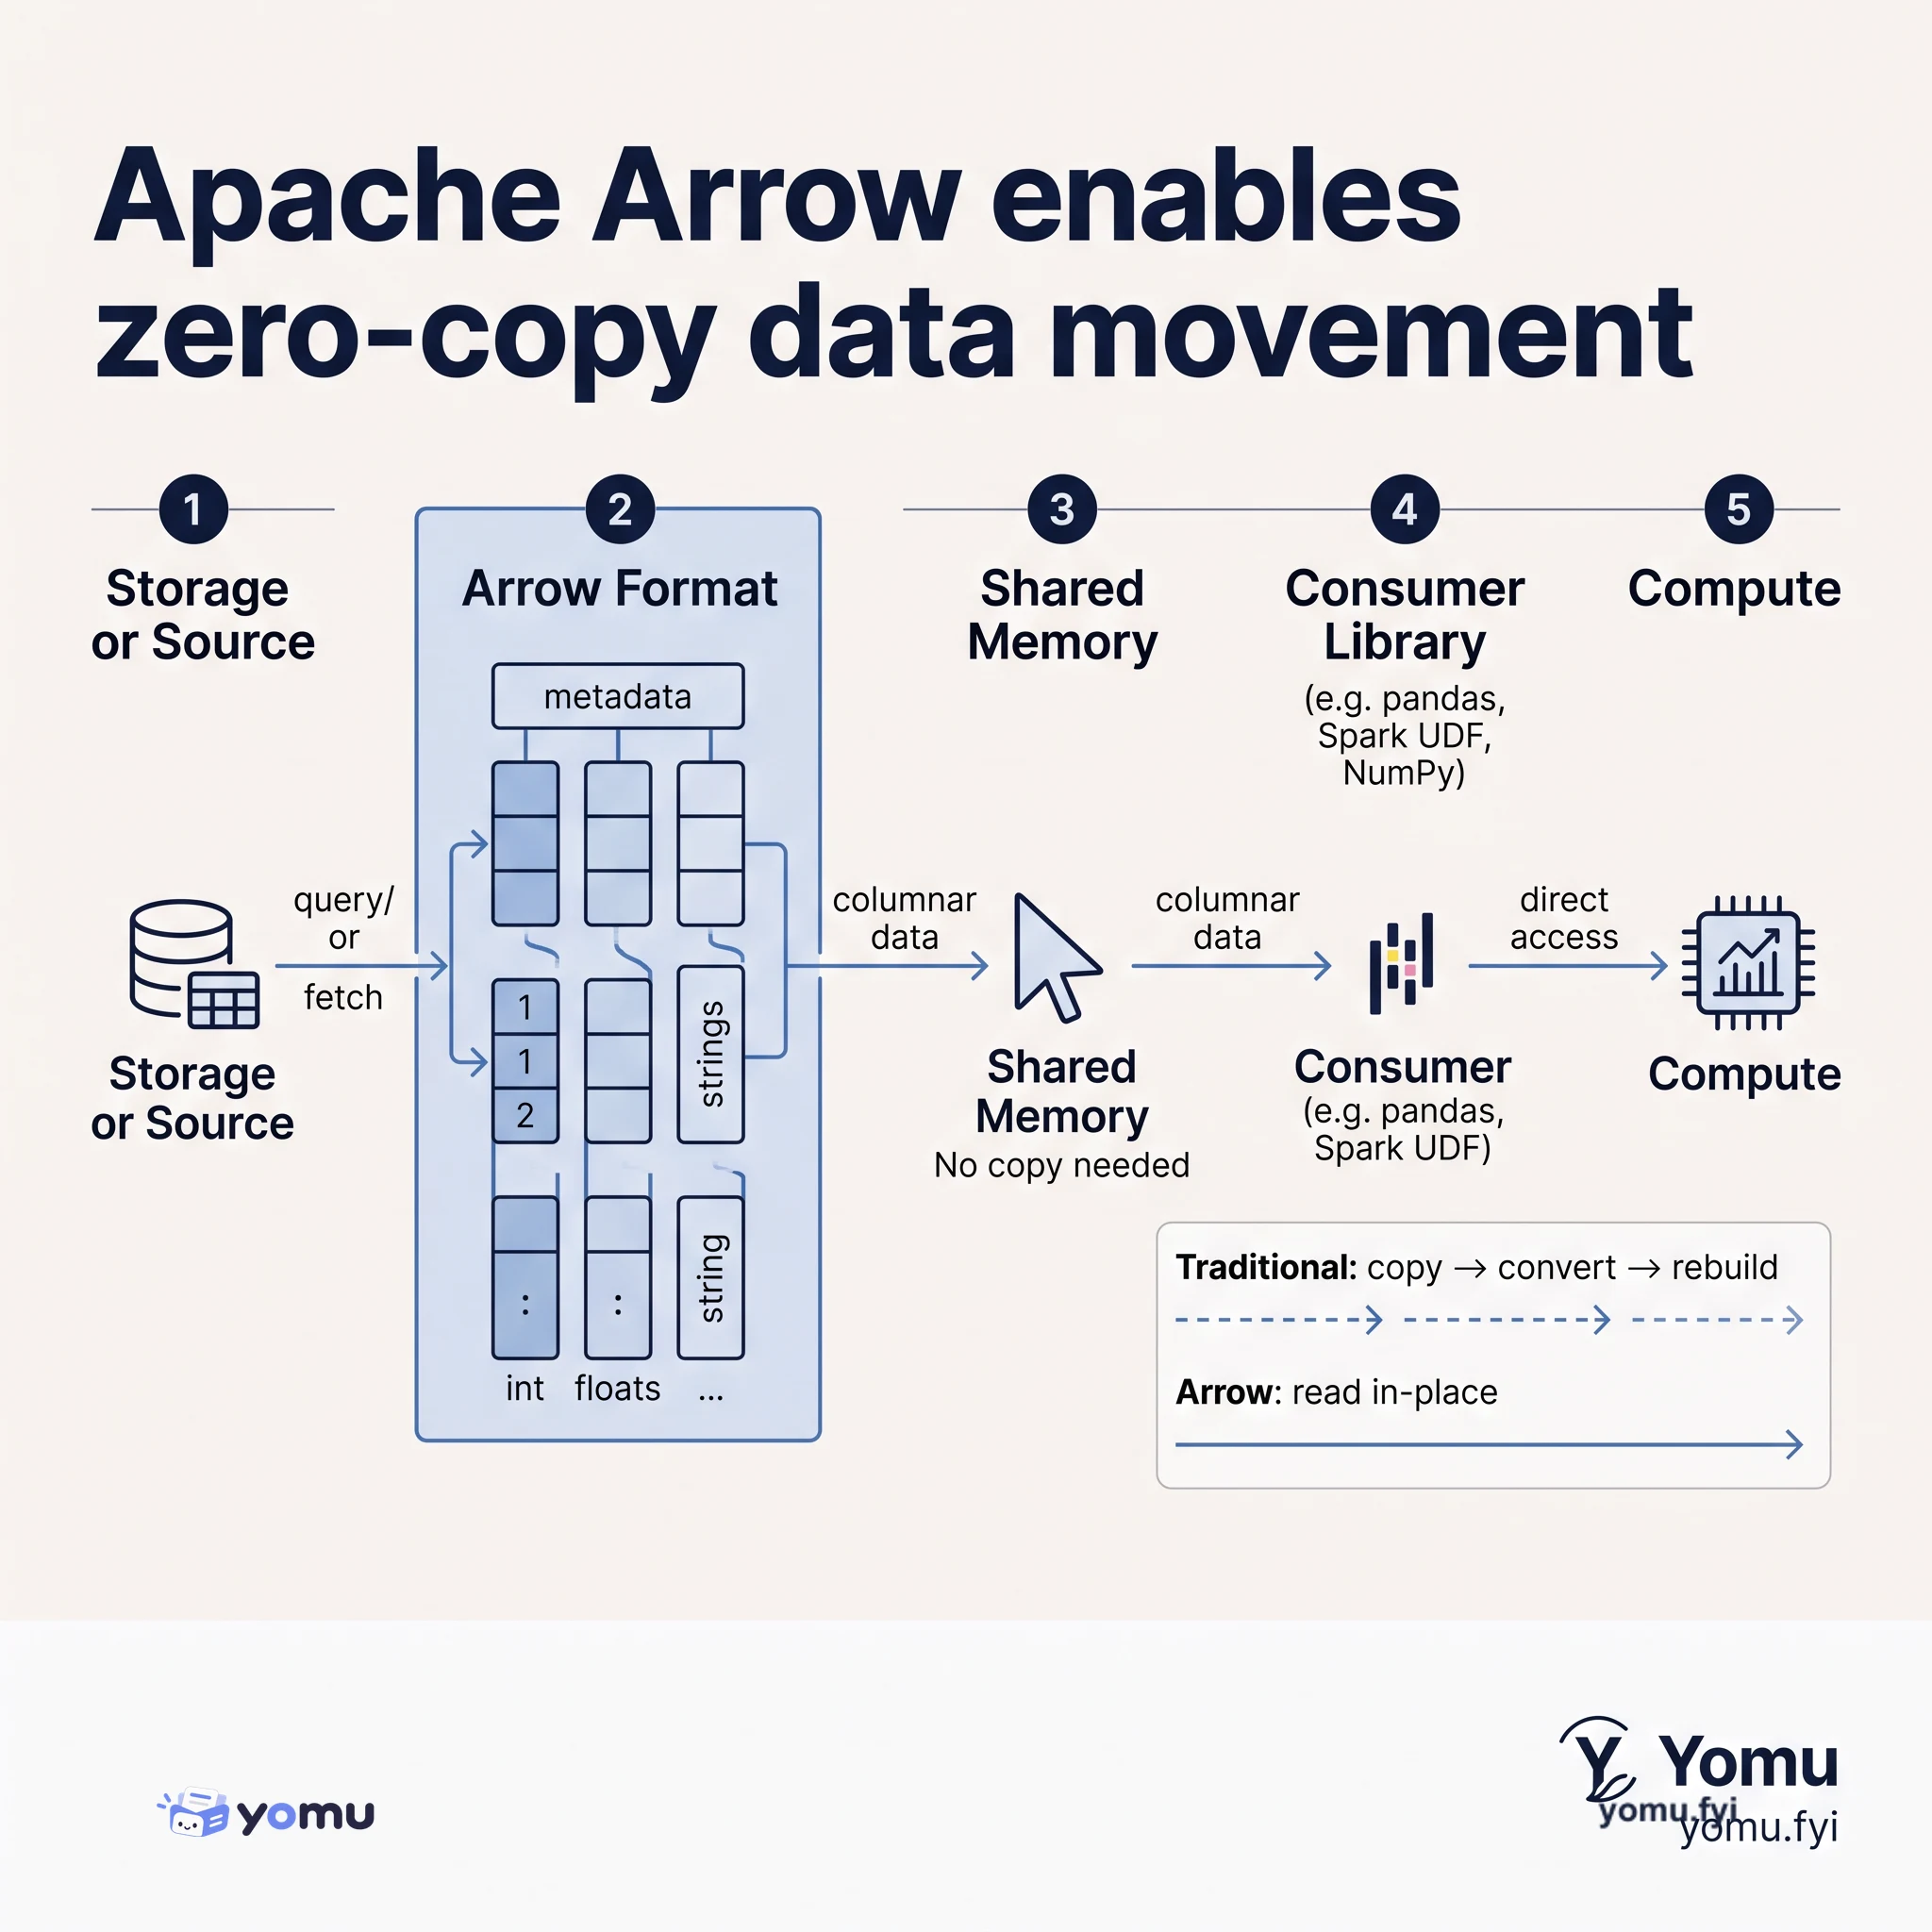
Apache Arrow is a columnar in-memory format that lets databases, analytics engines, and Python libraries share data without serialization overhead or format conversion, cutting memory peaks and speeding up common workflows.
The Good Stuff
Paid picks we use ourselves. Links carry a referral code — a subscription through one earns us a commission at no extra cost to you.
Newest first
Data warehouse modernization addresses legacy systems that cannot scale efficiently with growing data volumes, real-time analytics, machine learning, and self-service access. The proposed roadmap spans two to four years for large estates, moving from assessment and architecture design through high-impact workload migration, governance embedding, and optimization rather than relying on a risky big-bang cutover. Its target architecture favors a lakehouse or enhanced cloud data warehouse, with open formats such as Apache Iceberg or Delta Lake, separate compute and storage, and Bronze, Silver, and Gold layers supporting incremental ELT and lineage. The source says modernization can reduce infrastructure maintenance costs by 30–50%, compress query latency from hours to seconds, and halve redundant ETL pipelines, while also improving governance for sensitive data and enabling BI, machine learning, and generative AI workloads on a shared foundation.
Customer segmentation divides an existing customer base into smaller groups based on shared demographic, geographic, psychographic, behavioral, firmographic or value-based characteristics. Unlike market segmentation, it uses first-party data about existing customers, and a customer can belong to multiple segments at once. The guide distinguishes rule-based, survey-based, RFM, k-means, decision-tree and AI/ML-driven methods, with choices depending on data maturity and business goals. Effective implementation defines an objective, audits and unifies sources, resolves duplicate identities, selects a method, validates segments and measures outcomes. It also describes Databricks' CustomerLake capabilities, including governed Customer 360, agentic identity resolution, natural-language segmentation through Genie and bidirectional activation connectors; stated benefits include improved retention, conversion, customer lifetime value and marketing efficiency.
Rivian is building electric vehicles and services that require fast, trusted decisions across manufacturing, supply chain, finance, service and operational planning, while business users need reliable metrics and insights. Using Databricks AI/BI, Genie, Unity Catalog metric views, Databricks Apps and AI-assisted engineering, the company is consolidating dashboards, semantic definitions, permissions, sensitive data and AI-powered workflows on one governed foundation. Rivian migrated a massive multi-domain dashboard base in less than six months, is standardizing more than 50 metrics, and worked with Databricks as a design partner on roughly 58 product features. The resulting self-service analytics and operational applications cut supply-chain monitoring time by 60 to 70%, reduce inventory investigations from over 30 minutes to under two, predict stock-out risk more than four days ahead, and reduce some ingestion setup time by more than 60%, supporting AI-powered decisions without competing versions of the truth.
An enterprise data strategy connects organizational data assets to measurable business outcomes, while fragmented architectures can leave data investments uncoordinated and limit real-time analysis and action. The roadmap starts with purpose, scope, executive sponsorship, measurable objectives, KPI mapping, and use-case prioritization based on business impact, feasibility, time to value, and organizational readiness. It then organizes governance, lifecycle management, data quality, target-state architecture, integration, analytics, team structure, compliance, and measurement as interdependent capabilities, emphasizing owners, stewards, decision rights, executable quality rules, and automated cleansing. Implementation proceeds through a time-boxed cross-functional pilot, documented learnings, and incremental scaling, with steering-committee oversight and governance that evolves through feedback. The text gives indicative timelines of 60 to 90 days for a focused pilot, 12 to 18 months for a foundational platform across multiple business units, and multiple years for a mature data-driven culture.
Databricks Genie is presented as a cross-industry technology layer for enterprise challenges including financial planning, legal compliance, and IT operations. As a “Research Agent,” it can generate multi-step research plans to explain business anomalies and support answers with verifiable proof from the lakehouse. The post showcases partner solutions across technology, sales, marketing, HR, finance and procurement, supply chain, customer service, and IT operations, with examples spanning governed analytics, multi-agent orchestration, data observability, causal analysis, and incident management. These implementations aim to replace fragmented or static workflows with real-time, contextualized intelligence and production-grade agentic workflows, supporting anomaly investigation, root-cause analysis, ticket classification, and conversational troubleshooting. The stated goal is faster, more confident decision making across departments through governed self-service access to insights.
Agentic BI uses autonomous AI agents to automate work between raw business data and actionable insight, including data preparation, query execution, chart and narrative generation, and report distribution. Traditional BI depends on analysts to gather data, write queries, maintain dashboards, and assemble reports, while agentic systems let business users ask natural-language questions and receive governed answers. The guide identifies a governed semantic layer as foundational, because shared metric definitions and deterministic execution help keep outputs consistent, auditable, and trustworthy, with human approval checkpoints for higher-risk handoffs. It recommends inventorying data structure, schema drift risk, and integration costs, then piloting a narrowly defined workflow and measuring time to insight, analyst hours reclaimed, satisfaction, and accuracy before expansion.
Data analytics and data science are compared as data-focused career paths, with analytics interpreting existing, usually structured data for trends and business decisions, while science builds models and automated systems to predict future outcomes. The guide contrasts typical questions, outputs, tools, education paths, and roles: analysts use SQL, Excel, Tableau, or Power BI for dashboards and reports, whereas data scientists use Python, R, Apache Spark, and MLflow for predictive models and algorithms. It describes analytics types from descriptive through prescriptive, and a data science workflow spanning collection, feature engineering, training, validation, and deployment, including unstructured data such as text, images, and sensor streams. It also explains collaboration, including analysts defining problems and baselines before scientists build models, and offers portfolio suggestions and questions for choosing a path.
Pharmaceutical launch analytics depends on compressing the time between data signals and commercial decisions, because early choices shape a trajectory measured over 12-to-36 months. The source frames the first 90 days as three phases: weeks 1–4 validate feeds, set NBRx and patient-start benchmarks, and identify coverage gaps; weeks 5–8 support tactical adjustments through AI-generated narratives, adoption cohorts, and access-barrier escalation; weeks 9–12 recalibrate against benchmarks, shift promotional spend, and record decisions. Databricks Genie lets commercial leaders question unified Rx, specialty-pharmacy, payer-coverage, field-activity, and patient-services data in natural language at prescriber, territory, and regional granularity, with governance and benchmark context. The stated operating benefit is a decision cycle under seven days, enabling teams to detect suppression early, reallocate resources, and respond to access barriers while the launch remains correctable.
Energy companies have built sophisticated infrastructure for Scope 1, 2, and 3 emissions reporting across complex asset portfolios, but that infrastructure is often oriented toward historical disclosure rather than forward-looking action. Sustainability leaders still need timely answers about which assets warrant intervention, what operational choices drive carbon intensity, and whether current performance is tracking toward commitments. Databricks Genie addresses this gap by letting users query emissions, operational, and financial data in natural language, linking results to dispatch decisions, fuel purchases, and asset utilization. It supports multi-scope analysis, traceability to source data, and scenario questions such as retiring an asset or increasing renewable PPA volume. The stated outcome is a shift from compliance reporting toward data-driven decarbonization decisions, with Genie available today for energy-sector use.
Media companies may have launched streaming services, digital editions, and mobile apps, yet still face a digital product intelligence gap: product teams must answer behavioral data questions quickly enough to personalize experiences and improve engagement. Databricks Genie gives nontechnical product leaders a conversational interface that translates natural-language questions into SQL queries, visualizations, and actionable insights over governed enterprise data, without requiring code or analyst handoffs. The agent queries governed Delta Lake tables fed by streaming clickstreams, views, and session signals, combining event-level behavior, A/B tests, audience segments, and cross-platform data in conversational answers. The source says internal benchmark accuracy improved from 32% to over 90% through multi-LLM orchestration, specialized knowledge search, and parallel reasoning, and presents Genie as reliable enough for production personalization decisions.
Supply chain leaders often have extensive operational data yet still respond reactively because predictive signals such as supplier lead-time trends, inventory velocity, weather, and commodity prices remain siloed and difficult to synthesize. Databricks Genie is presented as a plain-language intelligence layer that lets leaders interrogate operational and external data in the flow of work rather than relying on analyst-led BI sessions. Users can ask questions combining supplier tiers, lead-time changes, inventory coverage, contract terms, and production schedules, then follow with what-if queries about financial exposure if conditions worsen. The post says Genie returns answers in seconds, supports near-real-time monitoring and proactive alerting, and enables shared, governed answers for procurement, operations, and finance, shifting decisions from reactive reporting toward earlier evidence-based action.
Value-based care changes healthcare finance by tying payment to outcomes, cost efficiency, and equity rather than service volume, while shifting greater financial risk to providers under ACO, bundled, and capitated contracts. A CFO must therefore track attributed populations, PMPM cost trends, utilization, clinical outliers, quality thresholds, and contract performance against benchmarks. Databricks Genie is presented as a conversational interface over integrated attribution, claims, clinical, and benchmark data, allowing questions such as PMPM divergence among high utilizers and DRG drivers to be answered in real time. The source also identifies incorrect attribution and risk-adjustment coding errors as major threats, and describes predictive risk stratification and quality-gap forecasting as ways AI can support earlier intervention.
Manufacturing quality teams often receive defect-rate reports after the conditions behind them have changed, because inspection, supplier, and environmental data are disconnected. Predictive quality combines production, inspection, and supplier data with machine learning to forecast defects before final inspection, shifting quality management from reactive documentation to proactive intervention. Databricks Genie is presented as a natural-language interface for querying those sources together, including questions about first-pass yield, supplier lots, root-cause contributors, and process conditions; its answers include citations and can surface unusual patterns. The described capabilities include contextual understanding of terms such as NCR, CAPA, and CPK threshold, multi-source reasoning, and traceable outputs tied to records. The intended outcome is faster analysis and earlier action to reduce scrap before its cost is incurred.
Energy trading markets settle every 15 minutes, while many analytics environments still rely on nightly batch pipelines, creating latency between changing conditions and trading decisions. The post presents Databricks Genie as a conversational interface that lets traders and portfolio managers query actual market data, weather integrations, historical position data, and current books. Its example combines a node’s 90-day natural-gas basis distribution with a Northeast temperature anomaly, while the described system can query real-time and historical data together. Genie also includes settlements, curtailments, and ancillary-service data, with governed access so users see only authorized information. The conclusion is that faster data access can remove information latency and compound margin without replacing trading expertise; the source states that Genie is available today.
The post argues that media companies face a stronger need to turn first-party audience data into an advertising sales advantage as third-party cookies decline and buyer attribution expectations rise. Advertisers are buying audiences rather than inventory, so sales teams need granular audience insights, validated campaign performance, clear attribution, and revenue context to compete in RFPs. Databricks Genie is presented as a natural-language interface to governed first-party data, allowing leaders to query defined audience segments such as users who completed at least 75% of automotive content in 90 days, segmented by income quartile and household ownership. The same analytical environment connects demographic composition, content and behavioral signals, post-campaign measurement, attribution, and revenue pacing against budget and prior year.
Operating room utilization measures in-room surgical minutes against allocated block-time minutes, yet most US health systems reportedly run at 65–75% versus an 80% industry target. Daily performance reports arrive the next morning, after schedules are set and opportunities to release unused blocks, redeploy staff, or backfill add-on cases may have passed. The post presents Databricks Genie as a natural-language interface for querying scheduling, utilization, and outcomes data without a data analyst request. Its proposed analytical environment combines scheduling data, actual case logs, block-release records, contribution margin, and staffing costs, with breakdowns by surgeon, service line, facility, and day of week. Genie surfaces specific intervention targets, although the post says it provides data access rather than automating OR management.
Growth analytics is presented as the next stage after growth hacking, arguing that competitive acquisition now depends on precise unit economics, cohort quality, and rapid conversion optimization rather than isolated tactics. It distinguishes product analytics, which explains feature use and user flows, from growth analytics, which connects acquisition sources and costs with activation, revenue, retention, and cohort behavior. The stated bottleneck is fragmented tooling: answering questions such as 90-day LTV by channel correlated with seven-day activation can require manually joining multiple systems and delay weekly budget decisions. Databricks Genie is described as a governed natural-language interface over unified acquisition, behavioral, and billing data, supporting attribution-to-LTV analysis, payback modeling, and paid-versus-organic comparisons. The text reports a 50% relative acquisition-rate lift, from 8% to 12%, for customers using Genie, and shorter onboarding insight cycles from months to weeks.
BKK, Budapest’s unified transport authority, manages public transit, shared mobility, infrastructure, and traffic systems for a city of 1.7 million people. Its legacy on-premises warehouse and fragmented Excel- and PowerBI-based reporting struggled with growing, varied data, limiting efficient access and analysis. BKK phased a migration to Azure Databricks, starting with mobility datasets and carefully modeling and validating data from vehicle GPS, passenger sensors, boarding schedules, and other systems. The Databricks Lakehouse lets analysts process large geospatial datasets in shared SQL, Python, or R notebooks, supporting minute-level shared-mobility tracking, route-performance analysis, airport-bus forecasting, and dynamic scheduling. These capabilities provide faster insights and more responsive decisions, while governed access and cost visibility support broader collaboration and BKK’s vision for a digital twin of Budapest’s mobility system.
Data warehouse tools are presented as a strategic choice for analytics and ML teams facing fragmented estates of warehouses, lakes, and standalone ML systems. The guide proposes evaluating platforms across query performance, scalability, data integration, BI connectivity, total cost of ownership, and governance and security, with attention to MPP, columnar storage, and decoupled compute and storage. It contrasts traditional warehouses, data lakes, and lakehouses: warehouses favor structured SQL analytics, lakes offer native-format flexibility but weaker quality and performance guarantees, and lakehouses combine these capabilities using open formats such as Delta Lake and Apache Iceberg. The stated conclusion is that a lakehouse can provide a single governed foundation for SQL, BI, streaming, ML, and AI workloads, while teams should select tools according to workload, scale, budget, and future AI needs.
Product organizations can ship features in days while taking weeks to understand their behavioral impact, because fragmented analytics stacks depend on analysts, BI expertise, or SQL skills. The post argues that this architectural bottleneck slows the insight-to-ship cycle, causing roadmap decisions to rely on instinct, anecdotes, and lagging indicators. It presents Databricks AI/BI Genie as a conversational interface to event-level behavioral data, with experiment integration, cohort analysis, and product-specific growth-metric definitions. According to the post, product leaders can ask questions in plain language without filing analyst requests, while governed data access supports faster follow-up and feature-impact decisions. It reports that Genie users across 3,300+ Databricks customers cited a 49% productivity gain, 41% faster speed to market, and 5x faster ad-hoc analysis, though these are reported customer results.
The best engineering reads, once a week.