Analytics Is a Signal-Selection Problem
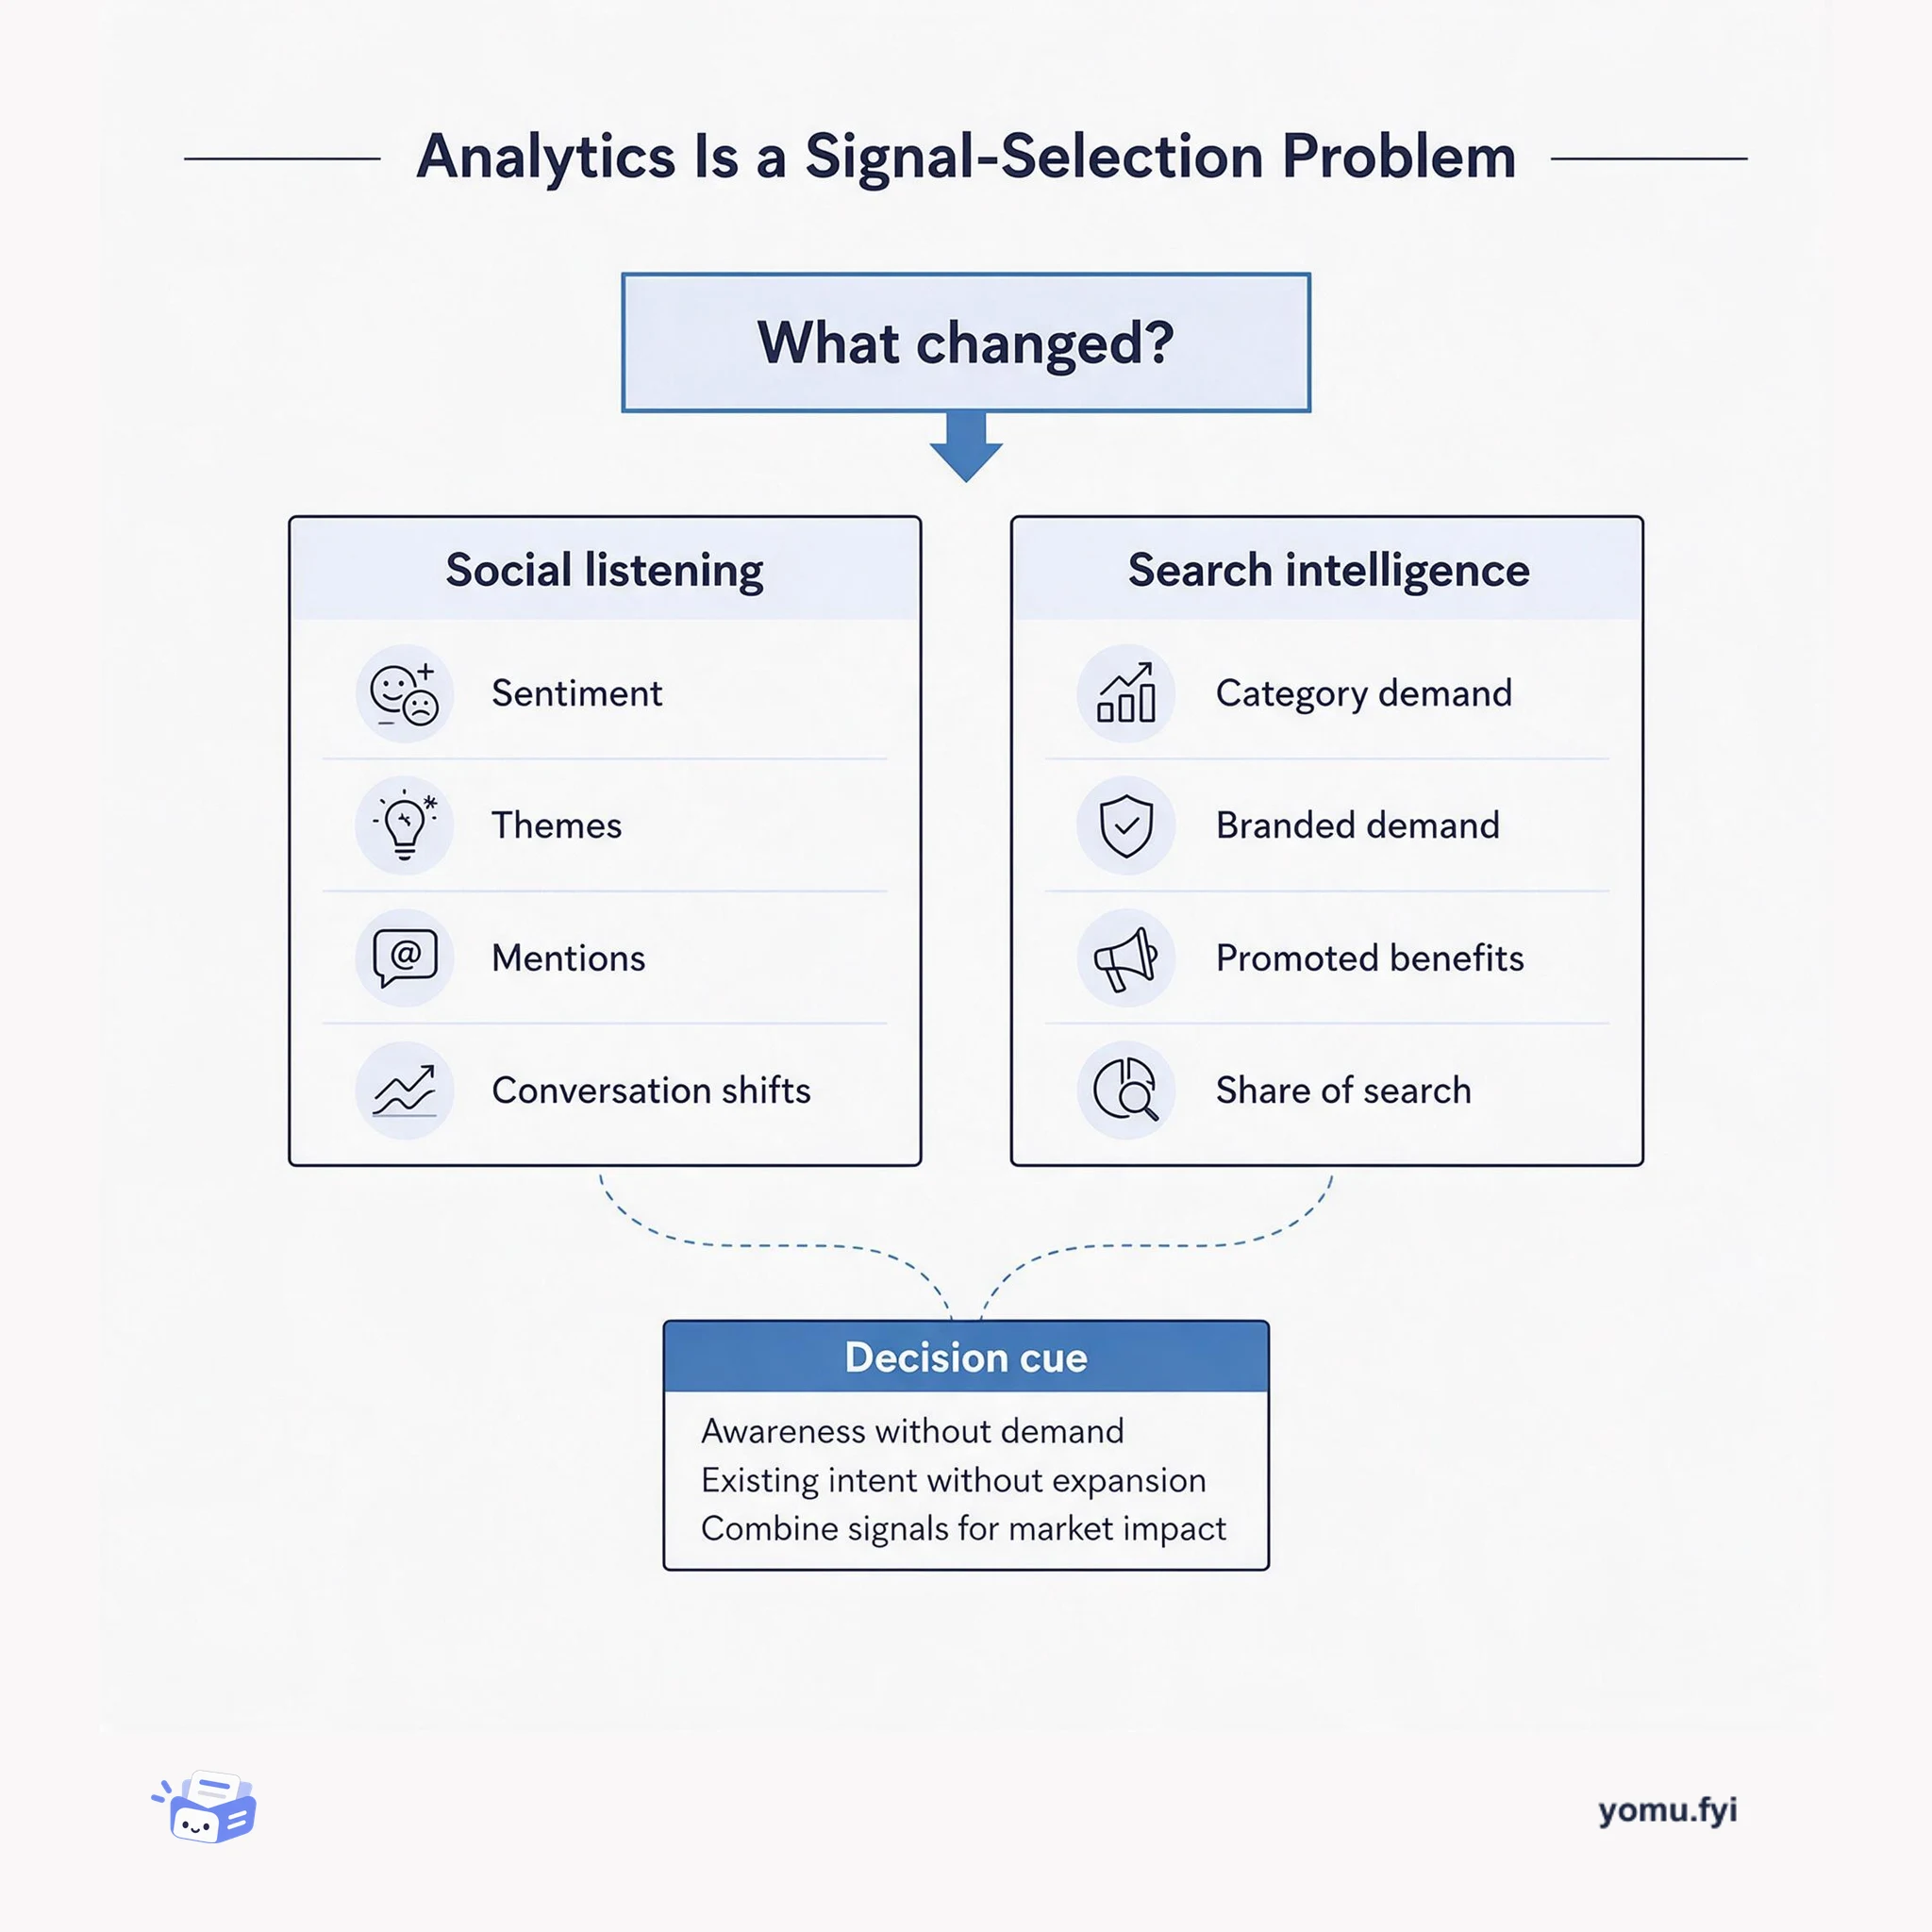
Compare social listening with search intelligence to see which signals answer questions about perception, demand, and campaign impact—and when combining them is more useful.
Loading…
Topic
66 posts about Data Analytics. Every summary links to the original.
See the idea
Compare social listening with search intelligence to see which signals answer questions about perception, demand, and campaign impact—and when combining them is more useful.
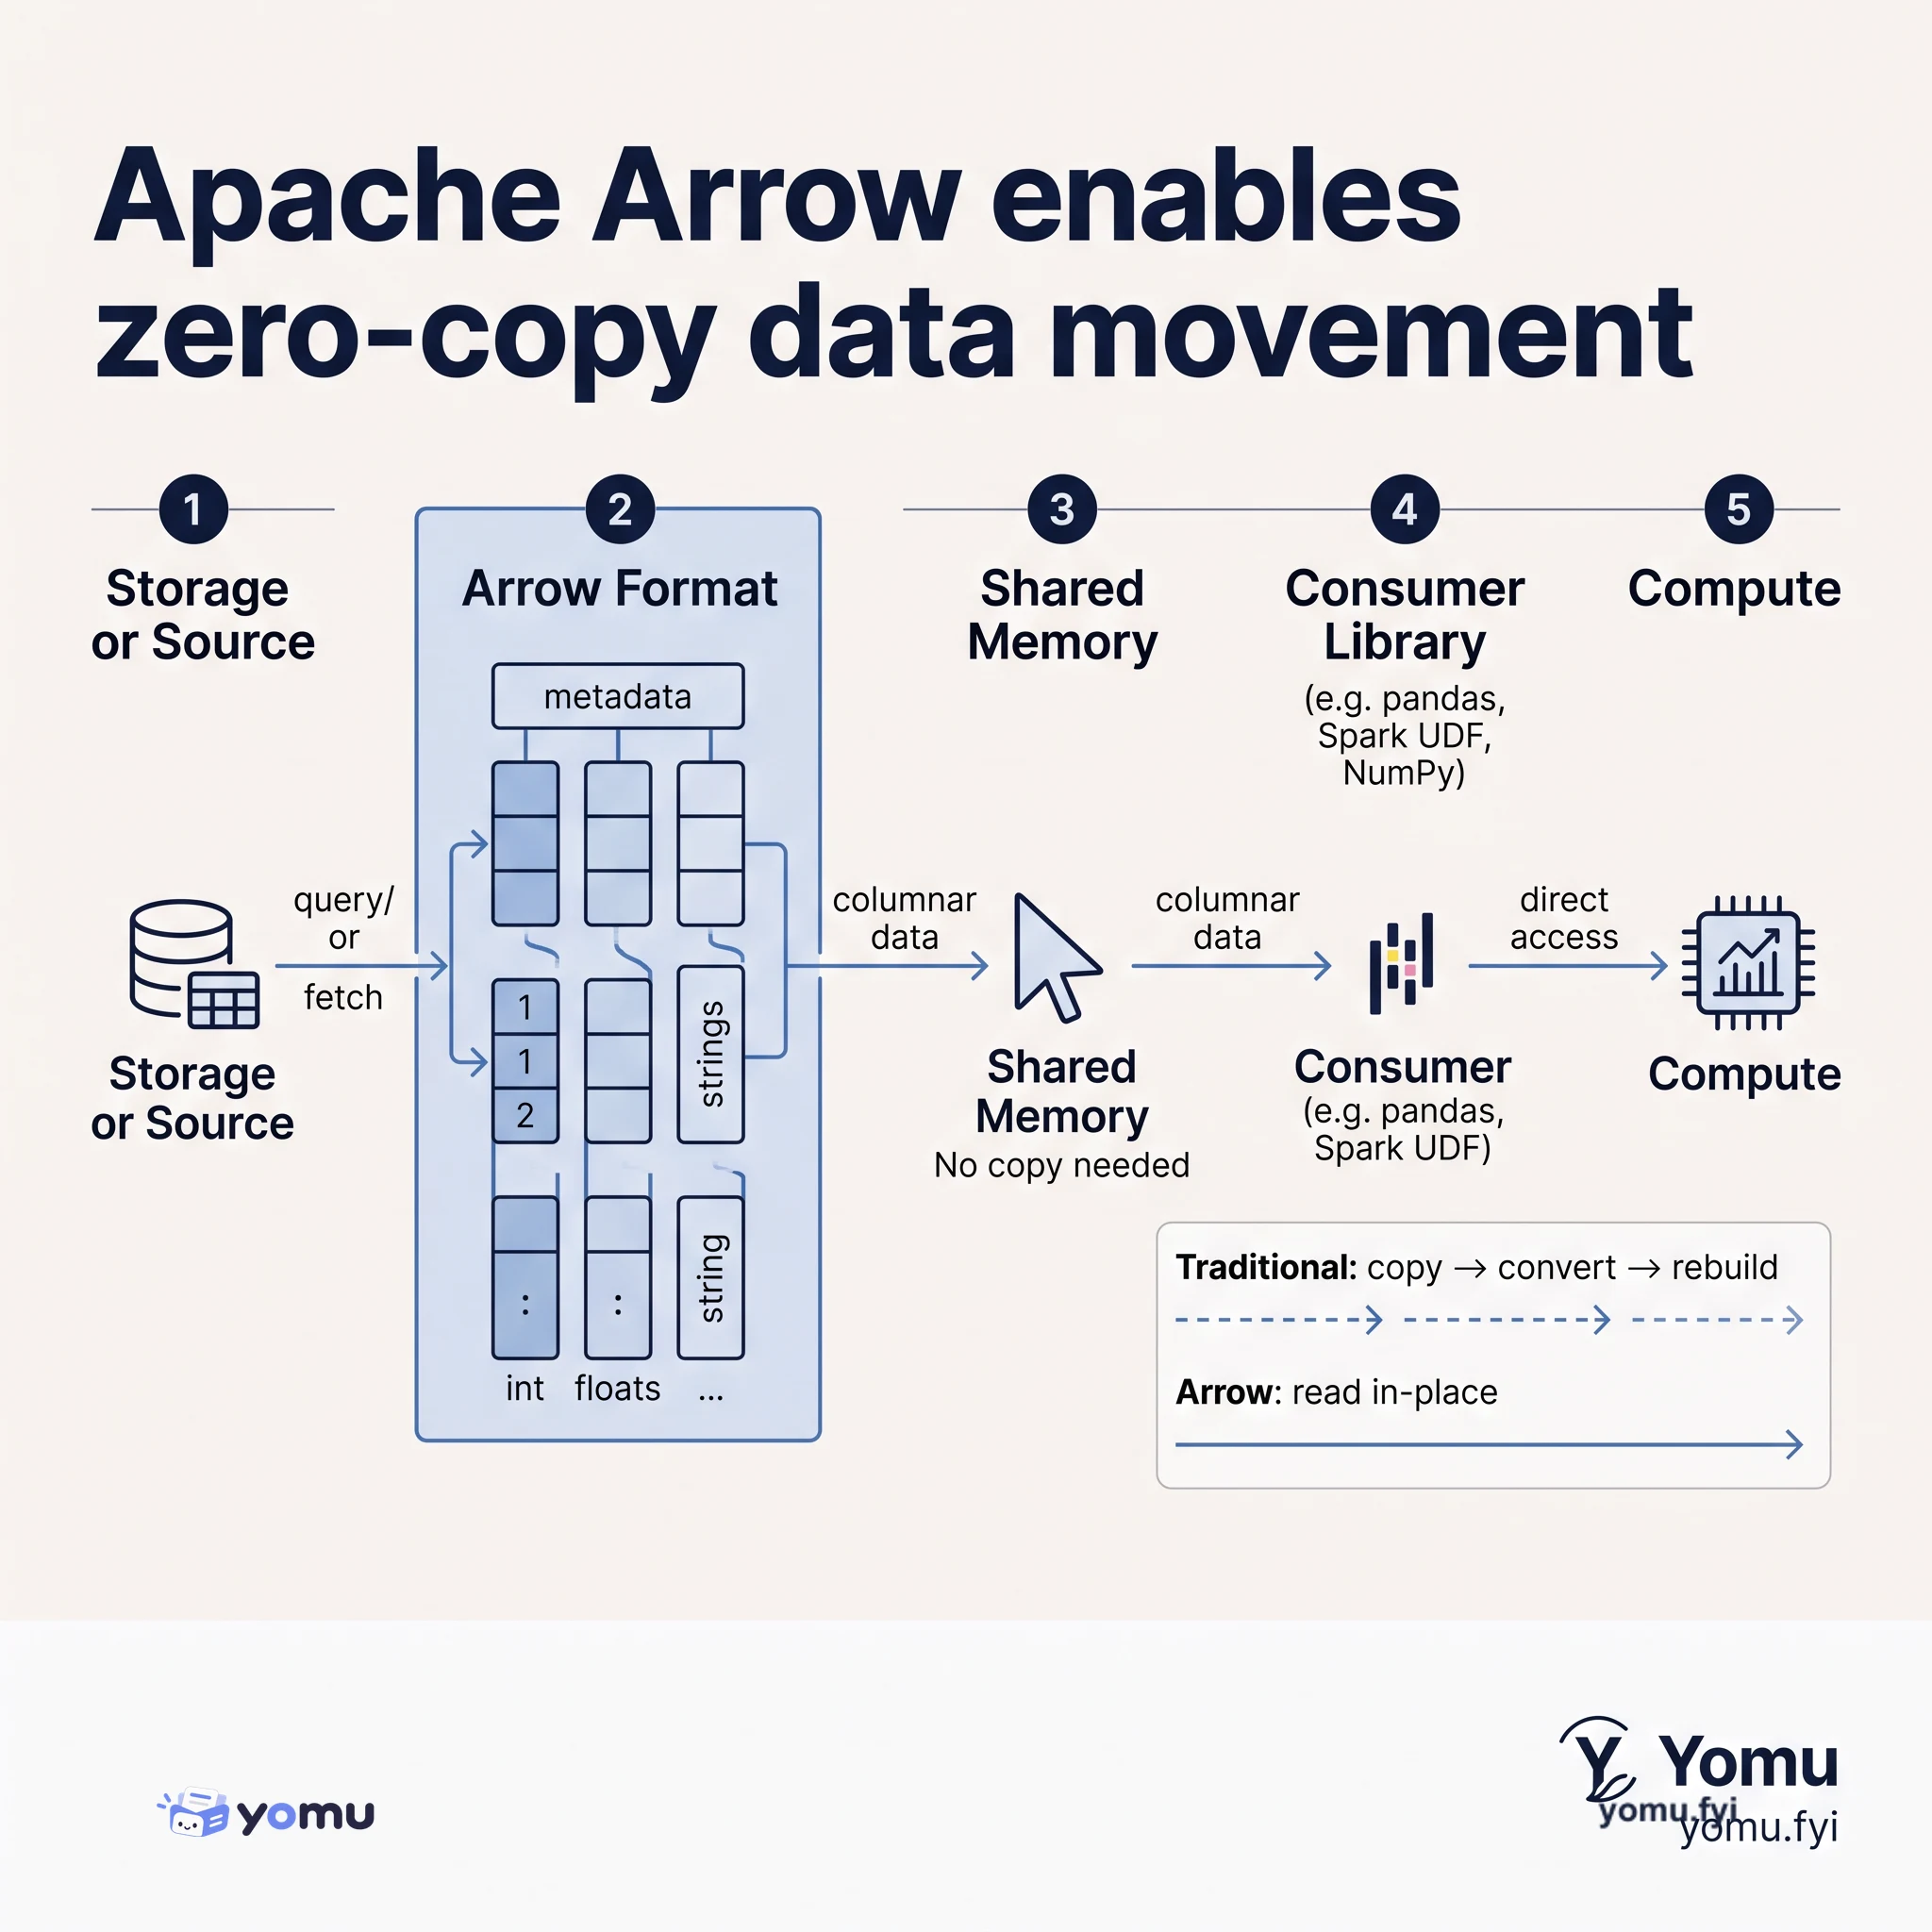
Apache Arrow is a columnar in-memory format that lets databases, analytics engines, and Python libraries share data without serialization overhead or format conversion, cutting memory peaks and speeding up common workflows.
The Good Stuff
Paid picks we use ourselves. Links carry a referral code — a subscription through one earns us a commission at no extra cost to you.
Newest first
Manufacturing OEE dashboards can look healthy while omitting recurring downtime that supervisors recognize, because relevant facts are split across SCADA, MES logs, maintenance tickets, and shift reports. OEE combines Availability, Performance, and Quality, but extracting those inputs often requires SQL or an analyst, delaying root-cause analysis after throughput drops. Databricks Genie is presented as a conversational AI layer over a unified data platform that leaves MES and SCADA in place while allowing business leaders to ask plain-language questions such as OEE by line against maintenance windows. Its semantic-layer awareness maps terms to actual fields, while governed access and logged, source-cited answers support different visibility levels and traceability. The proposed shift is from static reporting to faster operational questioning about production status, forecast risk, line performance, and quality signals.
Readmission risk models can identify patients likely to return within 30 days, but prediction alone does not ensure timely intervention. In large health systems, risk information may remain in population-health dashboards or EHR flags without reaching the care coordinator with enough context to create an effective post-discharge plan. The post presents Databricks Genie as a natural-language interface for governed clinical and outcomes data, allowing leaders to query readmission rates and compare periods while combining EHR, operational, financial, risk-score, intervention, and outcome information. Genie operates within Unity Catalog governance, with access controls, audit logging, and de-identification policies, and is described as supporting EHR integration and clinical taxonomy awareness; the intended result is to shorten the path from prediction to action.
Clinical trial operations can lose weeks because site-level performance data is reviewed with a 2–4 week lag: enrollment velocity is monthly, while protocol deviation rates are assessed quarterly. The post presents Databricks Genie as a natural-language interface to unified trial data, allowing clinical operations leaders to query enrollment, screen-failure, protocol-deviation, query-response, and data-entry metrics across sites. Its stated capabilities include automatic site comparison, integration across CTMS, EDC, safety databases, and site-performance data, plus protocol-aware reasoning and traceability to source records for GCP documentation. The example query identifies Phase II oncology sites with screen-failure rates above 40% over 60 days and compares enrollment pace with activation targets, positioning earlier detection as a way to reduce timeline impact and speed treatment access.
Retail out-of-stock rates in grocery and general merchandise typically run between 7% and 10%, leaving roughly one in ten sought-after items unavailable at a given moment. The revenue impact is real, but repeated shelf gaps can cause customers to build shopping habits elsewhere. Modern retail replenishment requires real-time synthesis of POS velocity by store and SKU, distribution-center inventory, on-order quantities and delivery windows, supplier fill-rate histories, promotional calendars, and other demand signals. Databricks Genie is presented as a conversational interface to the full inventory and demand environment, allowing leaders to ask which high-velocity SKUs are projected to stock out within 72 hours and receive current on-order positions in seconds rather than hours. Its stated differentiators include store-SKU granularity, shared promotional, event, and weather data, supplier performance context, and cross-distribution-center rebalancing; the post says Genie is available today.
Content investment decisions in entertainment commit substantial funds despite limited information, because leaders often combine executive instinct, competitive benchmarks, and historical performance data. Although companies hold viewing and subscriber signals such as episode completion, skip patterns, genre performance by demographic, acquisition, and retention, those insights are frequently buried in dashboards and spreadsheets. The post presents Databricks Genie as a natural-language interface that lets content leaders query governed performance data directly, including comparisons linking content types with 90-day retention, subscriber demographics, lifetime value, acquisition source, and historical greenlights. It argues that current, conversational access can complement creative judgment by reducing dependence on delayed analyst recommendations, while external market data can add competitive context.
Business intelligence (BI) reporting turns data from operational systems and analytical repositories into structured reports, dashboards, and visualizations for organizational decision-making. The guide explains managed and ad hoc reporting, then traces a typical workflow through data sources, ETL, deduplication, normalization, validation, data modeling, visualization, and automated distribution. It compares established platforms such as Microsoft Power BI, Tableau, SAP BusinessObjects, Qlik, and Looker with newer AI-native tools, while noting evaluation criteria including connectivity, scale, governance, usability, and cost. It also addresses dashboard overload, stale semantic models, and specialist bottlenecks, and cites reports of 10x faster query creation from AI-assisted natural-language querying alongside recommendations to start with one decision, one primary source, and three to five KPIs.
Media companies are expected to tailor content and messaging across channels, with personalization programs typically targeting lower churn, deeper sessions, and higher subscription revenue. The proposed foundation starts with an audit of CRM, email, warehouse, and customer data platform sources, followed by required-field definitions, ownership mapping, consent tagging, and ingestion-quality checks. Teams then map segment behaviors and conversion or retention paths, including negative signals, before selecting a CDP with real-time ingestion, identity resolution, unified profiles, segmentation, activation, and governance. Identity rules should connect anonymous and authenticated activity across web, mobile, and connected TV, while event-level streaming delivers messages through email, push, in-app, and advertising channels with minimal latency. The roadmap recommends an MVP comprising unified ingestion, a homepage recommendation surface, and triggered re-engagement email, with performance, churn, revenue lift, and model drift monitored through iteration.
Databricks introduces Agent mode in Genie spaces, an agentic process that plans, explores, and reasons over data to answer business questions. For each question, Genie can confirm an issue, test potential contributors through multiple queries, reflect on results, and decide what to investigate next, using Unity Catalog metadata and author-defined semantics from the Genie space. It produces a findings report with quantified results, identified contributors, visualizations, and references to the underlying SQL, and may include actionable recommendations. The agent scales its reasoning to task complexity, using validation for straightforward questions and more planning for multi-step investigations; in AI/BI Dashboards, Genie uses Agent mode by default. Workspace admins enable the feature in Workspace Previews, after which users turn on the Agent toggle in Genie spaces; API support and unstructured document analysis are planned additions.
Operational analytics uses real-time or near-real-time data to monitor day-to-day operations and support immediate decisions, unlike traditional analytics, which generally relies on batch data to explain past performance. Its workflow collects logs, events, clickstreams, telemetry, transactions, and other signals; streams them into a unified platform for cleaning, transformation, and enrichment; analyzes incoming data with rules, models, or anomaly detection; and sends results to dashboards, alerts, or operational applications. This can help teams detect issues earlier, reduce mean time to detect (MTTD) and mean time to respond (MTTR), improve forecasting, coordinate across departments, and act on inventory, customer, or system changes. The approach also requires integrating heterogeneous systems, maintaining data quality and schemas, embedding insights into existing workflows, and building reliable low-latency pipelines, with tools such as Lakeflow, Databricks SQL, and AI and machine learning capabilities presented as examples.
Brandwatch Consumer Research examined finance-related online conversations and found that negativity is increasing, with negative mentions up 21% between March 1, 2025, and March 1, 2026. The analysis identifies three major sources of frustration: free trials that convert into subscriptions through unclear pricing or cancellation practices, brands removing or replacing previously free benefits, and buy-now-pay-later (BNPL) services associated with overspending, debt, and financial stress. Mentions of free trials rose 45%, denied-refund mentions in those discussions rose 107%, benefit downgrades or removals rose 19%, and BNPL’s negative sentiment increased almost 600%. Drawing on 609 million conversations from social media, forums, review sites, and blogs over 12 months, the report recommends consent, advance notice, customer education, and financial-literacy support.
Social media analytics involves gathering, analyzing, and interpreting social media data to understand audience behavior, evaluate channels and campaigns, and guide future plans. The guide covers the workflow from collection through interpretation and strategic adjustment, including engagement, reach, sentiment, audience, competitor, and conversion metrics. It recommends tools such as Brandwatch, Google Analytics, Sprout Social, Hootsuite Analytics, and Meta Business Suite, while noting that tool choice depends on needs and budget; integrations can centralize multiple platforms. The guidance emphasizes aligning metrics with business goals, automating collection, combining cross-platform data, benchmarking competitors, using historical trends, and turning findings into content and campaign changes. It also addresses attribution, platform changes, privacy, and emerging uses of AI, predictive, real-time, unified, video, and audio analytics.
Cursor is introducing enterprise features intended to make its coding agents more capable, transparent, and secure for organizations already using the product. Hooks expose the agent loop to custom scripts that can log actions and tool calls, enforce compliance or command allowlists, scrub sensitive material, connect external systems, and trigger automations; they can be distributed through MDM or Cursor’s cloud option. Team Rules provide shared context and can recommend or require standards such as API schemas, conventions, and workflows, while upgraded analytics report activity, adoption, AI lines of code, directory-group filters, and exportable data with updates every two minutes. The release also adds an Audit Log covering 19 event types and Sandbox Mode, which restricts network and file access by default, with administrators controlling availability and team-wide Git and network access.
Heroku applications can add the Moesif API Observability add-on to analyze API traffic and support monetization. The setup uses either the Heroku CLI or Dashboard: the CLI command is heroku addons:create moesif, while the UI path goes through Resources, Find more add-ons, and Metrics and Analytics. Provisioning creates a MOESIF_APPLICATION_ID config variable, and the application then requires the Moesif SDK initialized with that value. The guide also covers copying the variable into a local .env file with Heroku Local and excluding that file from Git through .gitignore. Once configured, API events should flow into Moesif for live logs, time-series metrics, funnels, retention, alerting, and billing features, while Heroku handles add-on billing and user management.
eBay Advertising has introduced a redesigned experience centered on a new dashboard, a unified portfolio, and tools intended to simplify campaign management, increase listing visibility, and support seller growth. The dashboard, available through a new Seller Hub Advertising tab, combines campaign reporting with personalized recommendations, daily optimization tips, suggested campaigns based on historical data and best practices, and trend-based campaigns built using ebay.ai. Sellers can choose among Promoted Listings, Promoted Stores, and Promoted Offsite, with Promoted Listings offering priority or general strategies that differ in placement access, controls, and charging models. The announcement reports average gains of 50% in items sold for priority campaigns, 30% more sales for general-strategy listings, and 25% more sales from external channels with Promoted Offsite, while positioning real-time data and actionable insights as tools for adjusting advertising decisions.
eBay’s Product Research, formerly called Terapeak, brings three years of sold-items data into its mobile app so sellers can research products and create listings from anywhere. The service reports actual sold prices, including accepted Best Offer prices, along with average and range, free-shipping share, average shipping cost, and the number of sellers who sold a product. Sellers can search, sort, filter, inspect a price-trend graph, and use “Sell one like this” to start a listing pre-populated from a sold listing. Product Research is available in the latest eBay app for iOS and Android, while desktop sellers can use it through Seller Hub; planned additions include sell-through rate, more trend graphs, and active-listing views.
Ramp’s growth team explains the principles and systems it used to scale customer acquisition since launching its first product in February 2020. By February 2021, annualized run-rate revenue reached $12 million, crossed $100 million a year later, and was far beyond that figure at the end of 2023. The approach combines first-principles thinking and prioritization with fast, data-driven MVP experiments, then productionizes ideas that show significant impact; it also relies on full-stack capabilities across business operations, engineering, and sales. An AI email overlay that classified and prioritized sales messages helped representatives handle more prospects and increase conversion rates. The team attributes tens to hundreds of millions of dollars in sales pipeline and real revenue to these practices, while noting that sustainable growth requires a solid product and real addressable market.
The analysis examines online conversation around the 2023 FIFA Women’s World Cup using English-language mentions from social media, blogs, forums, and news sources collected between 20 July and 20 August 2023. It reports over 2.2 million social-media mentions, with major peaks during the Round of 16, the semi-finals, and the final, which generated more than 150,000 mentions and ended with Spain winning the title. Among gender-categorized authors on X, 75% were male, while England was the most discussed country, followed by Australia, the United States, New Zealand, and Spain. Mary Earps’s penalty save produced an initial final-minute spike, and Spain’s coronation prompted a peak of 2,100 mentions at 10:03 PM AEST. The analysis concludes that mention volume, sentiment, emotion, and team comparisons can help brands identify which aspects of the sport generate the most interest and where to participate.
The post argues that Elixir developers already perform business intelligence when they use iex or a Rails console to query application data, calculate figures, and produce CSV rows for managers. It presents Livebook as a more capable alternative for young projects that need analysis without adopting a large, continuously running BI application such as Metabase. Because notebooks execute Elixir code and can communicate with running applications through BEAM/OTP clustering, they can reuse business logic, Ecto schemas, associations, and external integrations such as Stripe while avoiding direct database access. Livebook also supplies charts, graphs, tables, Markdown-based sharing, and reproducible reruns, with WireGuard enabling secure connections to apps on Fly.io. The resulting notebooks can answer onboarding, sales, and integration questions while preserving work that may later support an admin dashboard.
Exploratory data analysis (EDA) is presented as a practical way to describe a dataset, uncover patterns such as missing data, correlations, and outliers, and generate hypotheses that inform business questions and later data products. The guide recommends first clarifying the intended task with leadership and product, then checking dataset size, sample rows, and the unique row identifier; its synthetic merchant-behaviour example has 1,500 samples, 13 features, and one row per shop per day. It then advises examining missingness by feature, investigating why values are absent before deleting or imputing them, and classifying features as continuous, discrete, or categorical to guide analysis. Visualizing distributions and relationships helps reveal changes across samples and time, while box plots and percentile thresholds support systematic outlier review. The process is framed as a starting point whose findings can support regression, classification, or KPI-dashboard decisions.
Shipping data products under tight deadlines requires teams to stay focused while avoiding overengineering and building something users will not use. Shopify’s Data Science team recommends four practices: run a timeboxed design sprint with a small team and a designated Champion, prototype quickly—often with spreadsheets—and gather feedback throughout development. For first iterations, the post advises using simple approaches instead of machine learning when complexity would delay integration, polish, and user conversations; a sales forecasting prototype used linear regression with two input variables before a more complex model was built. User research should use specific questions and a diverse set of users, as feedback changed a confusing 0–100 scoring display to easier-to-interpret letter grades. Together, these practices provide a clearer path to launching useful products quickly.
The best engineering reads, once a week.