AI infrastructure costs are often billed to a platform team as one lump sum, leaving Finance without a departmental breakdown and teams without feedback on their usage. The post presents a working demo on Red Hat OpenShift AI that attributes requests and token consumption through department-specific MaaS API keys, shared model servers, Prometheus metrics, Perses dashboards, and MLflow traces. In its example, three departments generate 79,420 inference requests and consume 634 million tokens against a $14,200 quarterly bill, while Marketing’s 32% GPU utilization reveals roughly $34,000 in annual waste. The system combines aggregate usage filters with request-level details such as prompts, token counts, latency, and calculated cost, and the post argues that showback helps identify inefficient allocations and model mismatches rather than police teams.
Context
The subject is departmental AI cost attribution: turning shared-cluster inference activity into usage and dollar breakdowns that platform teams can present to Finance. The post frames showback as a way to identify idle capacity, inefficient model choices, and teams struggling with poor model fit.
Approach / What changed
The demo uses MaaS API keys and subscriptions to establish department identity and quotas, vLLM or llm-d to serve models, Prometheus and the cluster observability operator to collect token metrics, Perses to display subscription and model usage, and MLflow to trace individual inference requests. Per-model input and output token rates are then used to calculate costs.
Takeaways
1
Department-specific MaaS API keys provide the identity boundary needed to associate model requests and token consumption with teams.
2
Perses exposes aggregate usage by subscription or model, while MLflow traces provide request-level prompts, token counts, latency, and calculated cost.
3
Marketing’s 32% GPU utilization indicates that 68% of its allocated capacity was idle, corresponding to roughly $34,000 in annual waste at the stated node price.
FAQ
Does cost attribution require a separate billing tool or application-code changes?
No separate billing system is required to get started. If applications already call the MaaS Gateway with department-specific API keys, Prometheus, the built-in Perses dashboard, and MLflow can provide the usage and trace data without application-code changes.
How does showback help teams beyond assigning them a bill?
It can reveal inefficient allocations and model mismatches. In the example, HR’s repeated prompting indicated that its assigned model was a poor fit; access to higher-quality models reduced token consumption while improving the team’s experience.
What can the demo show, and how quickly can it run?
On OpenShift AI 3.4 or later, the demo can display per-department cost attribution through Perses and MLflow after configuring the environment and generating traffic. The post says the demo runs in about five minutes and includes prompt sets, a Kubernetes Job deployment, and a presenter walkthrough.
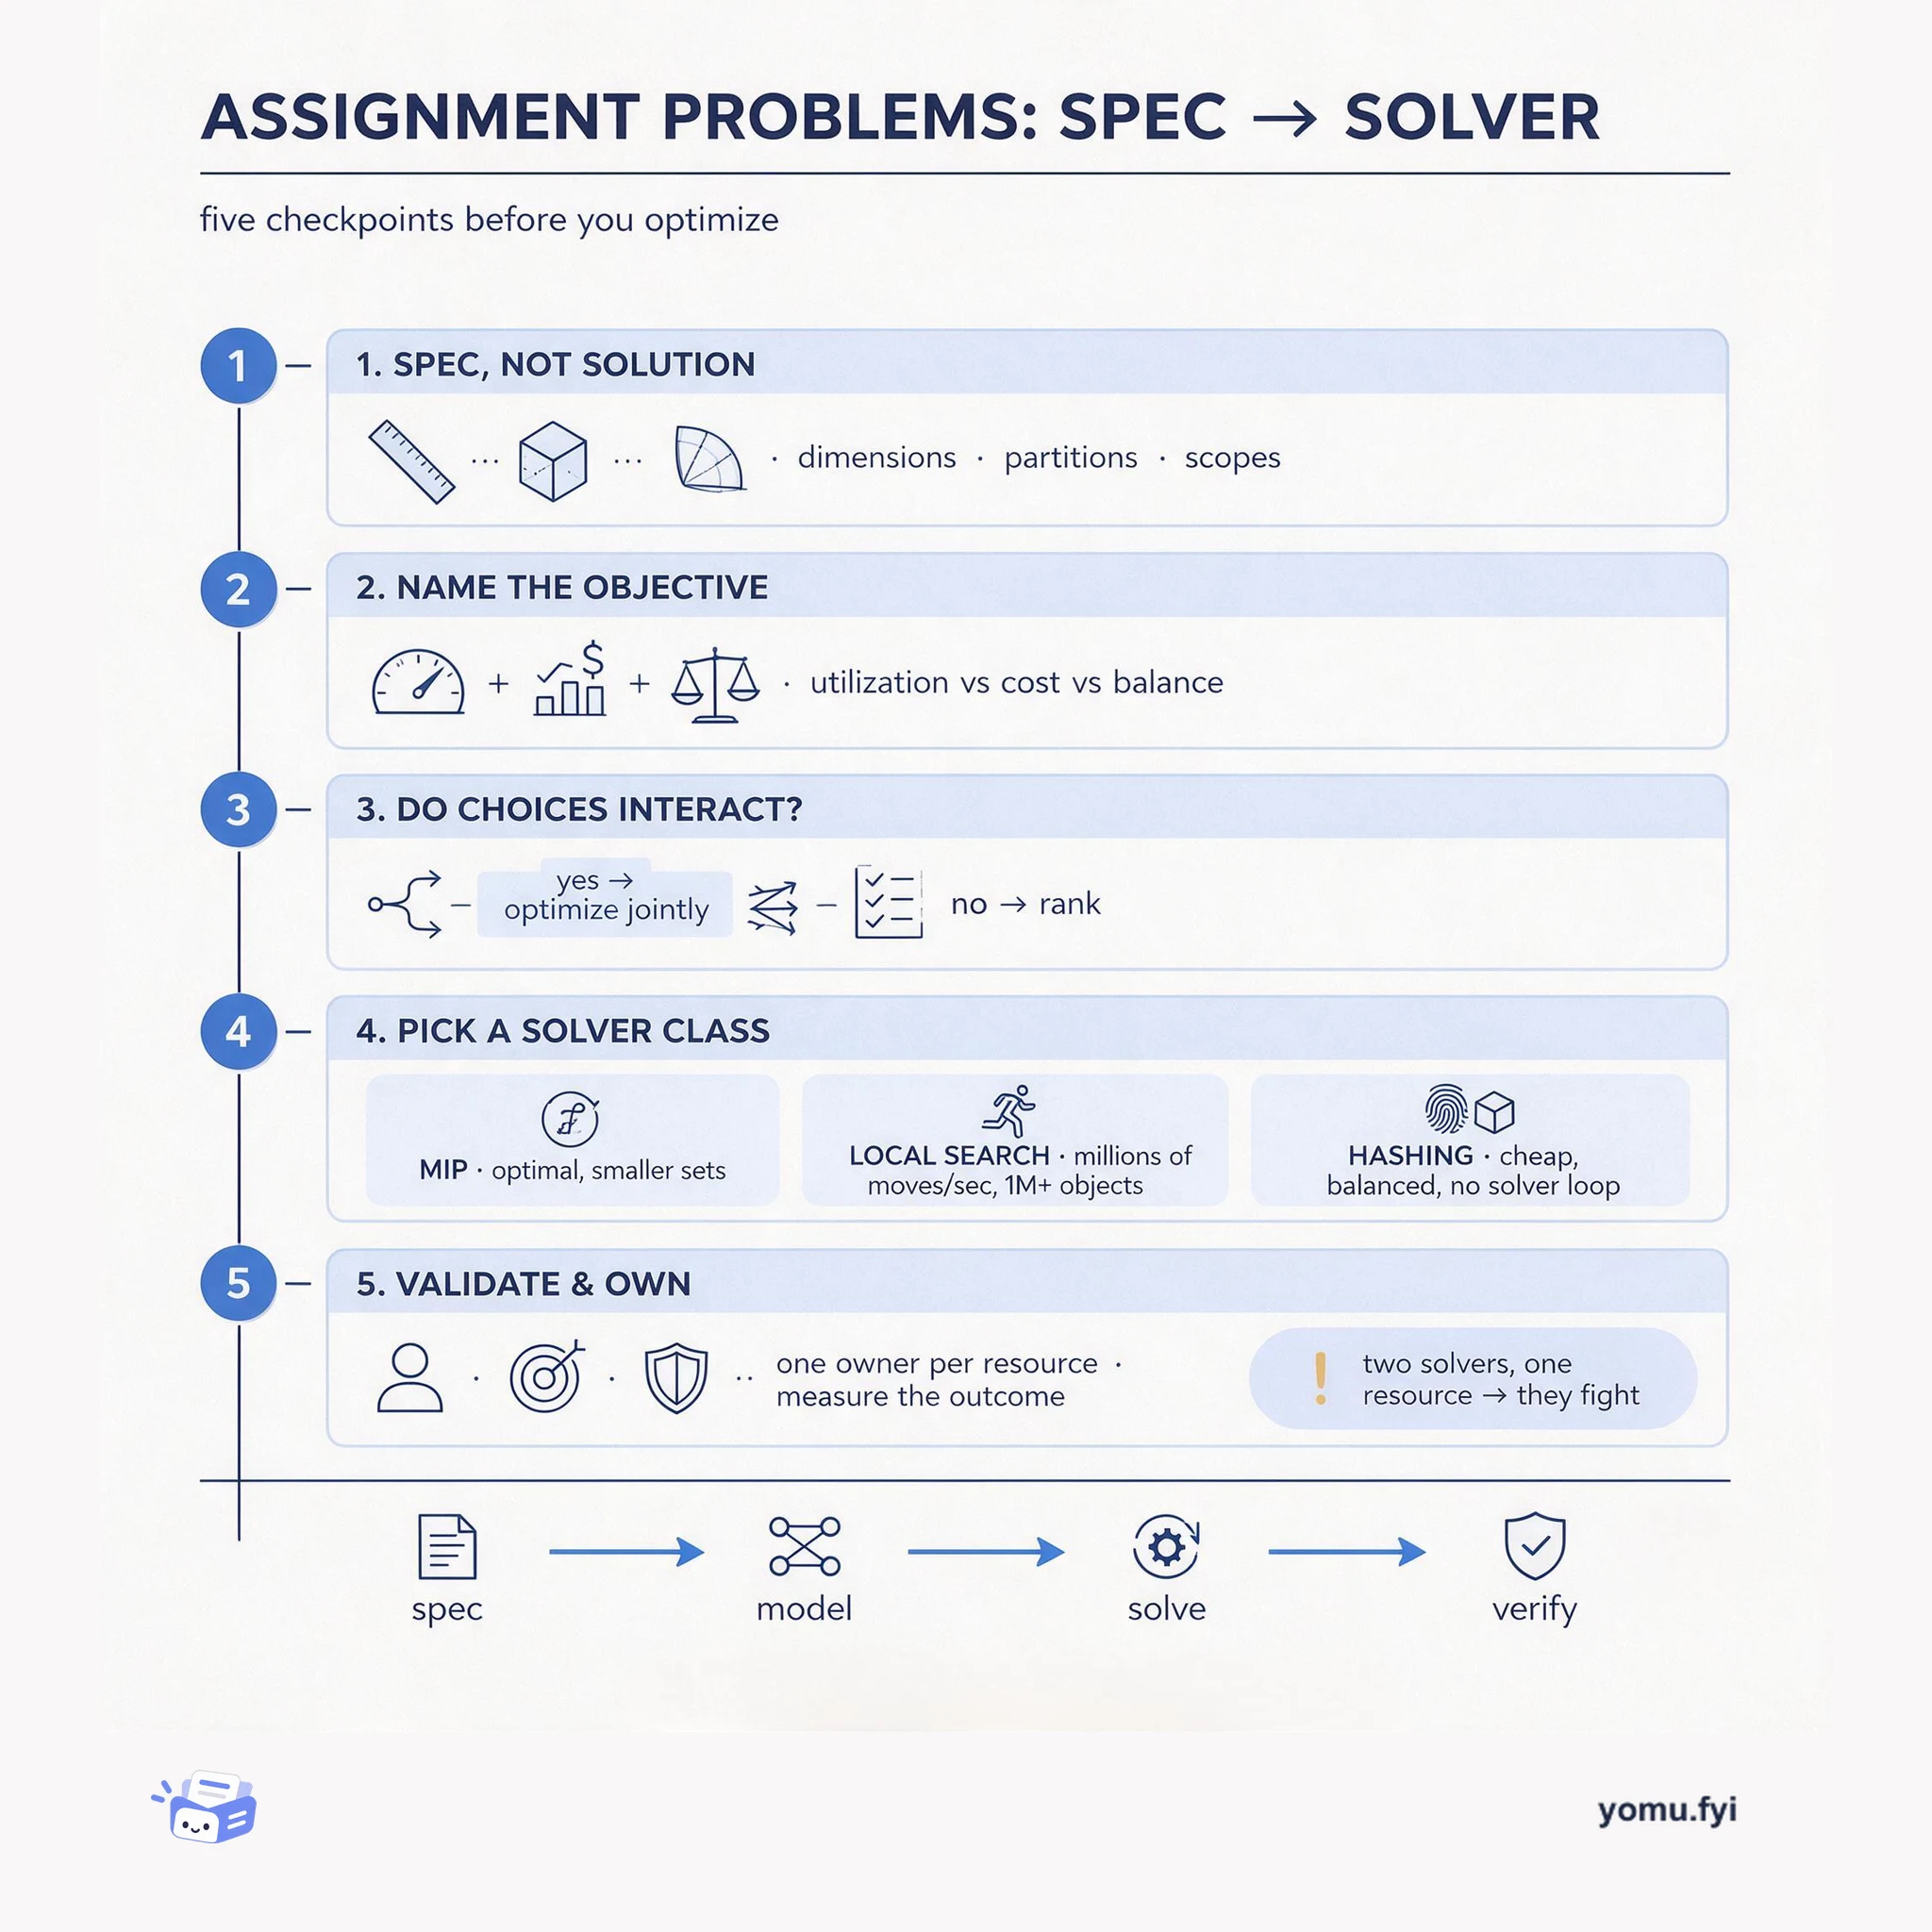
A five-checkpoint workflow for assignment problems: write the spec, name the objective, test whether choices interact, pick a solver class by scale, then validate against live state.
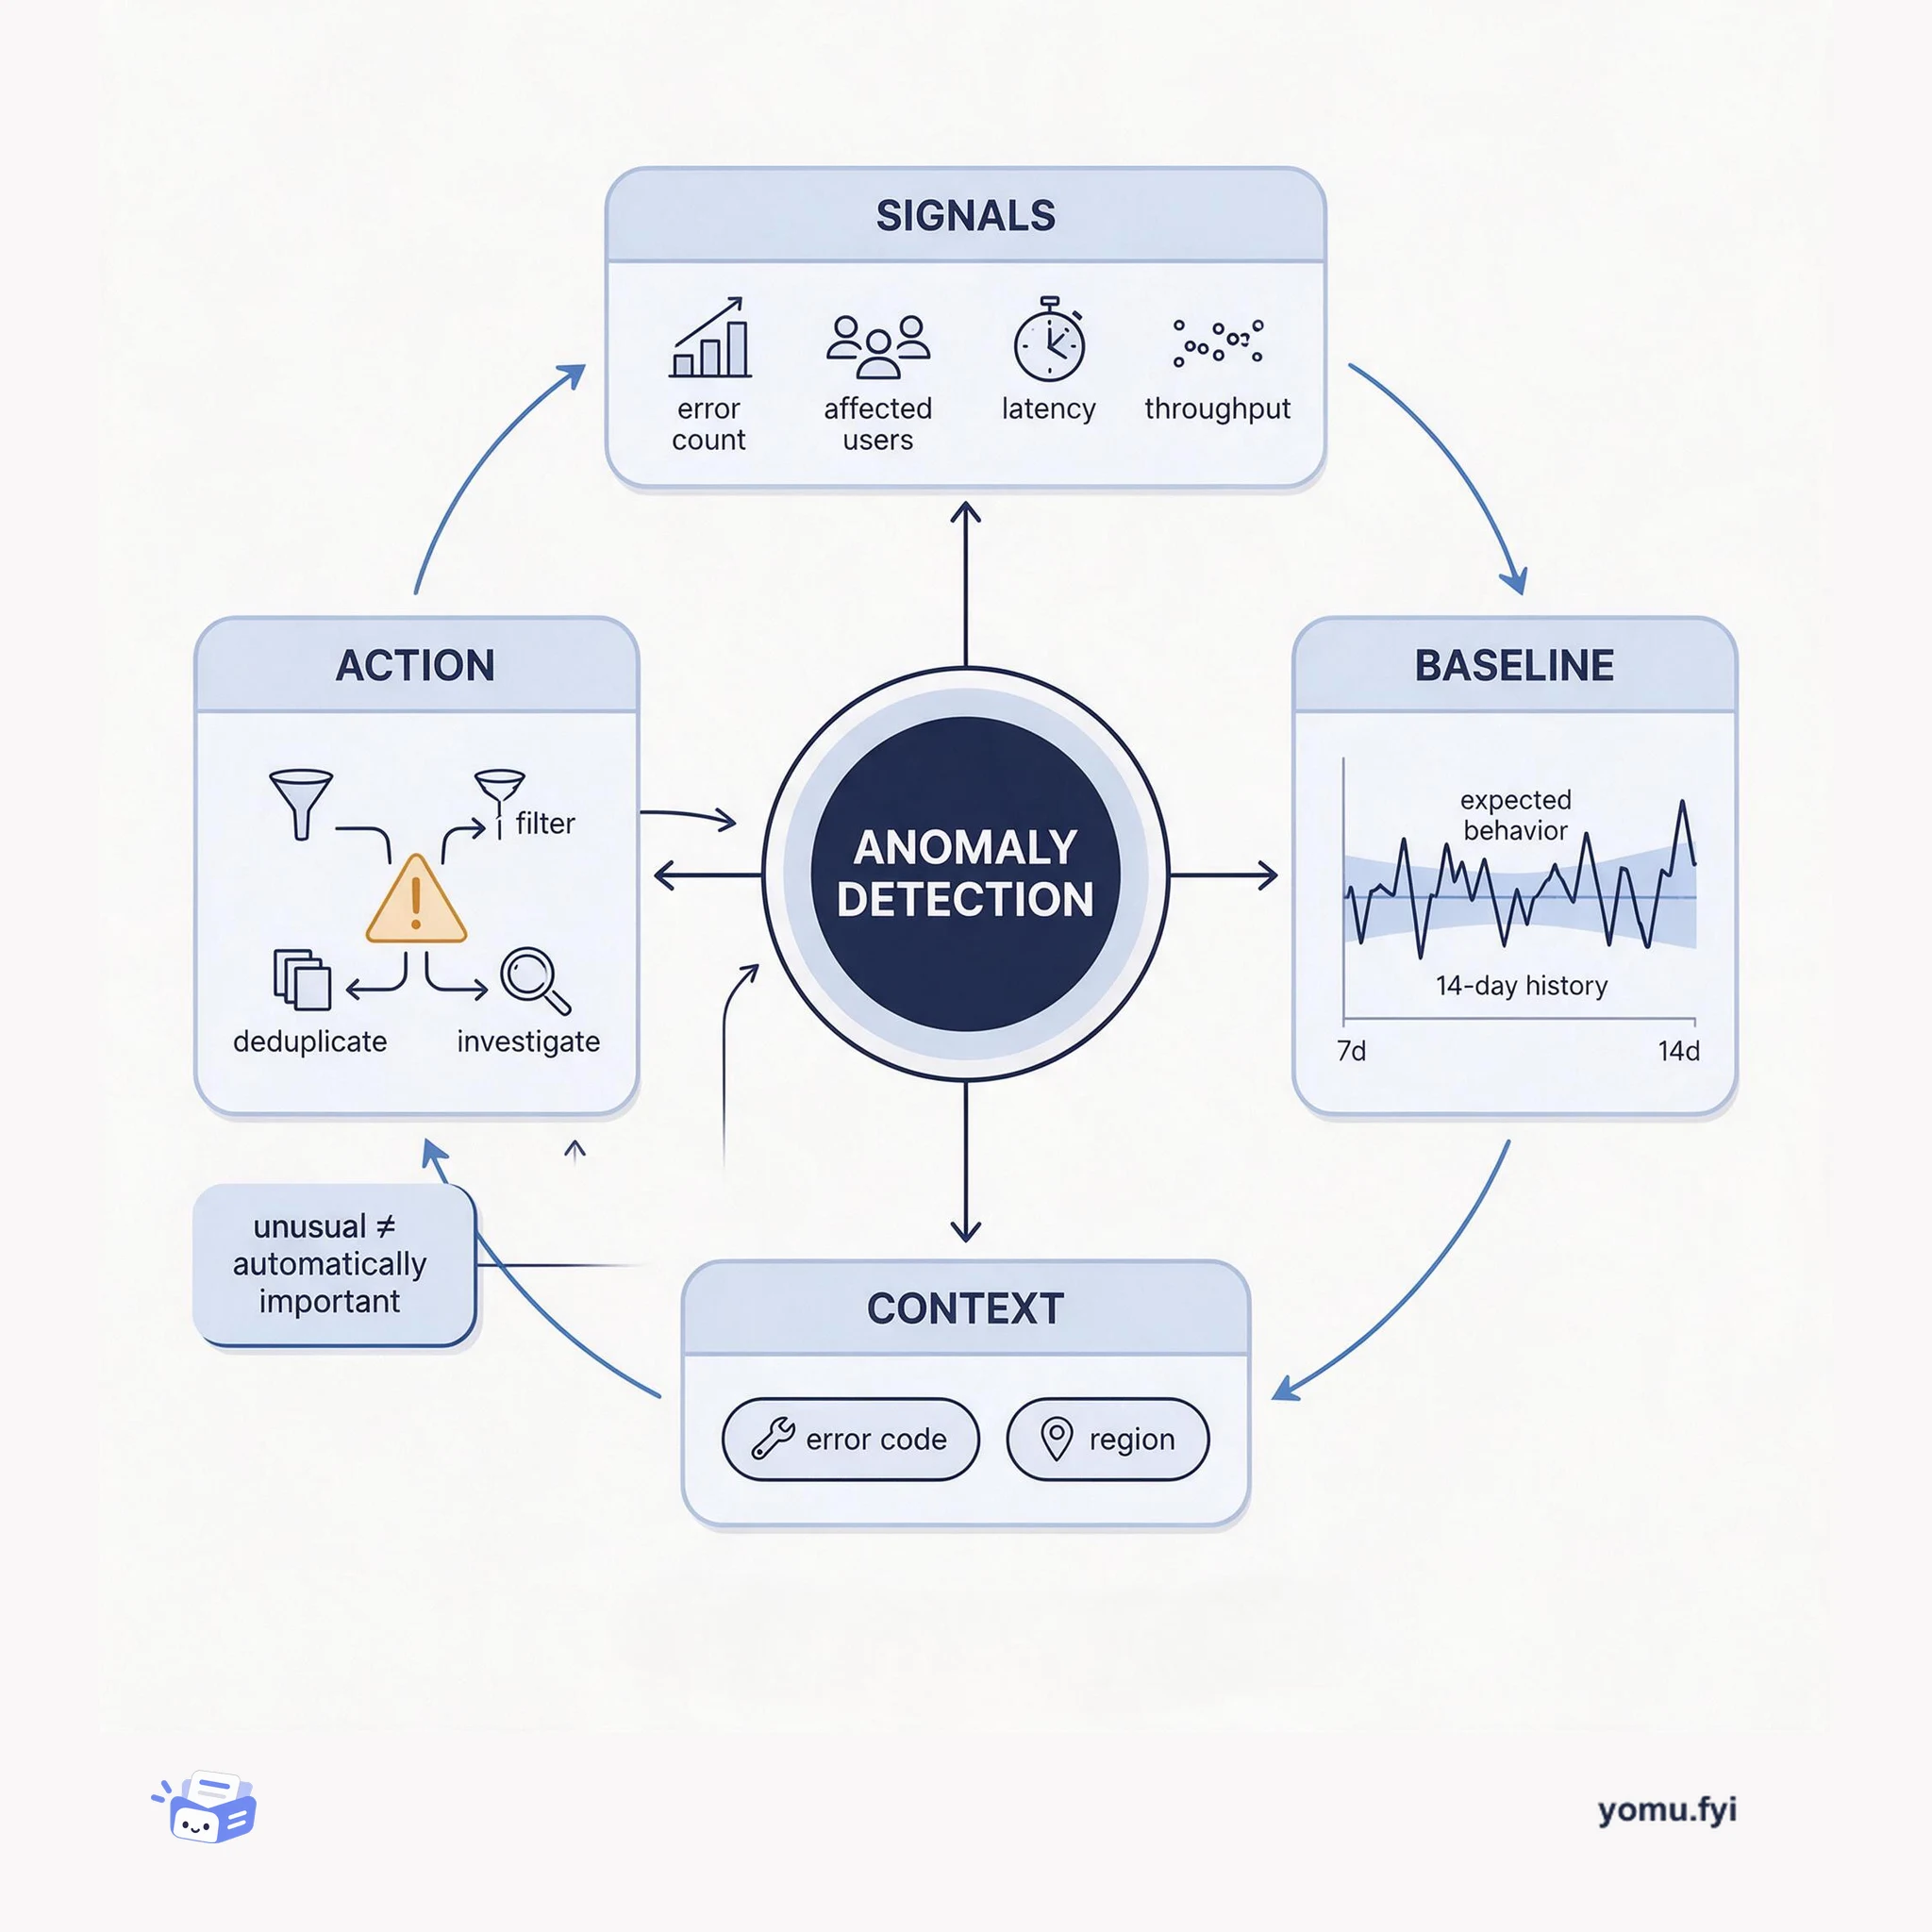
Anomaly detection identifies meaningful departures from expected behavior. This explainer shows how signals, baselines, context, and alert routing turn unusual measurements into engineer-ready findings.
Keep reading
Related reading
The Good Stuff
Paid picks we use ourselves. Links carry a referral code — a subscription through one earns us a commission at no extra cost to you.