Car Rental: A Search Layer, a Contract, and a Handover
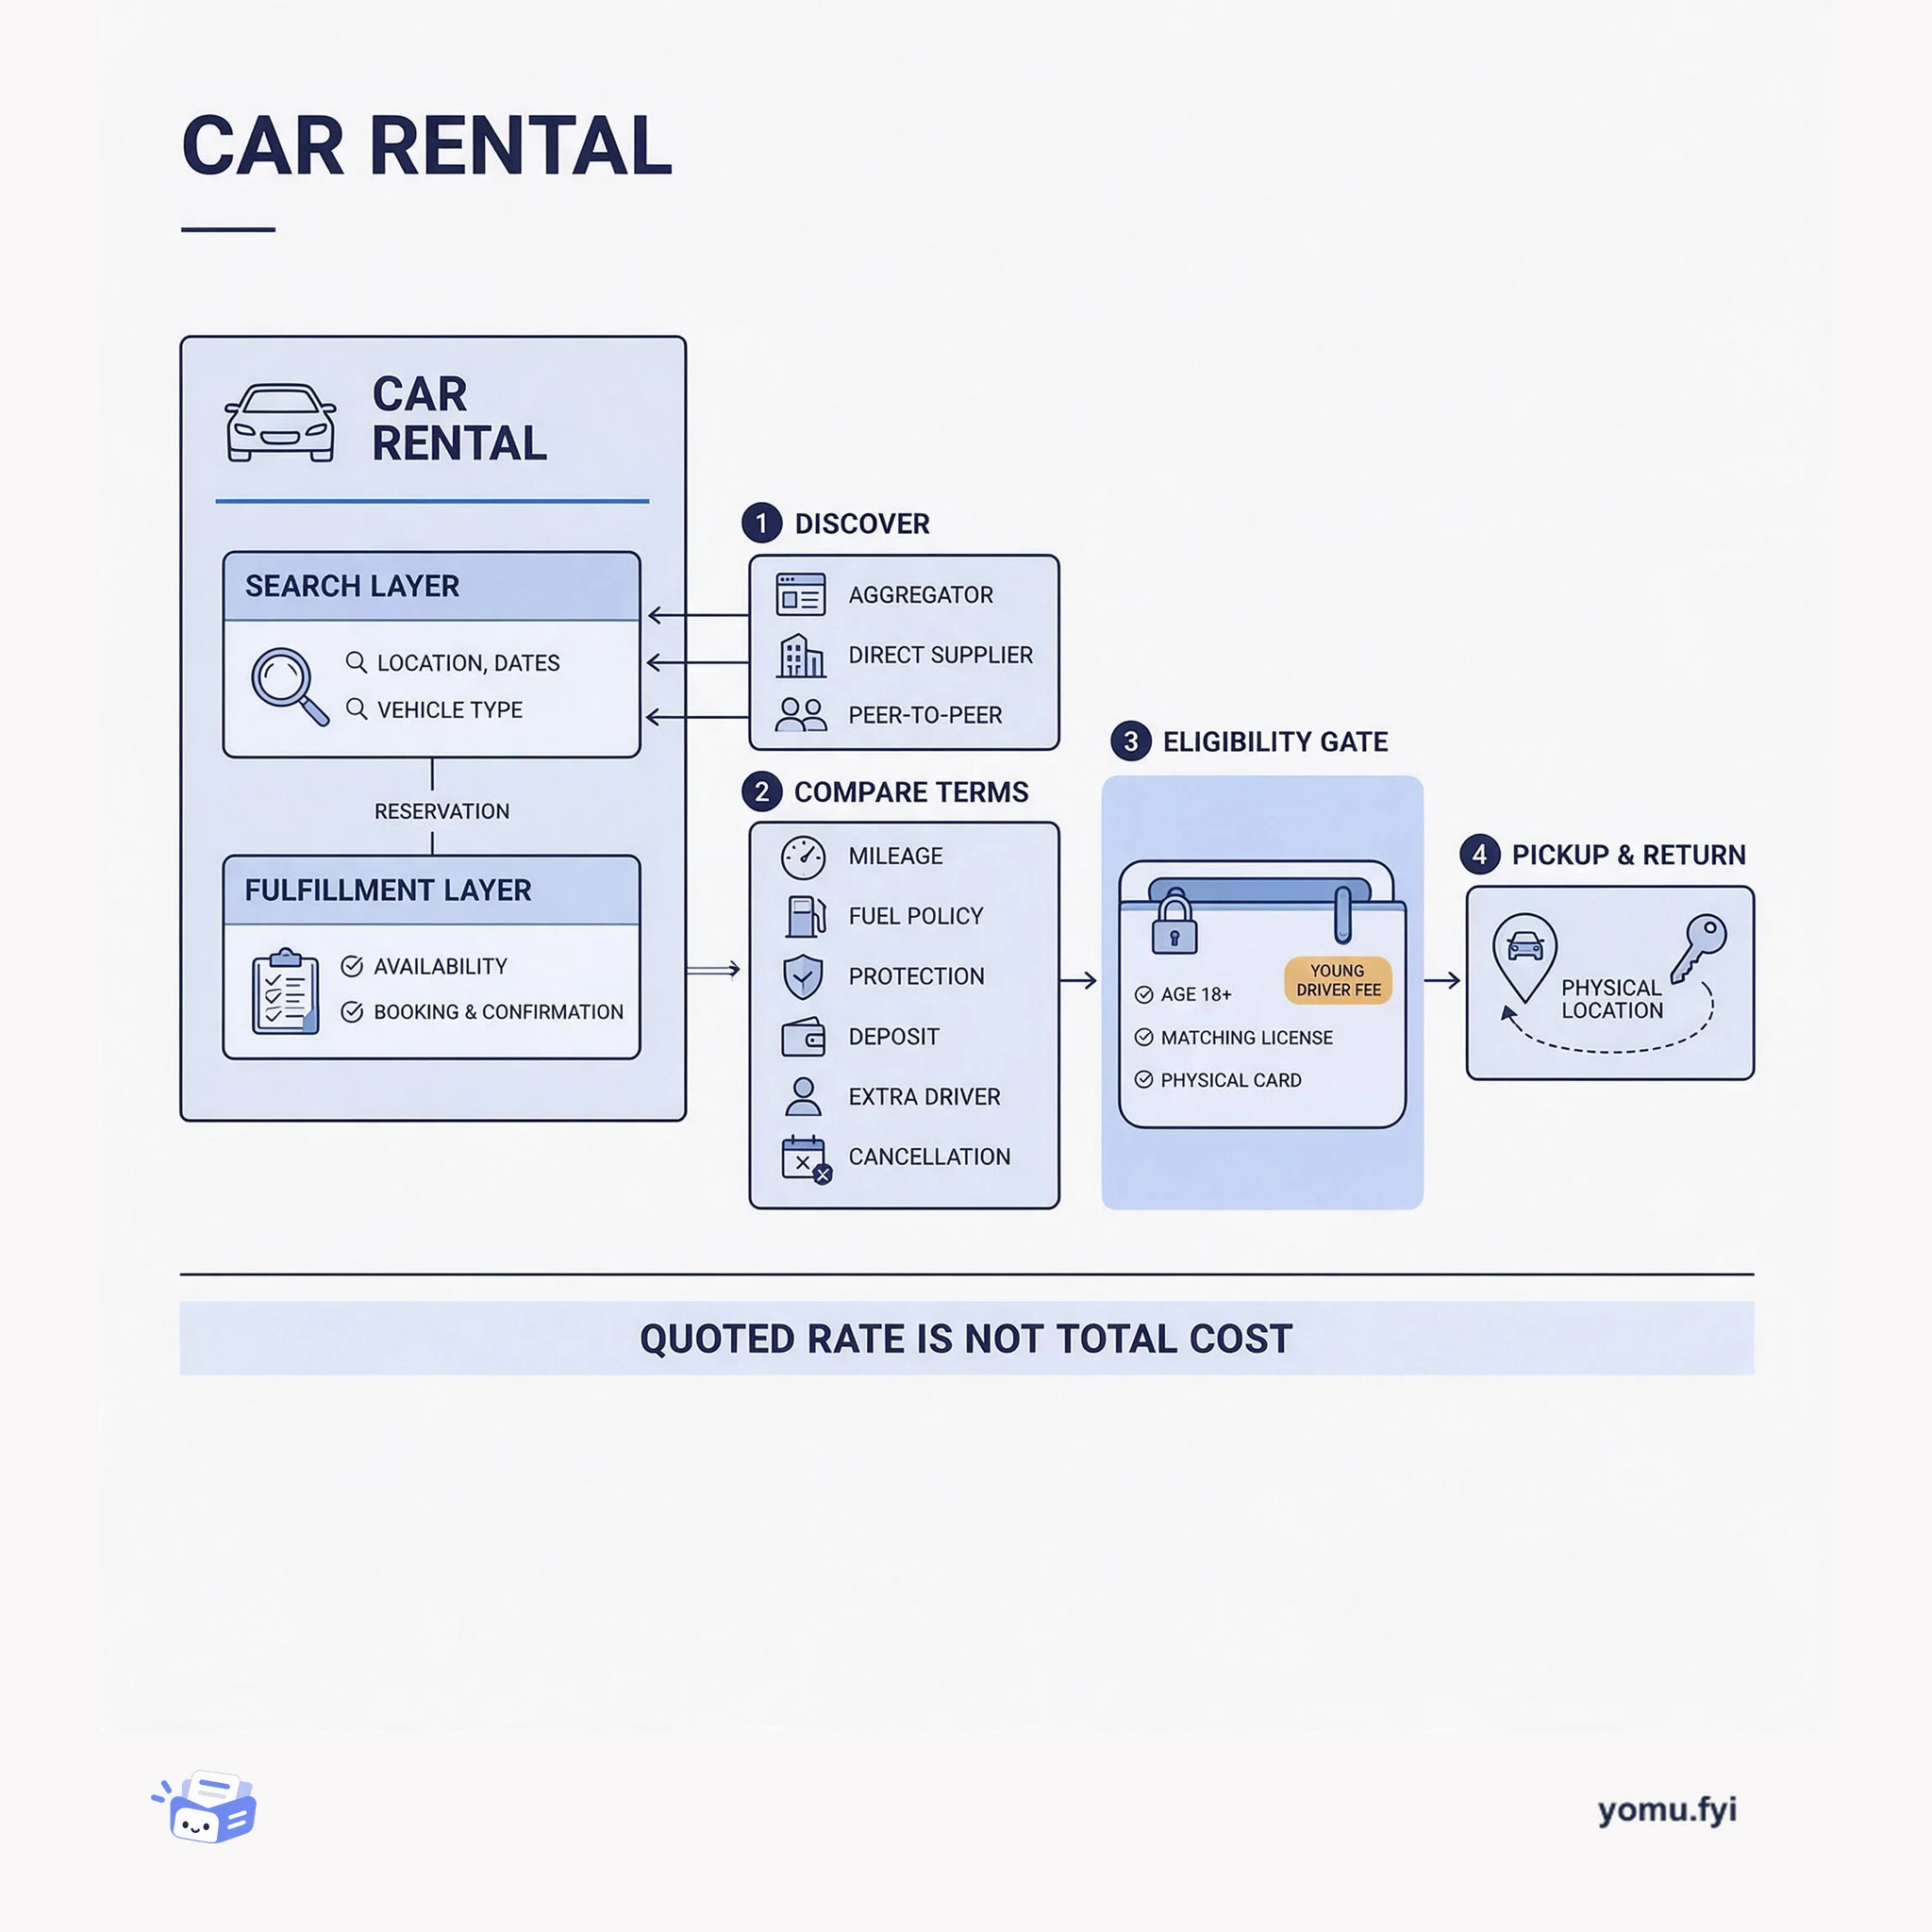
A car rental is a search layer over many fleets plus a contract enforced at the counter. This explainer maps its four parts and why the advertised daily rate never equals the total cost.
Anomaly detection identifies meaningful departures from expected behavior. This explainer shows how signals, baselines, context, and alert routing turn unusual measurements into engineer-ready findings.
Anomaly detection is the process of identifying observations that differ materially from expected behavior in a system or dataset. A useful mental model separates four parts: collect measurable signals, establish a baseline, add context such as error code or region, and route only actionable findings for investigation. RADAR illustrates this with streaming detection over error counts and affected users, while operational dashboards and telemetry help engineers inspect the result. The key lesson is that detection is a pipeline, not just a threshold.
A baseline represents expected behavior over time, so the detector can compare new observations with recent conditions. RADAR, for example, learns normal behavior from the previous 14 days using a risk parameter rather than relying only on a fixed limit.
Segmenting signals by dimensions such as error code and region can reveal that only a subset of users is affected. RADAR combines error counts with distinct affected users and those segments to expose gray failures that health checks may miss.
A scored deviation is not automatically an actionable incident. Downstream filtering, enrichment, deduplication, and routing reduce noisy or repeated alerts and give engineers details for investigation; dashboards and telemetry then support follow-up analysis.
The posts behind it
 Databricks · · Problem & solution
Gray failures are partial customer-facing problems that can leave health checks green while a subset of users quietly fails. RADAR (Reliability Anomaly Detection, Alerting, and Root-cause analysis) addresses this gap by collecting error counts and distinct affected users, segmented by error code and region, then applying the unsupervised streaming SPOT model. SPOT learns normal behavior from the previous 14 days using a single risk parameter, while downstream stages enrich, filter, deduplicate, and route alerts before providing anomaly details and AI/BI Genie-backed dashboards for investigation. Running RADAR internally reduced incident-discovery time by 95% with over 90% precision and no human needed to spot the pattern. The post also describes a Databricks scaffold that maps metrics, detection, alerting, and root-cause analysis to platform components and can be assembled by an AI agent from a metric, scaffold, and prompt.
 NVIDIA · · Benchmark
AIPerf is NVIDIA’s successor to GenAI-Perf, intended to benchmark large-scale LLM inference without letting the load client become the bottleneck. Its multiprocess architecture combines worker processes, separate record-processor services, and ZMQ coordination, while supporting 15+ endpoint types, public datasets, and trace-replay formats. The walkthrough serves Qwen3-0.6B through vLLM, using streaming synthetic requests with fixed 128-token inputs and outputs; AIPerf reports TTFT, ITL, request latency, output token throughput, percentile distributions, and optional GPU telemetry in CSV and JSON. A second profile uses Poisson arrivals averaging 10 requests per second, variable input and output lengths, and a fixed random seed, producing wider latency distributions than the static baseline as concurrency and workload variability increase.
 Red Hat · · Tutorial
AI infrastructure costs are often billed to a platform team as one lump sum, leaving Finance without a departmental breakdown and teams without feedback on their usage. The post presents a working demo on Red Hat OpenShift AI that attributes requests and token consumption through department-specific MaaS API keys, shared model servers, Prometheus metrics, Perses dashboards, and MLflow traces. In its example, three departments generate 79,420 inference requests and consume 634 million tokens against a $14,200 quarterly bill, while Marketing’s 32% GPU utilization reveals roughly $34,000 in annual waste. The system combines aggregate usage filters with request-level details such as prompts, token counts, latency, and calculated cost, and the post argues that showback helps identify inefficient allocations and model mismatches rather than police teams.
Databricks · · ExplainerAgentic analytics is an approach in which autonomous AI agents continuously monitor data, detect patterns and anomalies, generate contextual insights, and take actions with minimal human intervention. Unlike traditional business intelligence, which relies on people to query dashboards and interpret reports, these systems operate as goal-directed decision loops that can recommend or trigger alerts, forecasts, workflows, and system changes within defined boundaries. Their architecture combines data access, agent orchestration, LLM-based reasoning, a semantic layer, action integrations, and feedback signals. The source identifies faster insight, lower reporting overhead, reduced analytics backlogs, and potentially better forecasting as benefits, while stressing governance, auditability, security, monitoring, and human oversight to control errors and unintended outcomes.
More like this
A car rental is a search layer over many fleets plus a contract enforced at the counter. This explainer maps its four parts and why the advertised daily rate never equals the total cost.
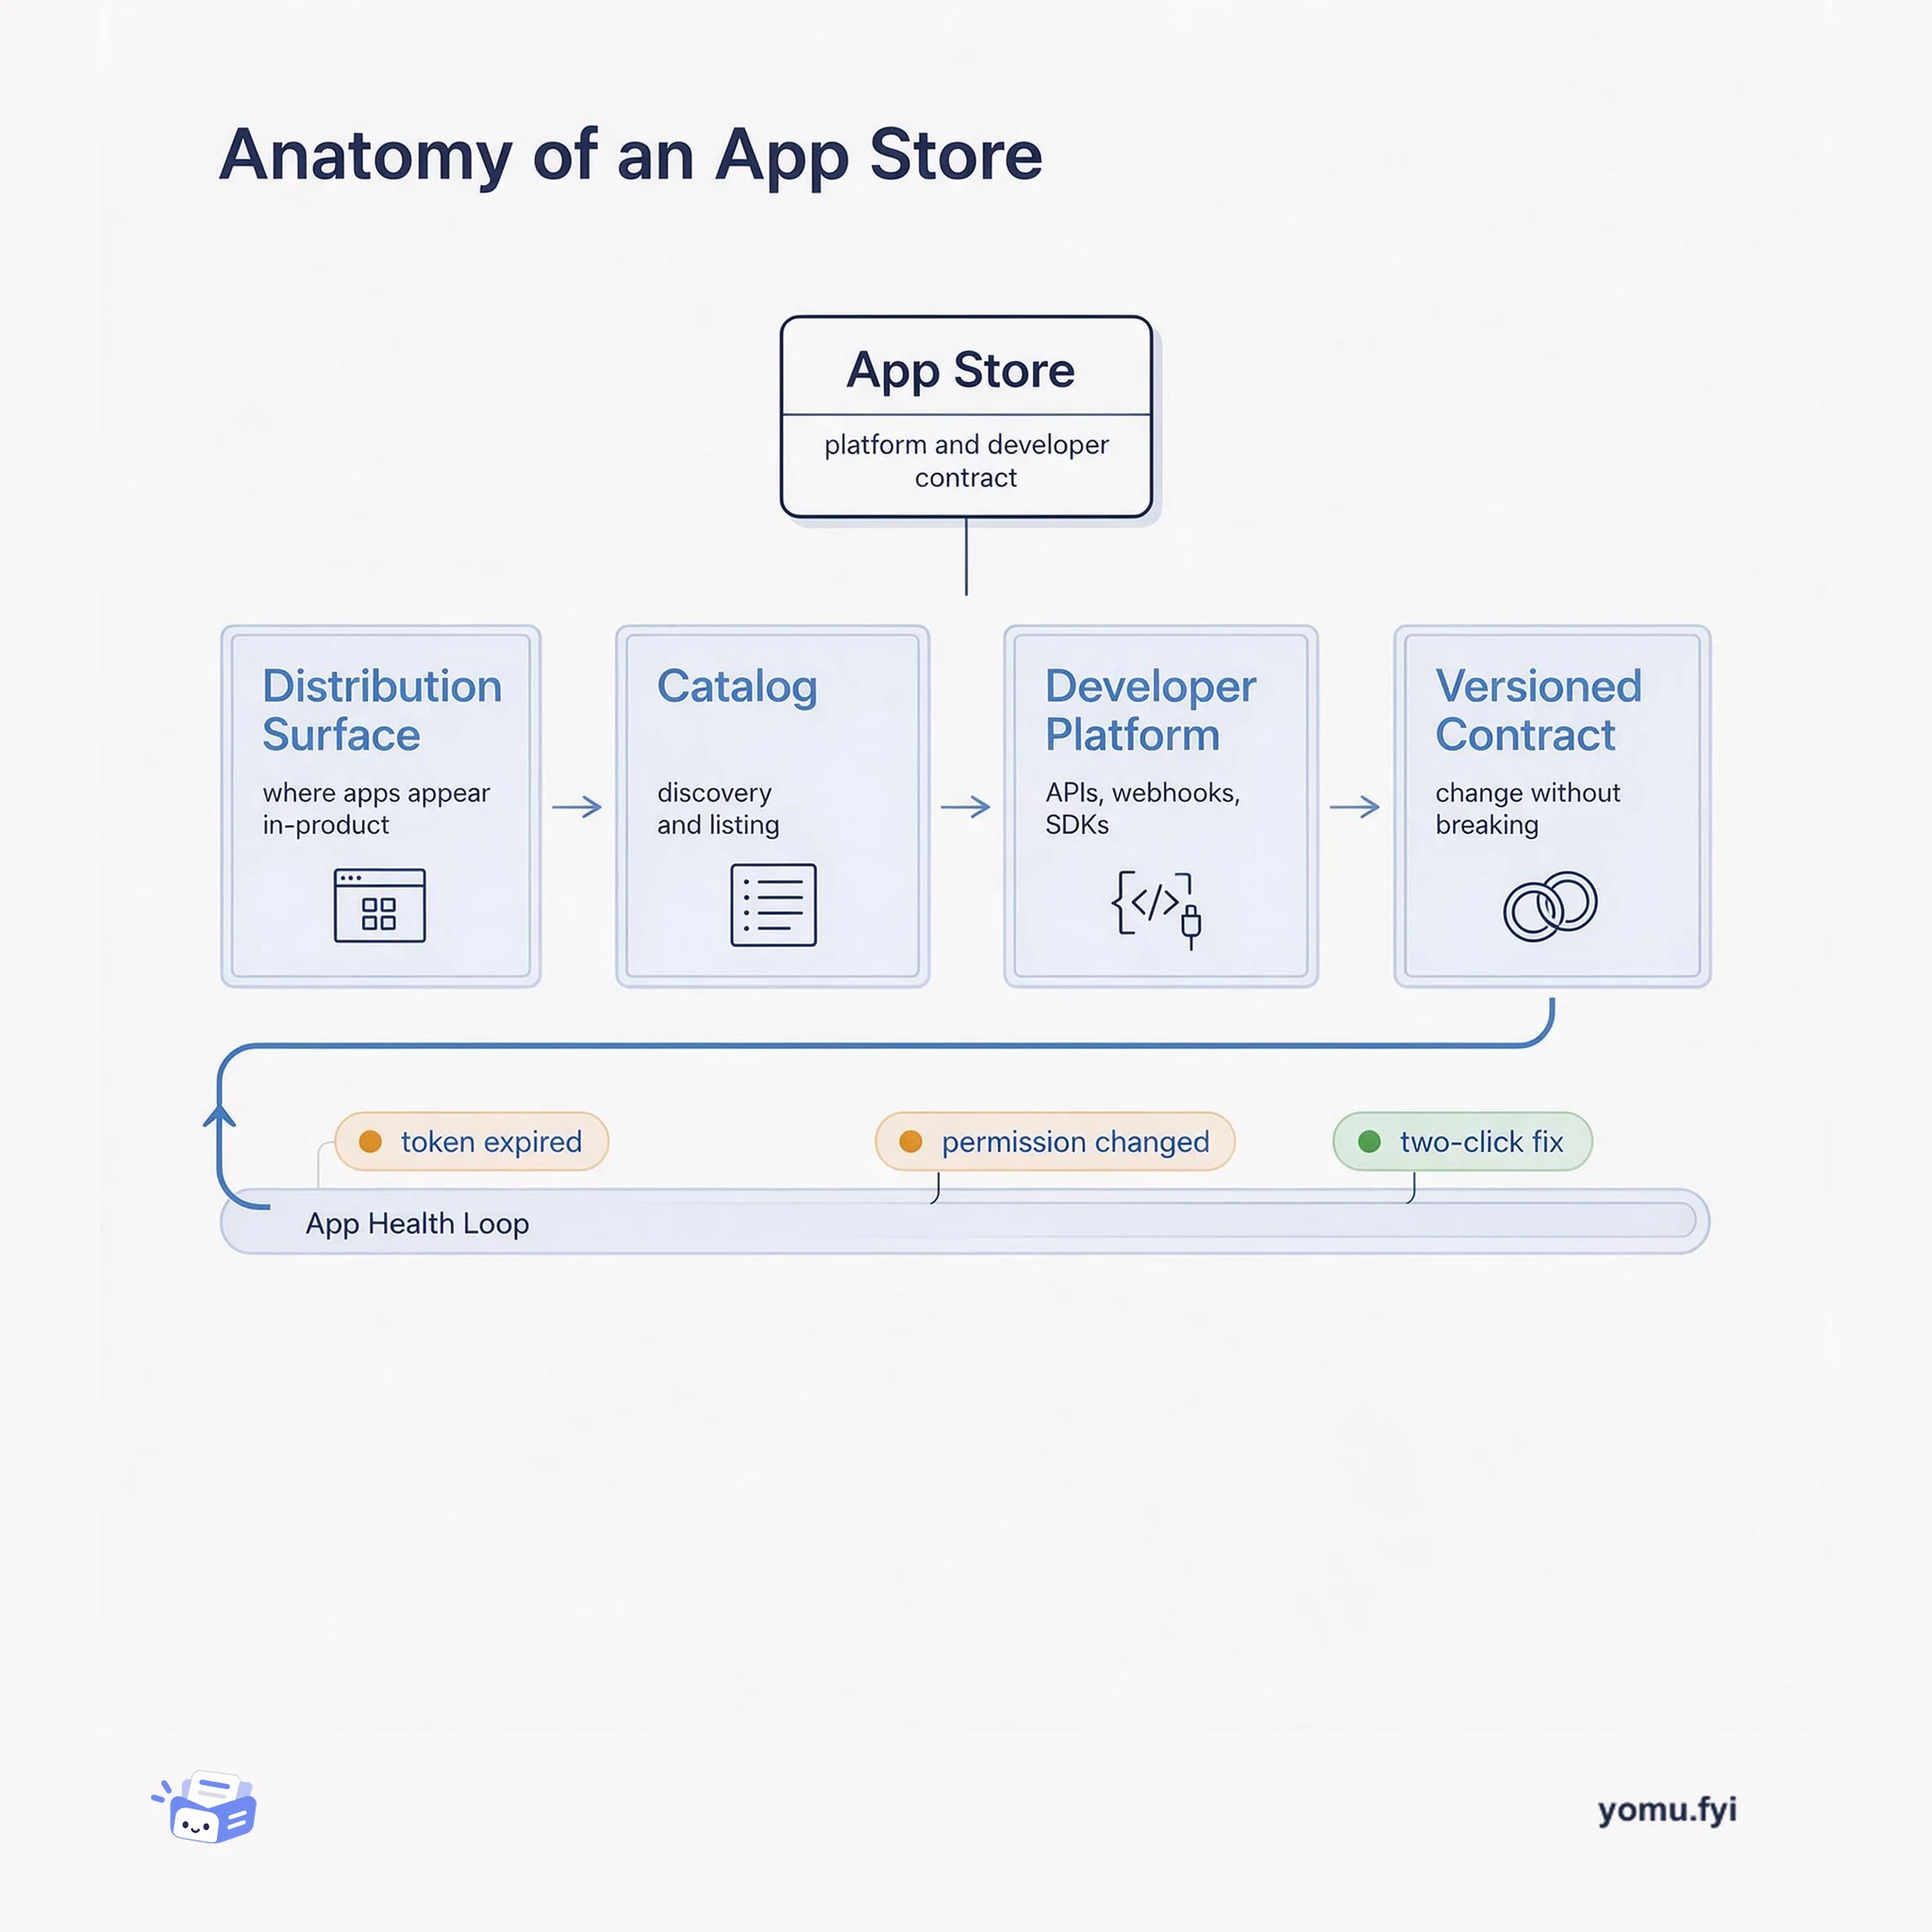
An app store is a distribution surface, a versioned contract, and a health loop between a platform and its developers. Here is how those parts fit together and why each one fails loudly if ignored.
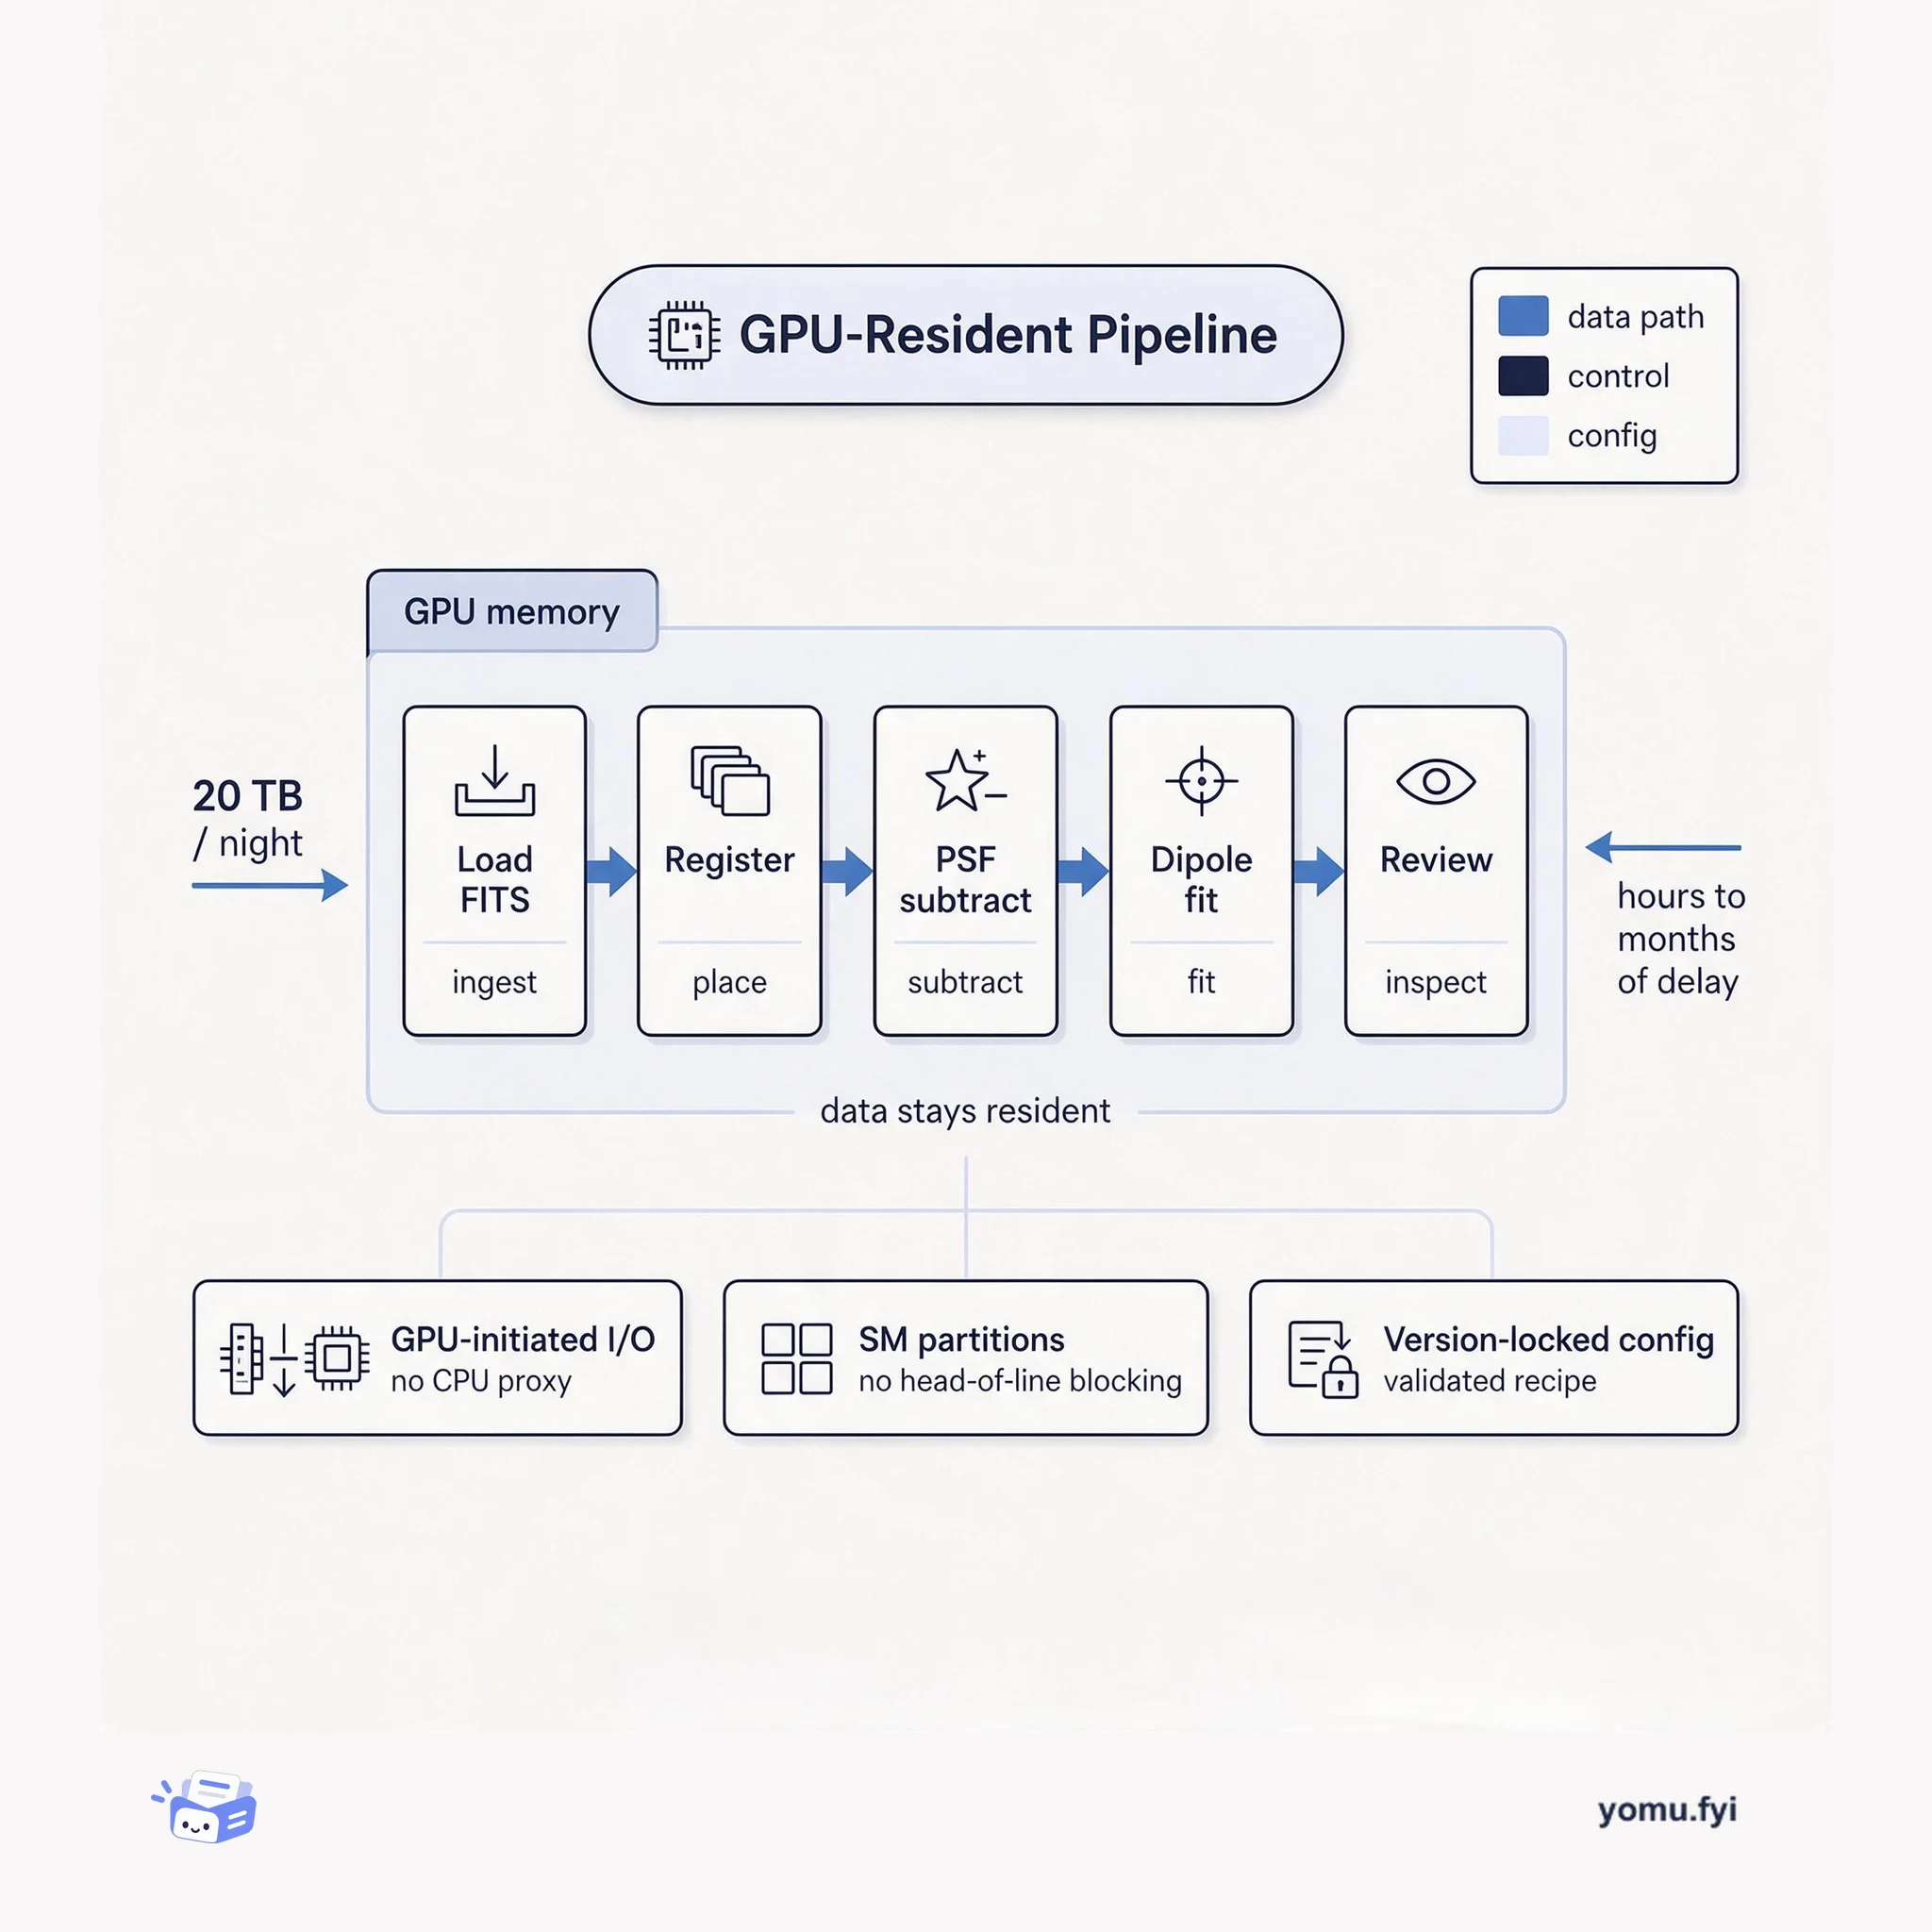
A GPU-resident astronomy pipeline keeps every stage of image analysis — load, align, subtract, detect, review — inside GPU memory instead of round-tripping through the CPU.
The Good Stuff
Paid picks we use ourselves. Links carry a referral code — a subscription through one earns us a commission at no extra cost to you.
One useful email. Unsubscribe anytime.