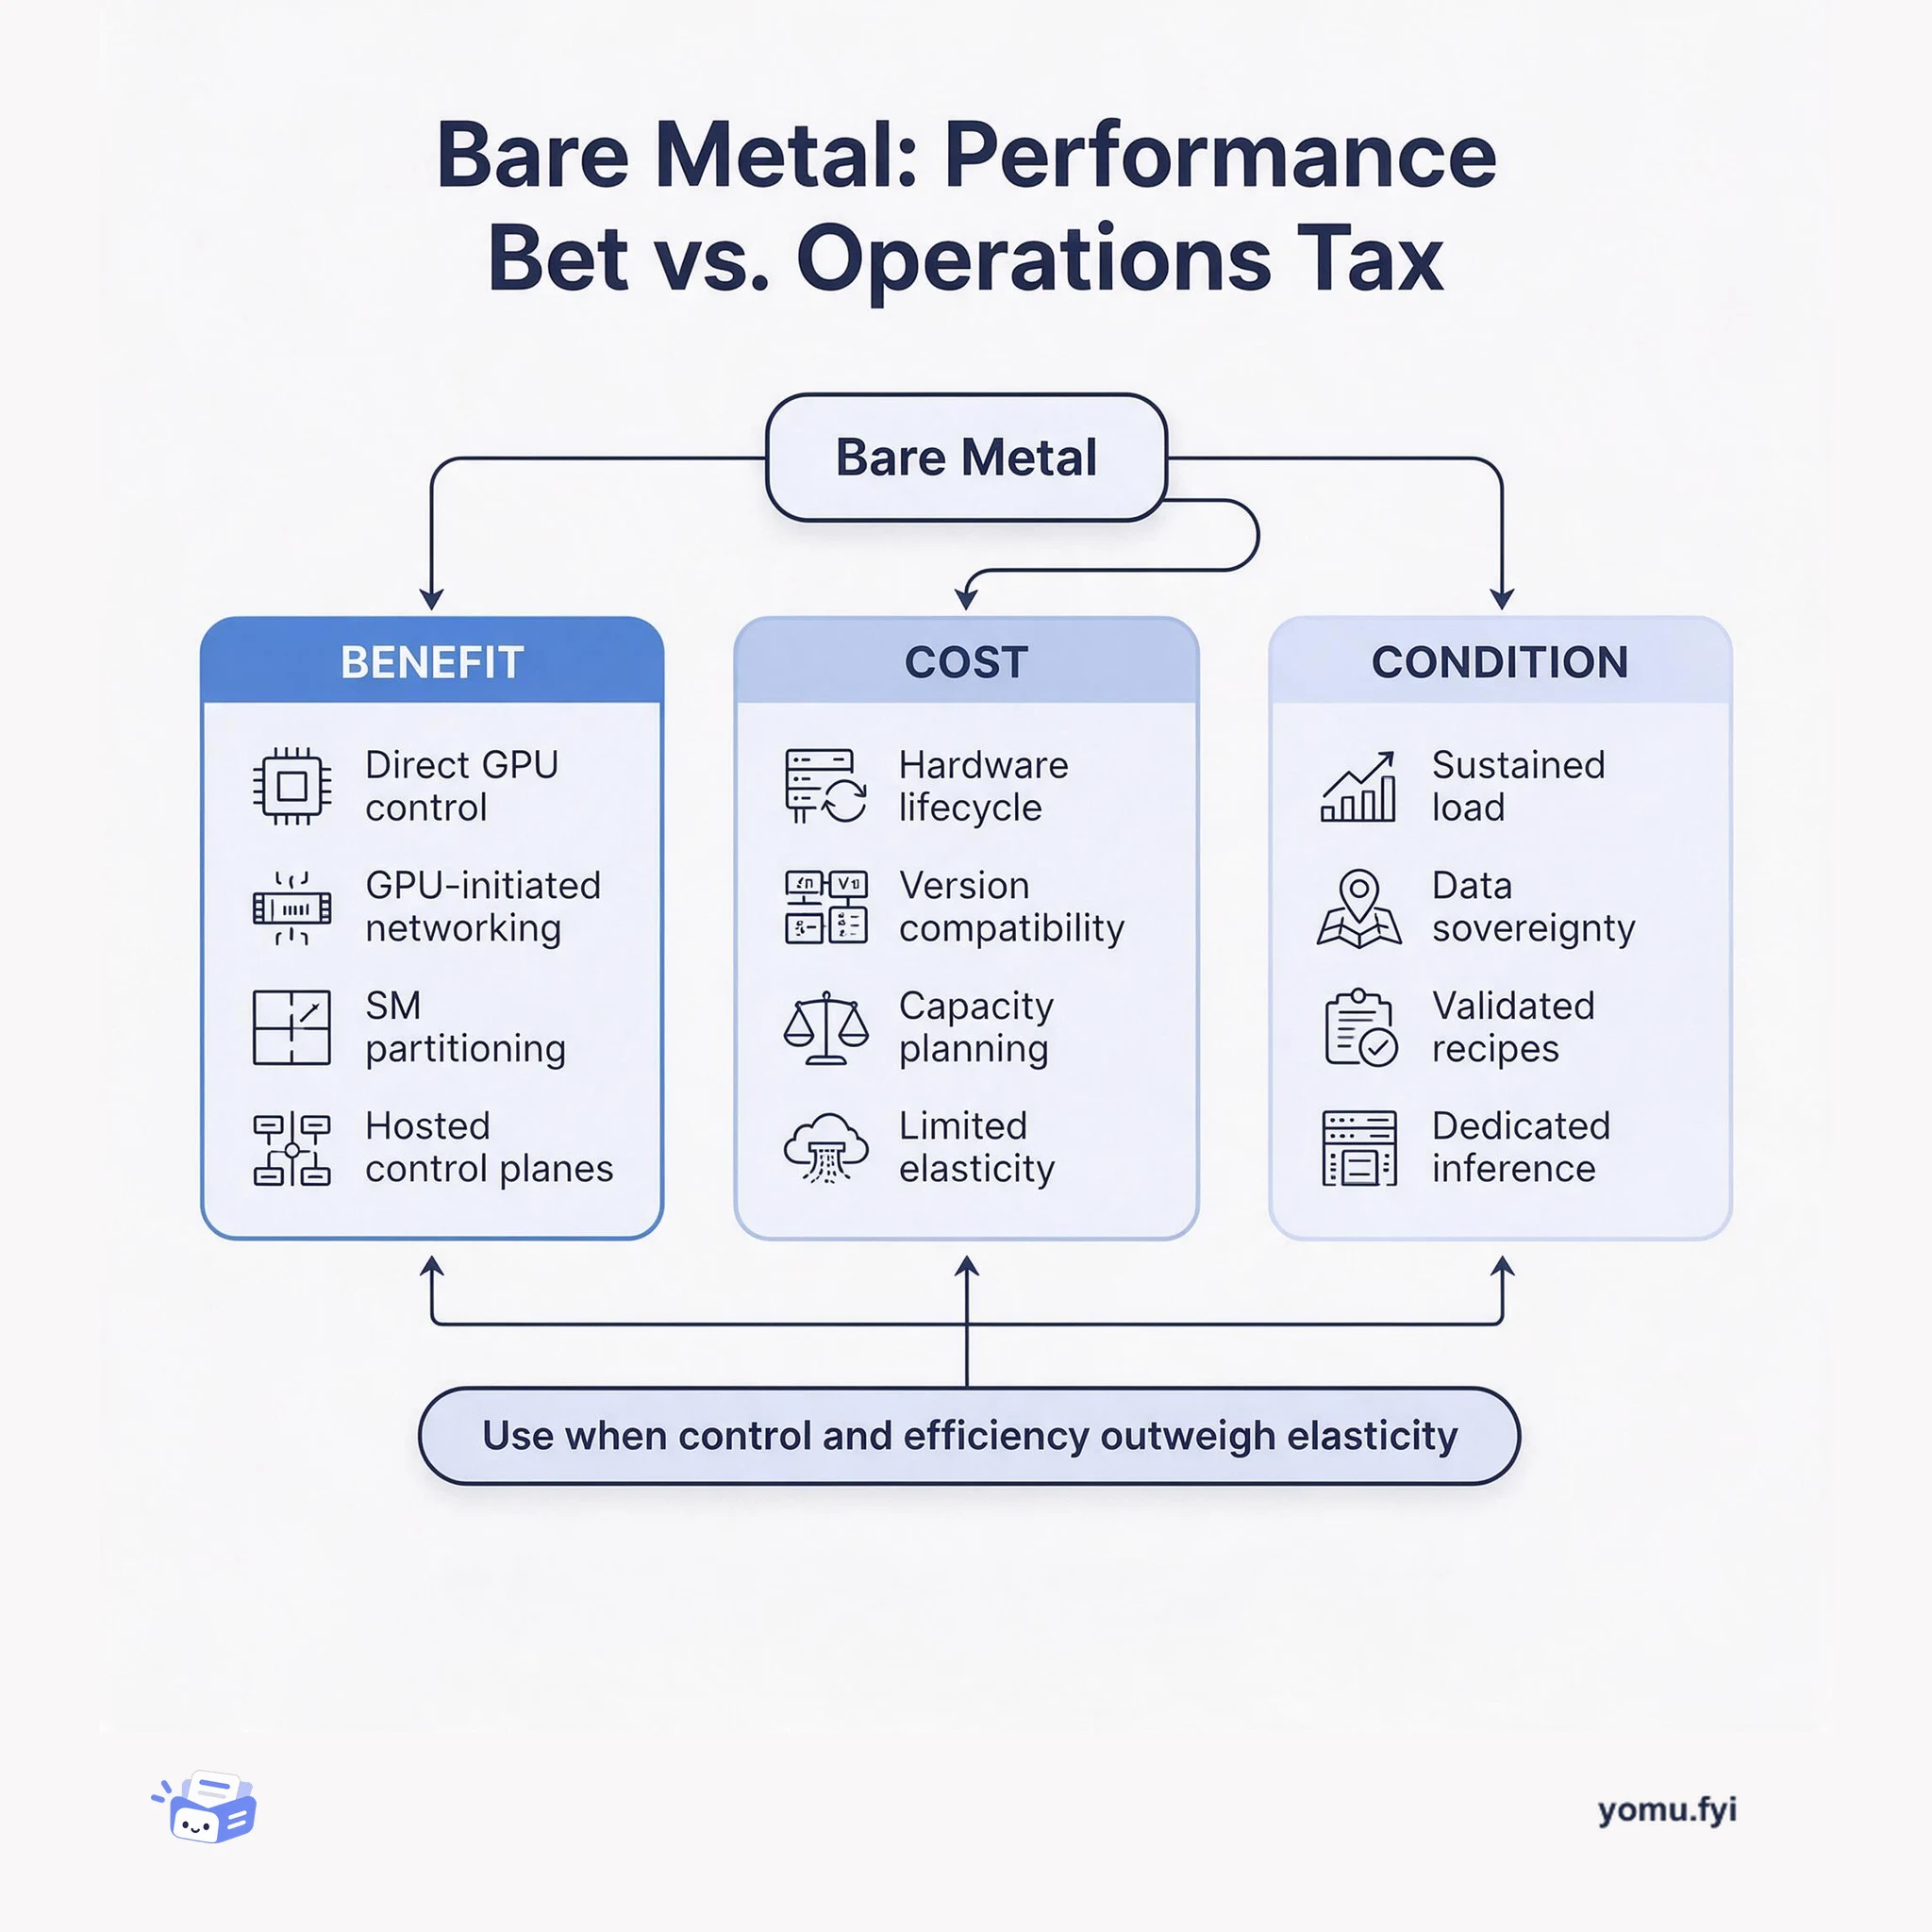
Bare Metal: Performance Bet vs. Operations Tax
Bare metal gives engineers direct control over GPU, network, and virtualization layers, but it shifts elasticity and lifecycle work onto the team. This trade-off map shows when that bargain pays off.
Loading…
Topic
812 posts about Performance. Every summary links to the original.
See the idea
Bare metal gives engineers direct control over GPU, network, and virtualization layers, but it shifts elasticity and lifecycle work onto the team. This trade-off map shows when that bargain pays off.
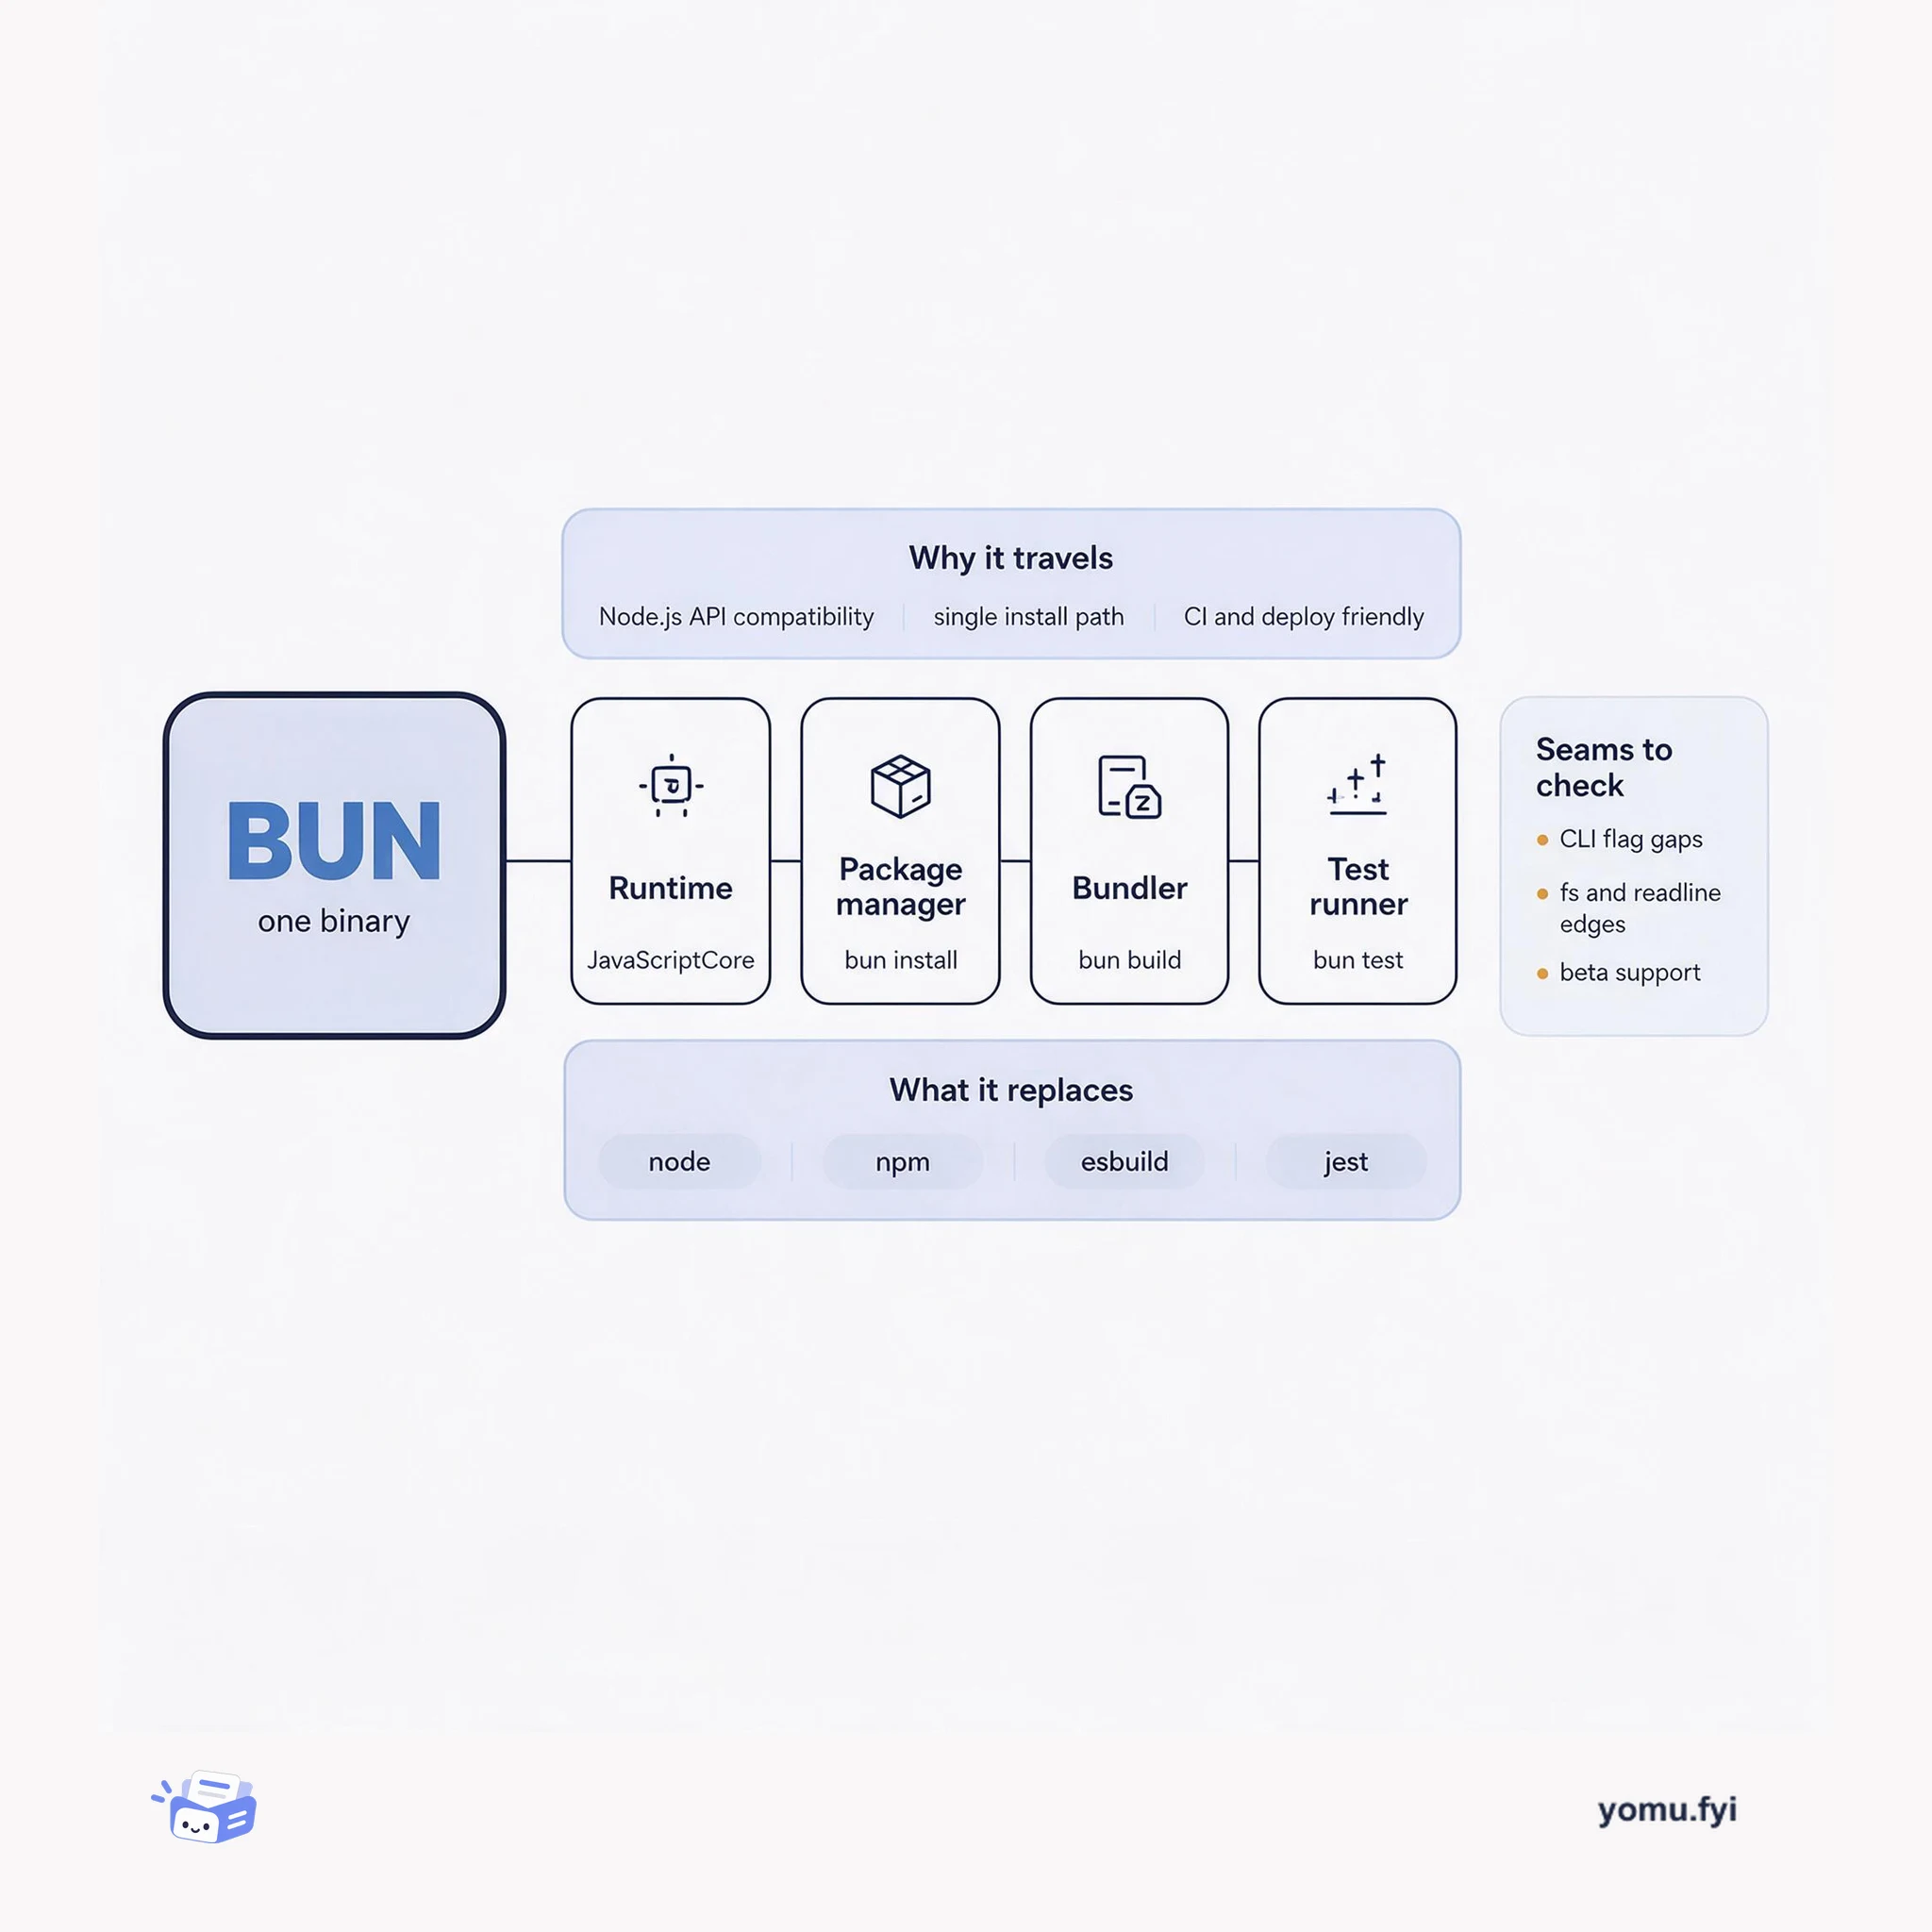
Bun packs a runtime, package manager, bundler, and test runner into one binary. Here is how those four parts fit together and where the seams still show.
A five-step how-to for deciding when an AMD Instinct GPU should stay dedicated and when SR-IOV virtual functions, VMs, or sidecar isolation can safely share it.
The Good Stuff
Paid picks we use ourselves. Links carry a referral code — a subscription through one earns us a commission at no extra cost to you.
Newest first
Postgres views serve as query shortcuts that execute underlying SQL statements upon retrieval without generating new tables or persisting duplicate data. By encapsulating complex multi-table joins, standard views provide query consistency across applications, simplify repetitive calls, improve logical schema organization, and enhance security by restricting sensitive columns. In contrast, materialized views physically store query results on disk, dramatically reducing read latency for heavy queries spanning millions of rows. Because materialized views introduce the trade-off of stale data, administrators must periodically run the refresh command based on workload tolerances for use cases like analytics and internal dashboards. Materialized views should not substitute query optimization, as underlying query efficiency remains essential.
Shopify addressed inefficient data access in its multi-tenant Rails application, where auto-incrementing primary keys interleaved records from many shops even though queries usually targeted one shop. InnoDB stores rows in B+ trees and loads pages into a buffer pool, so the team changed orders and other suitable tables to composite primary keys such as [shop_id, order_id] while keeping an auto-incrementing id secondary key and configuring Active Record to use id. Supporting Ghostferry, migration tooling, and data extraction systems also had to accommodate the schema change, with unique secondary constraints avoided in some cases because LHM migrations could deadlock. On the most queried table, common queries improved 5–6x, median buffer pool reads fell from 1.8 to 1.2, and elapsed database time dropped roughly one hour per day per shard, while inserts became about 10x slower.
Shopify theme code can create server-side rendering bottlenecks that leave customers waiting on a blank screen, so the article explains how to analyze Liquid performance with Shopify Theme Inspector. It describes flame graphs as representations of code paths and execution time, then compares clean Liquid with heavy loops, nested loops, and mixed global Liquid scopes. Accessing product attributes raised a 10-item example from 13 ms to 162 ms, while 50 products took 800 ms; two- and three-level nested examples rendered in 55 ms and 72 ms. The guidance recommends examining total iteration time, sawtooth or hair-comb patterns, unnecessary attributes, pagination size, and AJAX alternatives. It proposes aiming for 200 ms and keeping total page rendering under 500 ms, while noting that this alone does not guarantee a good LCP score.
Grab's Coban platform runs Golang-based stream processing pipelines on Kubernetes, servicing roughly 400 billion events weekly from Kafka. The initial Horizontal Pod Autoscaler setup caused resource waste and uneven load distribution across Kafka partitions during scale-in and scale-out events. To resolve this, Grab moved to a fixed pod count matching the topic's partition count and adopted Vertical Pod Autoscaling, reducing resource usage versus requests by approximately 45%. The team also introduced Kubernetes priority classes to segment latency-sensitive workloads onto On-Demand nodes and non-critical jobs onto Spot instances. Additionally, overprovisioning via low-priority placeholder pods managed by Cluster Proportional Autoscaler enabled rapid pod rescheduling and reduced deployment delays.
Shopify needed product visuals on more than 35 localized domains to stay accurate as features, currencies, languages, and product UI changed. An SVG experiment made translated text difficult to manage because SVG lacks word wrapping, while export settings, effects such as Gaussian blur, and repeated translation hooks created maintenance and performance problems. The replacement represented interfaces in HTML and JavaScript through ScaleContentAsImage, which wraps fixed-width content, computes available space, applies a CSS transform scale, preserves layout with a spacer, absolutely positions the transformed element, and updates calculations on resize. The team concluded HTML/JavaScript was more maintainable and flexible for design, documentation, animations, and localization, while noting remaining work around lazy-loaded images, reusable-visual documentation, and future CSS Houdini possibilities.
Seven months into development, Supabase announced a series of platform updates across authentication, database tooling, and client libraries. The release introduced OAuth logins supporting Bitbucket, GitHub, GitLab, and Google, alongside table cloning and one-click Postgres extension management. In the SQL editor, users can now save favorite queries and access locally stored query histories directly within the browser. The web dashboard adopted Next.js automatic static optimization for improved responsiveness, while postgrest-js migrated to TypeScript and an isomorphic gotrue-js TypeScript library was built for Netlify GoTrue integration. Supabase is prioritizing a transition from Alpha to Beta by tracking open-source tool performance in a dedicated benchmarks repository.
The post presents object-allocation profiling as a way to find Ruby performance hotspots, including code inside libraries such as Active Record. It uses memory_profiler and derailed_benchmarks to group allocations by gem, file, and source location, then examines whether each allocation can be removed or avoided. A benchmark compares a direct maximum comparison with an array-based version: the array allocation makes the latter 2.04x slower in the reported run. One optimization for cache_version reuses a raw database timestamp string when it is safe, checking its type, format, timezone, and provenance before deleting separators and padding PostgreSQL-truncated values. This change reduces allocation from 743,842 bytes and 6,626 objects to 702,955 bytes and 6,063 objects, and the post reports up to 1.12x faster; combined optimizations reach 1.23x overall.
Full dense layers in neural networks are often unnecessarily large and can be pruned without sacrificing precision, but available sparse algebra tools and PyTorch native implementations lack efficiency. To resolve this issue, the pytorch_block_sparse extension introduces BlockSparseLinear as a drop-in replacement for standard linear layers alongside BlockSparseModelPatcher for on-the-fly model modifications. The library uses NVIDIA CUTLASS C++ CUDA templates derived from Yulhwa Kim's cutlass tilesparse proof of concept. Although baseline sparse operations remain roughly twice as slow as cuBLAS-optimized dense counterparts, performance scales with sparsity, making a 75% sparse matrix approximately two times faster than a dense layer while reducing memory consumption by four times. Future updates will target dynamic sparsity optimization and NVIDIA Ampere Tensor Core primitives.
Grab experienced replica CPU usage spikes following service deployments in their master/replica Redis cluster, which caused failovers to spike to 100% CPU. Investigation revealed that a post-deployment Lua monitor script executed separately on both nodes and relied on non-deterministic HGETALL key ordering. Redis encodes hash objects as either ziplists or hashtables, and restoring from an RDB snapshot initializes small hashes as ziplists even if the master previously converted them to hashtables. This encoding discrepancy caused key ordering to diverge, preventing secondary data from deleting correctly and bloating dataset sizes. Grab resolved the issue by sorting the outputs of HKEYS and HGETALL within the Lua script to guarantee deterministic execution across nodes.
Shopify’s merchant admin UI grew from a Ruby on Rails ERB-based front-end into a TypeScript, React, and GraphQL codebase, and its size eventually made VSCode’s TypeScript language tooling take roughly two to three minutes to initialize. The team investigated the bottleneck with TypeScript’s performance diagnostics, VSCode TSServer logs, and support from the TypeScript team, which recommended splitting the monolithic configuration with project references. They built the TypeTrack VSCode plugin to measure initialization time, then migrated dependency-graph leaf nodes such as packages and tests, creating project-level tsconfig.json files and references incrementally. The migration reduced initialization times for sampled files from about 155 seconds to 8–13 seconds. The post explains how to resolve missing module errors, respect project-reference restrictions, and continue upward through the dependency graph while distributing migration work across teams.
A customer support ticket exposed poor performance in clock_gettime(3) and gettimeofday(2) for an application making many timing calls through transaction tracing. Heroku's Runtime Infrastructure team found that Linux was selecting the Xen clocksource, whose Xen version did not support virtual dynamic shared object (vDSO) acceleration, forcing costly userspace-to-kernel context switches. The team evaluated available clocksources and selected tsc, which uses the Time Stamp Counter and supports vDSO; they assessed concerns about backwards clock drift, including older CPU inconsistencies and Xen VM freezing, against their newer Intel CPUs and EC2 environment. After vdsotest validation, the configuration was deployed across the Common Runtime and Private Spaces dyno fleet, and the initiating customer plus other customers observed performance improvements.
Standard transformer models hit memory bottlenecks on long sequence modeling tasks due to the quadratic asymptotic memory complexity of global self-attention and oversized positional embedding matrices. The Reformer architecture overcomes these constraints to train sequences of up to half a million tokens using under 8GB of RAM. It re-engineers transformer operations using local and Locality Sensitive Hashing self-attention, chunked feed forward layers, reversible residual layers, and axial positional encodings. In empirical benchmarks using google/reformer-crime-and-punishment, axial positional encodings reduce the model parameter count from over 136 million to approximately 2.58 million by factorizing the positional dimensions. This architectural change cuts inference memory consumption from 959 MB down to 447 MB for evaluated benchmark workloads.
Reanimated 2 is presented as a new approach to building gestures and animations in React Native, replacing the declarative domain-specific language of Reanimated 1 with animation worklets. Worklets are JavaScript functions declared with the “worklet” directive that execute independently on the UI thread, can receive parameters, access JavaScript-thread constants, call other worklets synchronously, and invoke JavaScript-thread functions asynchronously. The API introduces five hooks for creating shared and derived values, handling gesture events, and assigning animated styles or properties; a drag example combines shared values, gesture context, and velocity-based decay. The article also describes a liquid-swipe example using bezier interpolation, gesture handling, and physics-based animation, and reports that the new design lowers the entry barrier, supports cases previously requiring the bridge, and improves initialization performance.
Shopify’s monolithic Ruby repository has more than 150,000 tests, grows 20–30% annually, and takes 30–40 minutes to run across hundreds of Docker containers, making required full-suite CI costly and vulnerable to intermittent failures. The team built a dynamic-analysis test-selection system that logs method calls during each test, records files in each call graph, and maps changed files to relevant tests. Because Ruby, Rails metaprogramming, and non-Ruby files complicate tracing, the system adds Rails patches and fallback rules, runs extra tests when mappings lag, and executes the full suite asynchronously on every deploy. After two months and 8,360 merged commits, it achieved 99.94% failure recall, selected about 60% of tests, and reduced compute time by roughly 25%. Developers requested full-suite runs on fewer than 2% of pull requests.
Performance regressions can accumulate in a large monolithic Rails application, making it difficult to identify offending changes among thousands of daily commits. The post presents profiling and benchmarking as complementary practices: profiling locates runtime bottlenecks, while benchmarking compares code paths and validates fixes. It covers elapsed time, CPU versus wall time, object allocations, TracePoint and ObjectSpace, plus rbspy, stackprof, rack-mini-profiler, and App Profiler, which supports on-demand remote production profiling at Shopify. A flamegraph example showed garbage collection consuming about 35% of CPU time in a slow request, and the team inferred excessive Ruby object allocation; a Rails benchmark showed roughly 50x improvement from caching an order’s total price calculation. The discussion cautions against micro-optimizations whose gains do not justify code changes and recommends addressing larger performance issues first.
Rapid advances in software have expanded both what applications can do and what developers must understand, from efficient code to integration, security, and user experience. As tools make polished interfaces easier to build, engineers are expected to understand users, design sensibilities, system behavior, and constraints such as memory management and CPU load. The post recommends maintaining broad awareness of changing technologies while prioritizing learning around problems actually encountered; Postgres performance issues may warrant understanding traffic and write effects without exhaustive tuning. It cautions against adopting every new framework or database on reputation alone, using MemSQL as an example, and concludes that developers should evaluate trade-offs carefully, build expertise in the tools they operate, and focus on shipping meaningful product work.
The post examines how TruffleRuby can optimize Ruby’s ||= operator when it is used for lazy initialization rather than repeated assignment. Static profiling of 20 popular open-source projects found 2,082 uses, with 64% meeting conservative criteria based on constant values or naming patterns for parameterless methods assigning instance or class variables. The implementation replaces the usual OrNode with an OrLazyValueDefinedNode, which counts executions of the right-hand side and deoptimizes when it is executed fewer than twice, allowing uncommon assignment paths to remain in the interpreter. In a benchmark, the change compiled code about 6% faster and produced about 63% less machine code by memory, although the post notes that benchmarking larger projects is noisy and the runtime impact is difficult to prove.
Parallel test execution in Xcode can suffer from test time imbalance when tasks finish at significantly different times across parallel simulator workers. Analysis of Xcode scheduling logs shows that the runner groups tests by test class and dispatches all tests from the same class to a single simulator. Attempts to customize the suite by swizzling XCTestSuite fail because made-up suites initialize only after tests are dispatched. To overcome this grouping constraint, unique tokens or test names are appended to the class name component in `-only-testing` command-line arguments. This trick forces Xcode to treat each test as an independent class, successfully distributing individual tests across separate workers.
Android Vitals data revealed that 15.7% of Grab users had less than 1GB of free device storage and uninstalled the app at 1.2 times the normal rate. To understand on-device storage consumption, the team instrumented session launches using the Android StorageManager API to collect binary size, cache folder size, and total footprint metrics. Analysis showed unusually large cache sizes driven by orphaned cache folders from discontinued third-party libraries, including an image library replacement of Picasso by Glide. An automated cleanup routine deployed in app updates purged legacy cache directories upon launch. This mechanism reclaimed 575 terabytes of junk data across more than 13 million devices, averaging 40MB per user.
Turboku is a migration path that automatically turns Heroku web dynos into Fly applications, addressing how existing Heroku apps can move to Fly’s globally distributed edge network. Fly routes requests to the closest datacenter through one global IP address, or two with IPv6, while TLS terminates closer to users and modern ECDSA certificates are automatic for Fly domains. A benchmark around the world used an existing application to compare Heroku and Fly connection stages, full requests, and cached requests. Fly reduced DNS, TCP, TLS, network, and full-request times, with the largest reported improvement appearing when caching was used: 180.16 ms versus Heroku’s 817.75 ms, a 77.91% reduction; uncached full requests fell 35.39%, while TTFB was 1.24% higher.
The best engineering reads, once a week.