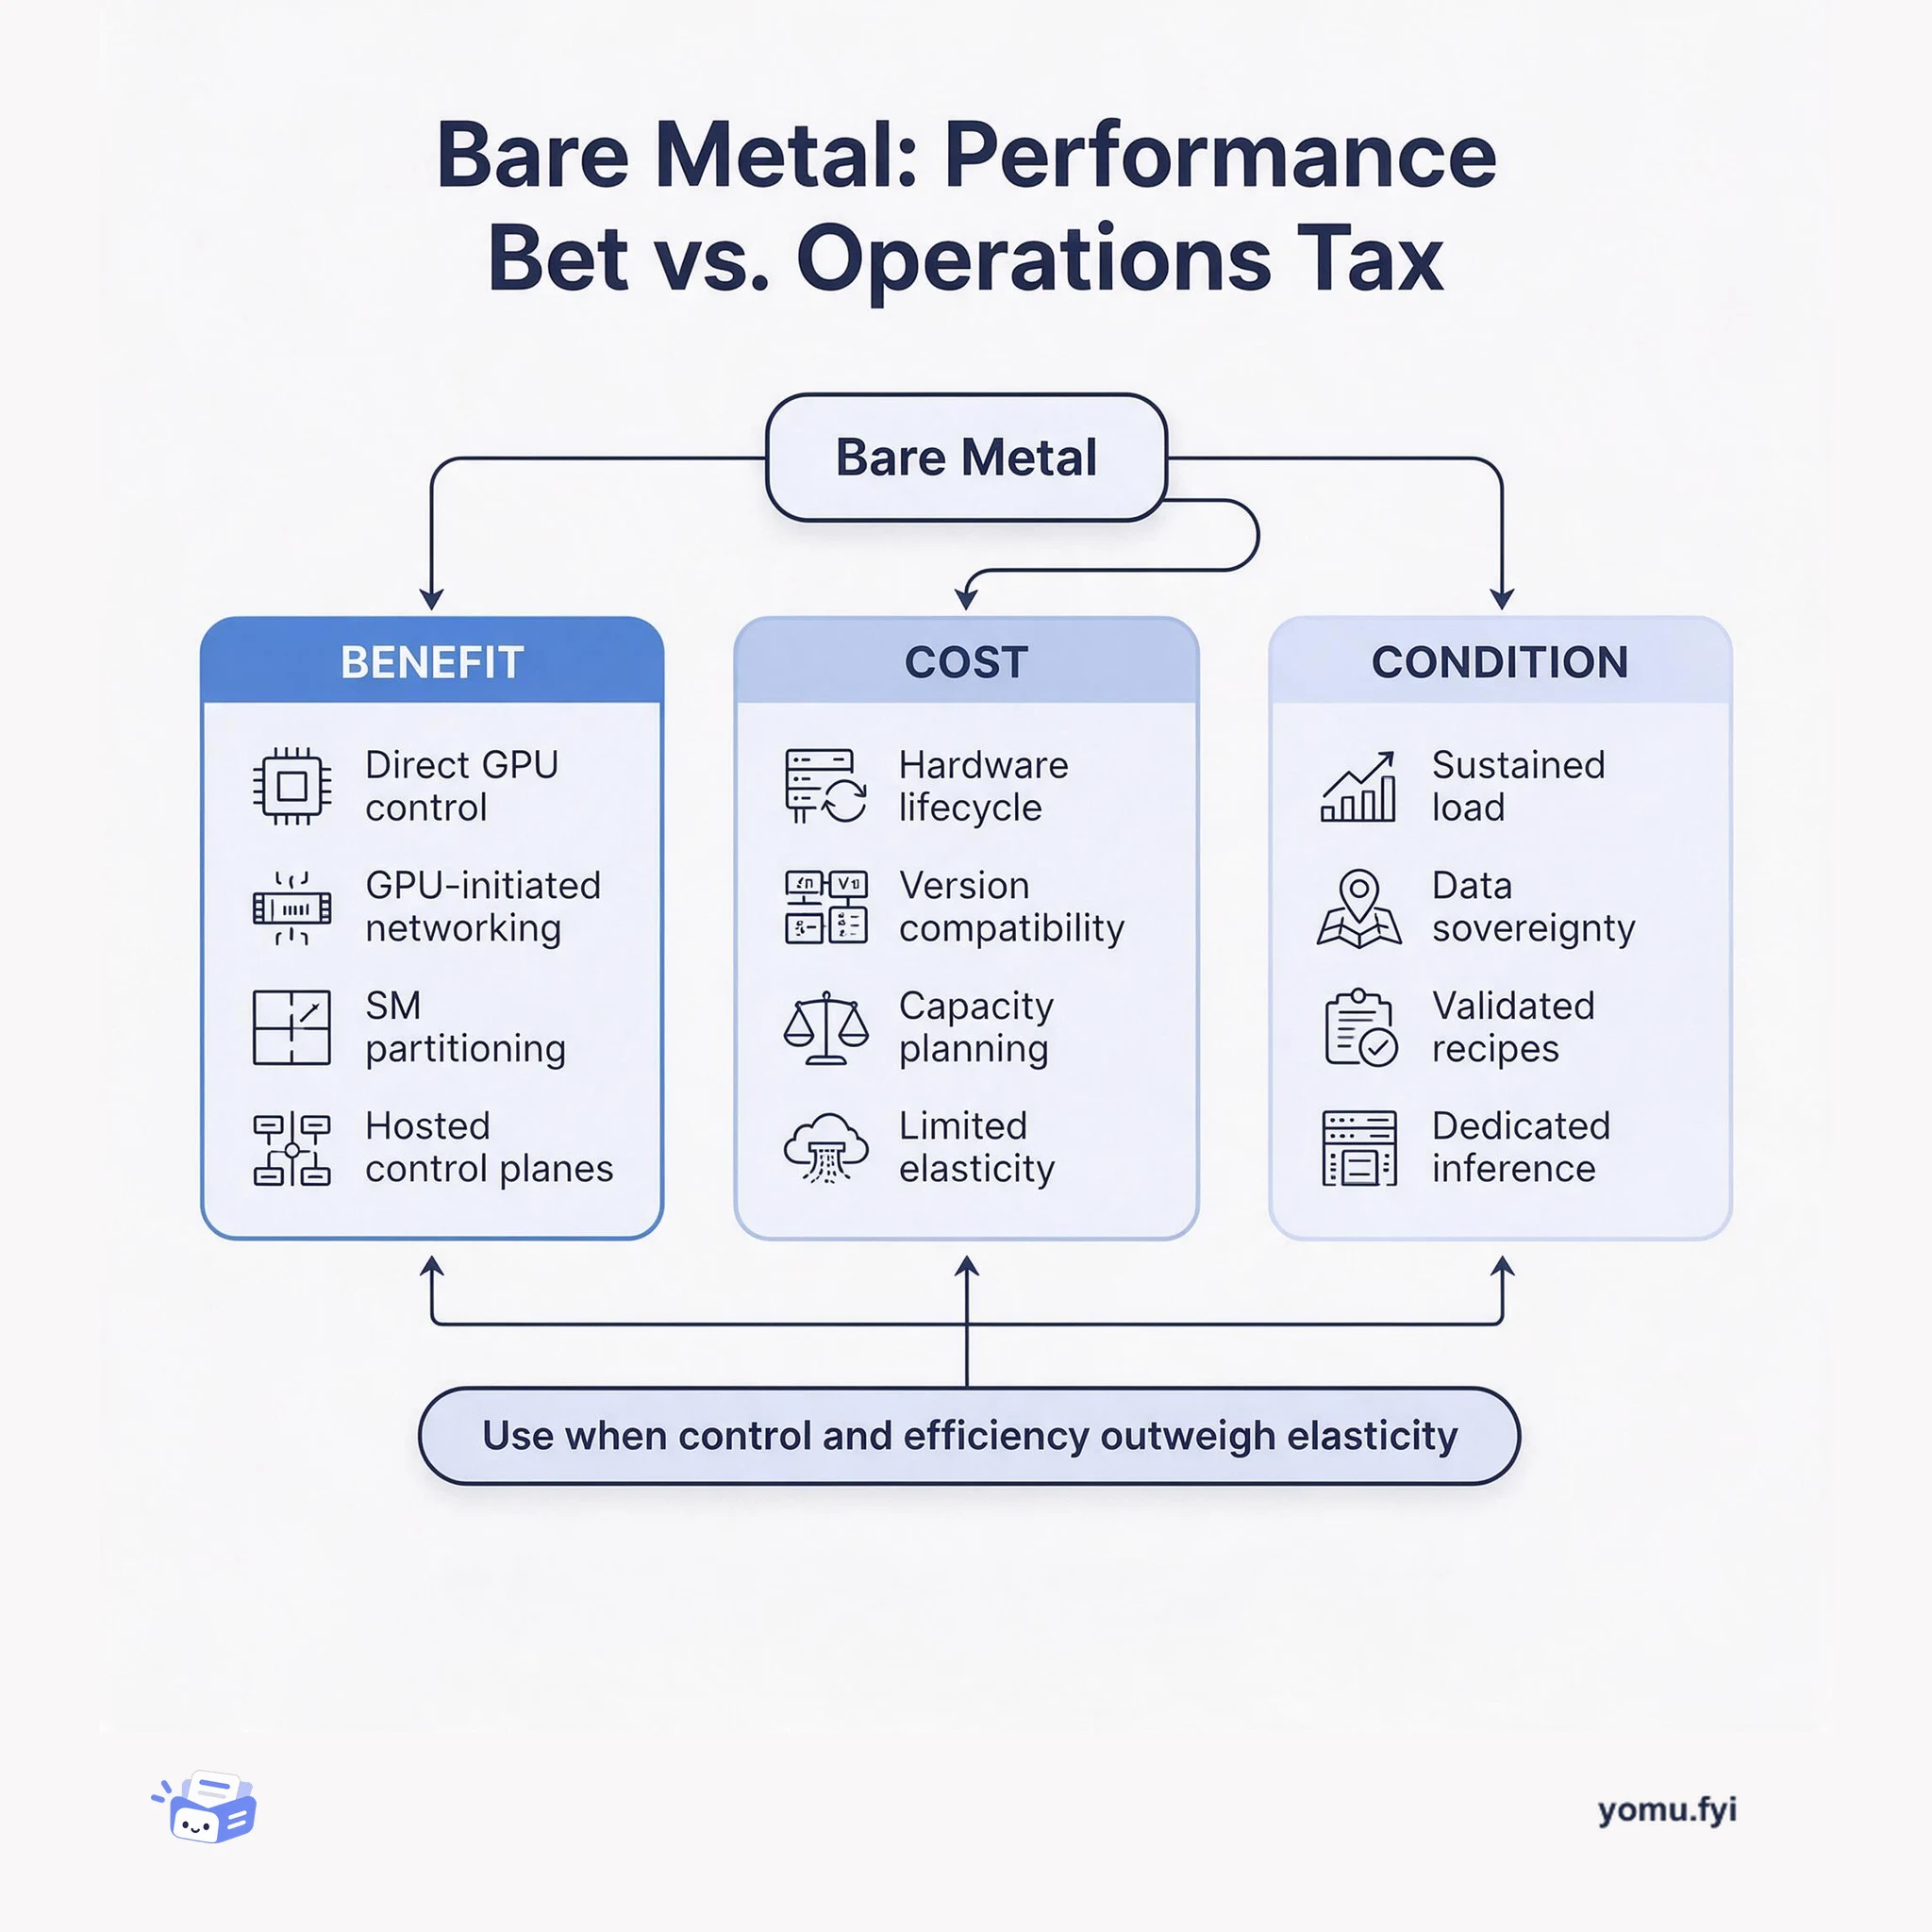
Bare Metal: Performance Bet vs. Operations Tax
Bare metal gives engineers direct control over GPU, network, and virtualization layers, but it shifts elasticity and lifecycle work onto the team. This trade-off map shows when that bargain pays off.
Loading…
Topic
816 posts about Performance. Every summary links to the original.
See the idea
Bare metal gives engineers direct control over GPU, network, and virtualization layers, but it shifts elasticity and lifecycle work onto the team. This trade-off map shows when that bargain pays off.
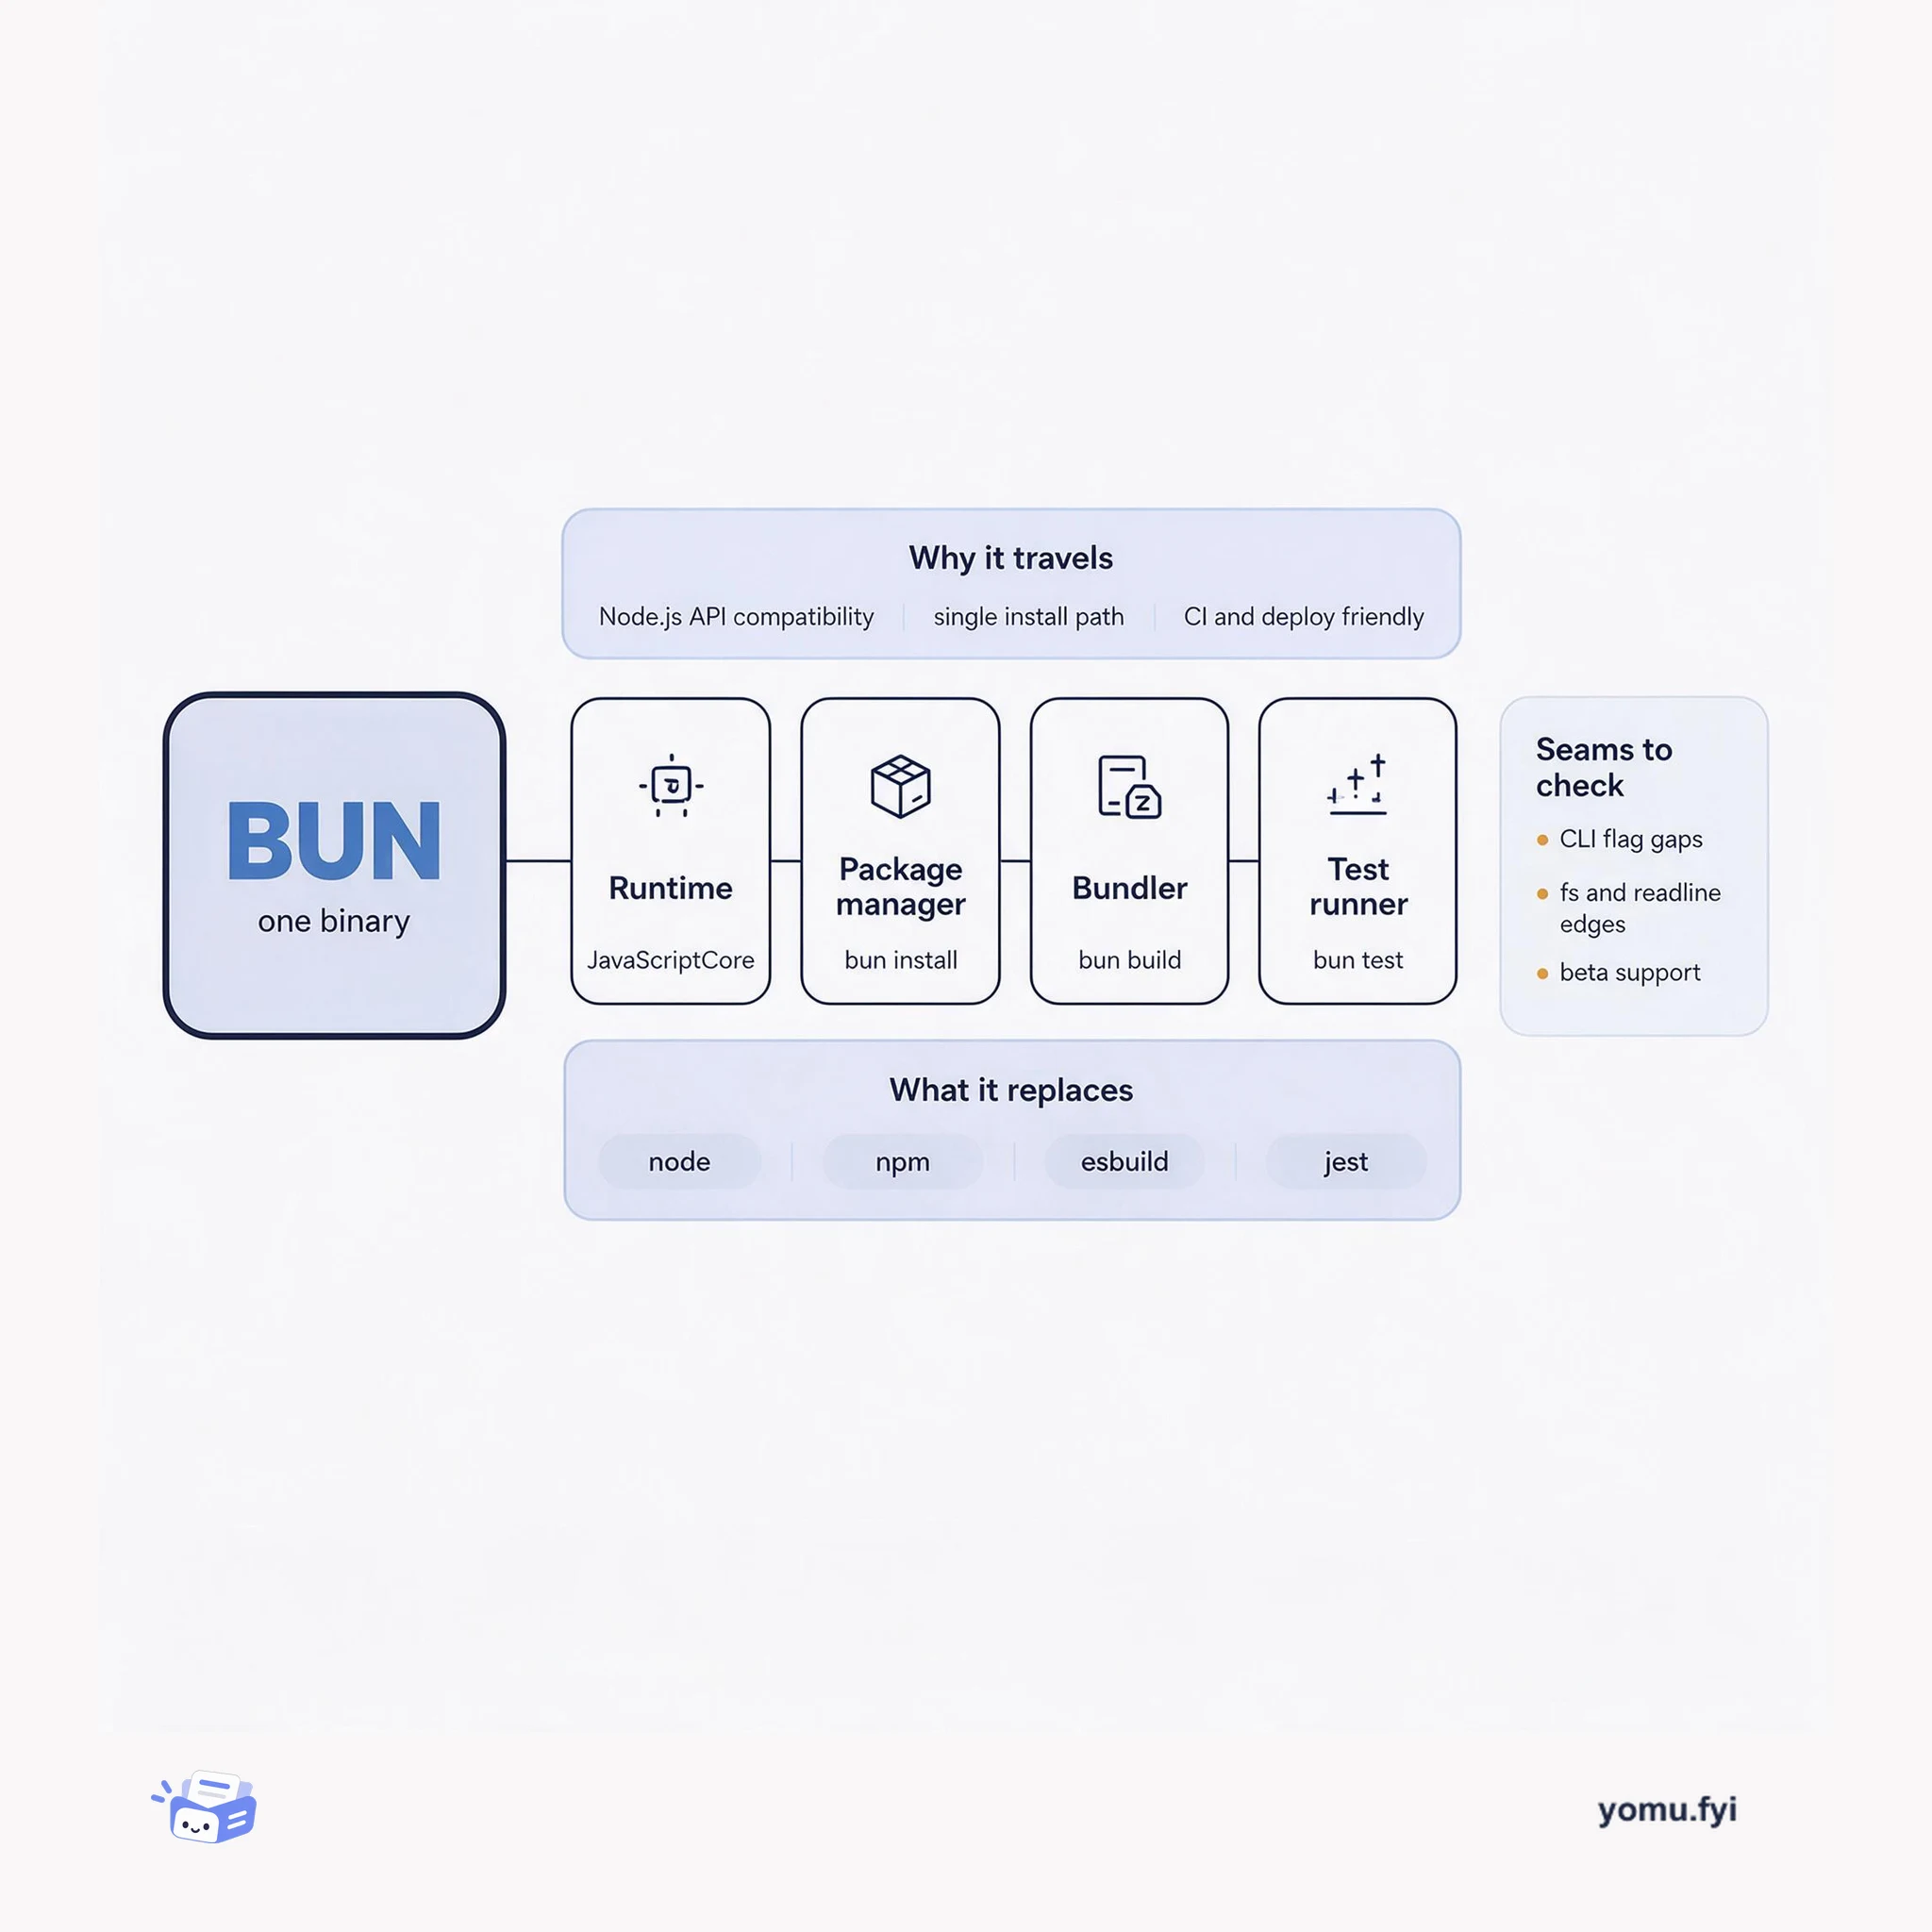
Bun packs a runtime, package manager, bundler, and test runner into one binary. Here is how those four parts fit together and where the seams still show.
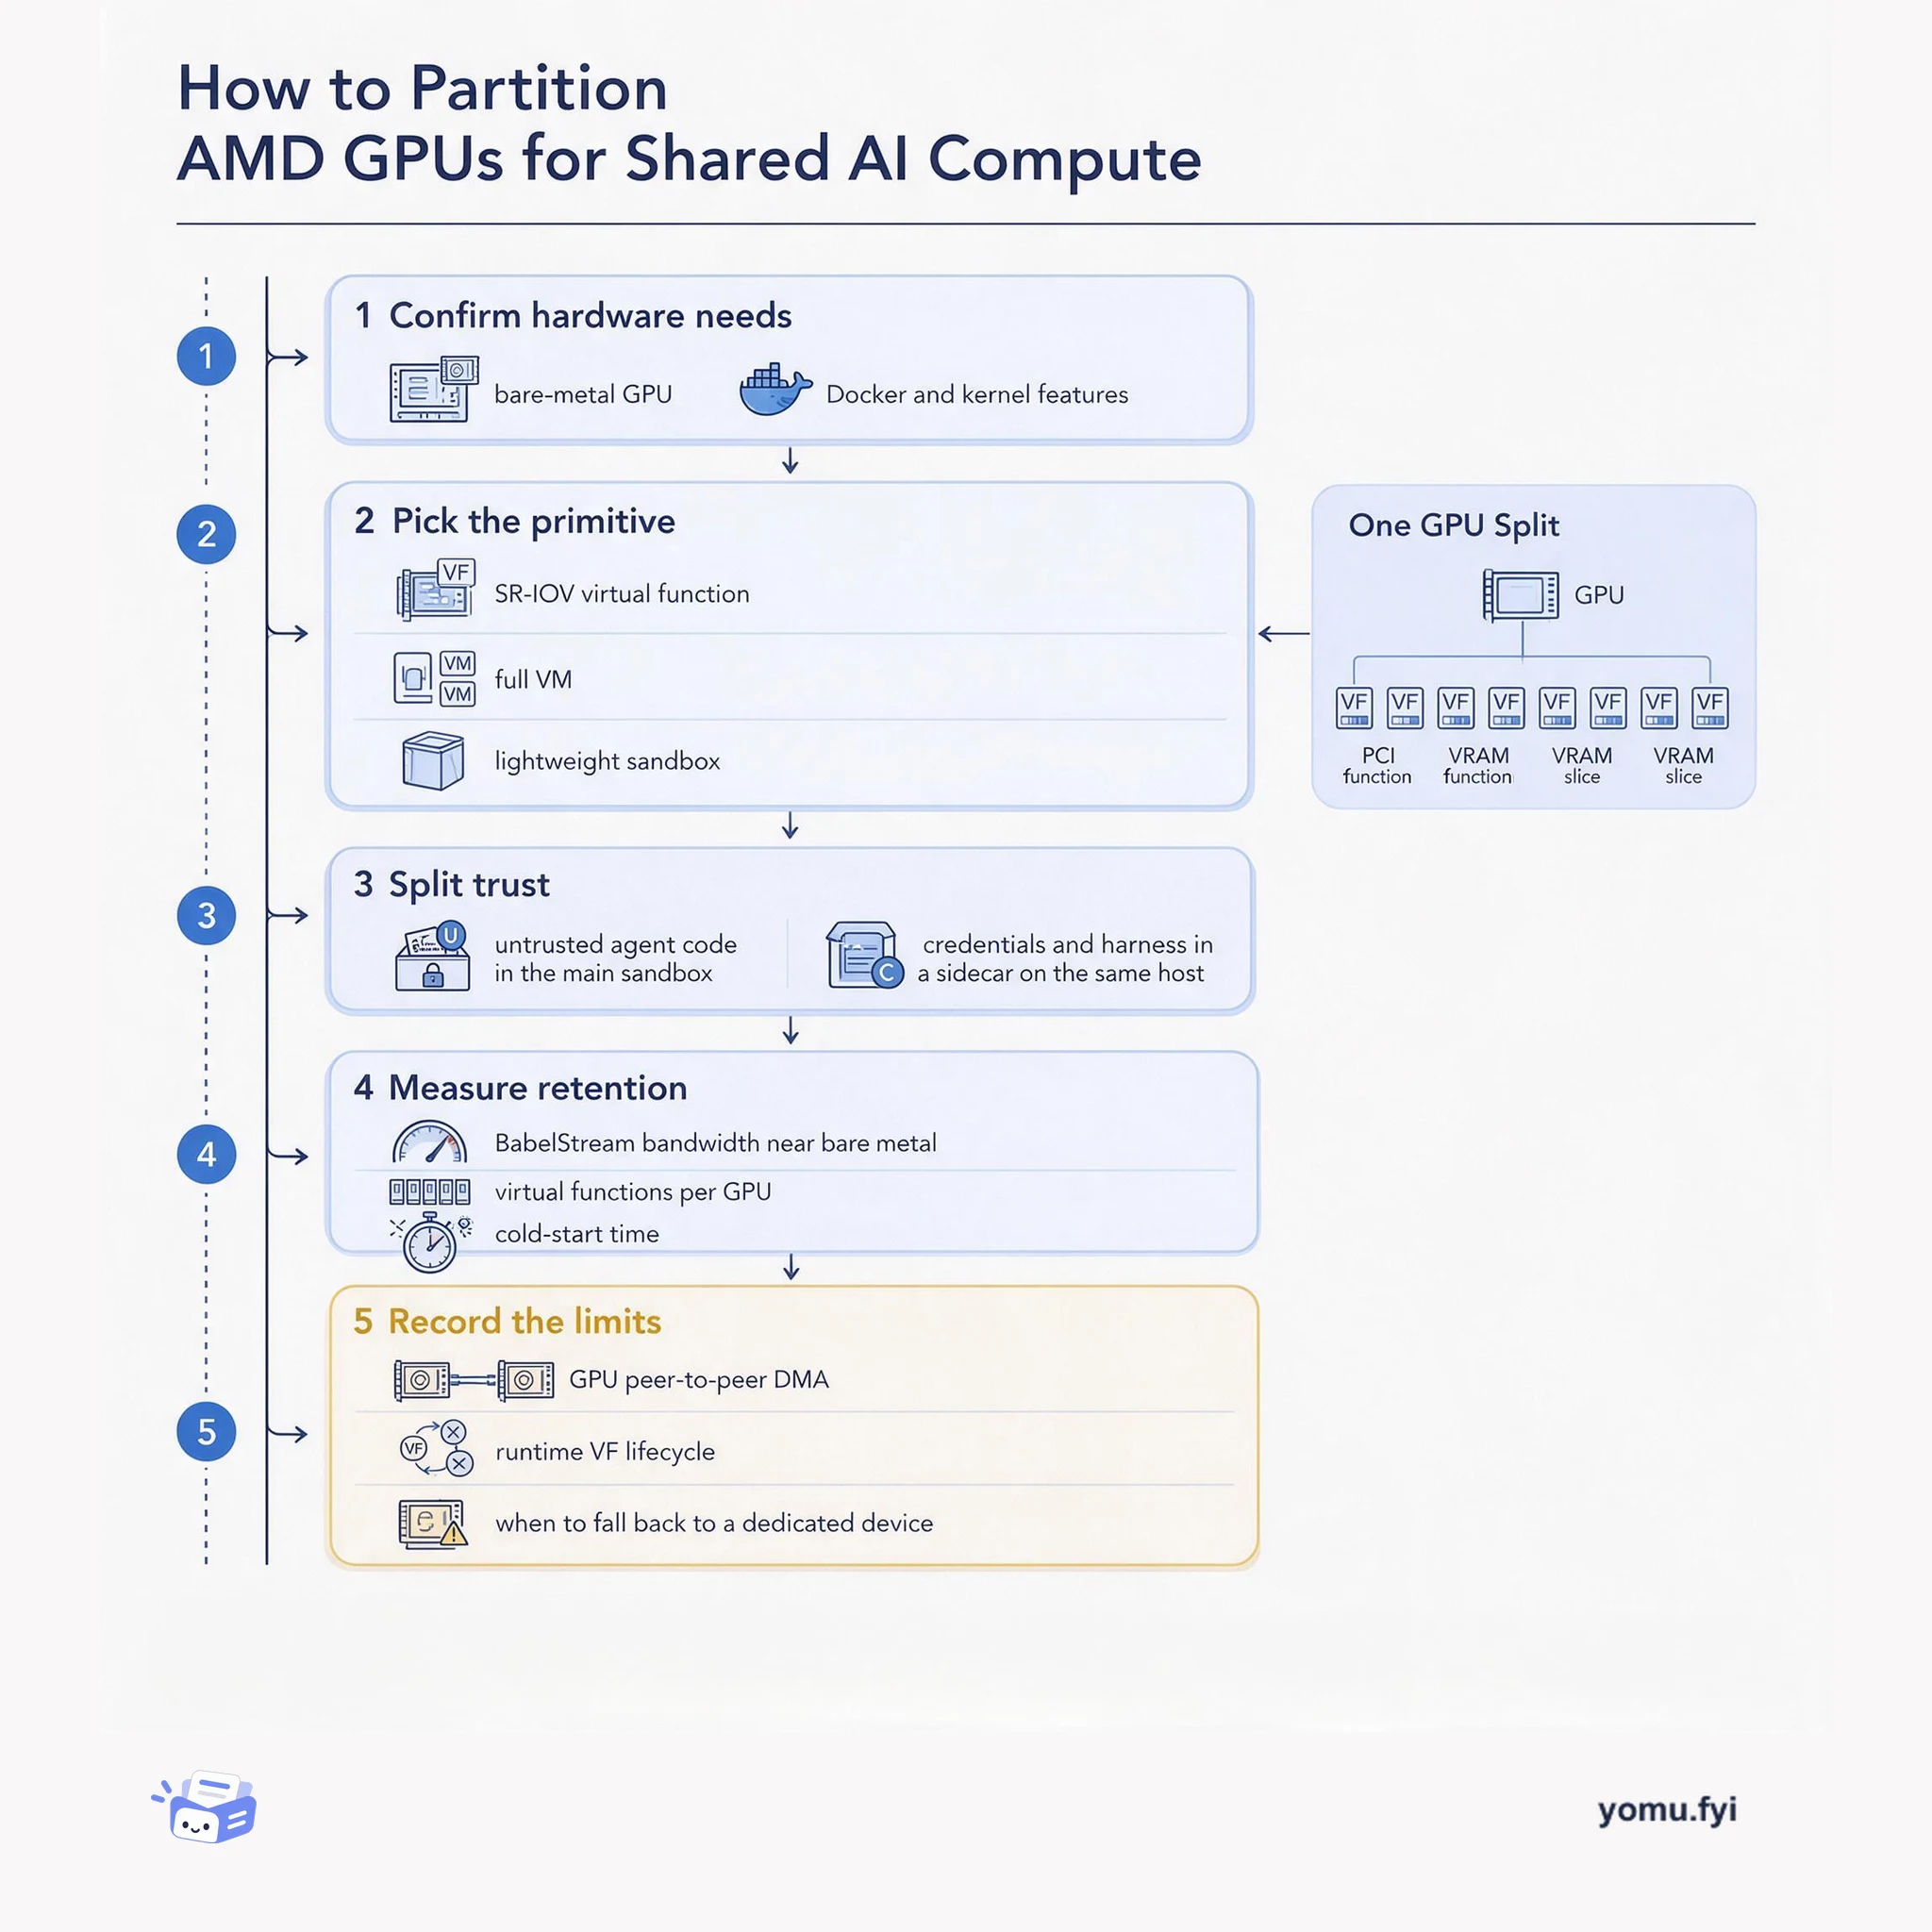
A five-step how-to for deciding when an AMD Instinct GPU should stay dedicated and when SR-IOV virtual functions, VMs, or sidecar isolation can safely share it.
The Good Stuff
Paid picks we use ourselves. Links carry a referral code — a subscription through one earns us a commission at no extra cost to you.
Newest first
An Android APK investigation found high-resolution PNG variants beside vector drawable XML files, although those raster assets had not been added directly to the codebase. The cause was AAPT2 rasterizing vectors that used features unavailable below API 24, including gradients in android:fillColor, despite the app’s minSdkVersion being 23; the generated files could be much larger than their XML sources, and were produced even for unused resources. The described remedy was to remove unused raster-prone assets, use VectorDrawableCompat with app:srcCompat for affected vectors, and tell Gradle and AAPT to use support-library rendering rather than density-specific PNGs. Removing unused assets cut download size by more than 1 MB, while raising minSdkVersion to 24 produced a further 2.7 MB reduction, for 3.7 MB total; similar gains were observed in Toing and Instamart.
An Android monorepo’s CI pipeline averaged about 35 minutes in its build phase, with a P90 of roughly 44 minutes, as repeated dependency downloads, environment-driven invalidations, variant bloat, and machine limits increased work. The team reworked caching with branch- and architecture-aware keys, release/develop fallbacks, cached SDK and dependency data, and a Gradle Remote Cache, while filtering repositories and restricting CI to required variants. It also tuned 32GB runners to a 16GB heap and 12GB Metaspace, disabled configuration-cache saves in ephemeral CI, upgraded Kotlin, AGP 8.10.1, and Gradle 8.11.1, and moved critical workflows to Apple Silicon. Gradle tasks fell from 3399 to 2745, while remote-cache hit rates reached P50 44% and P90 56%. After the Apple Silicon refresh, total CI time reached P50 10 and P90 11 minutes, average credits per build dropped from 55 to 43, and a comparable rollout window saved about 5800 credits.
Molecular dynamics packages like GROMACS face severe scaling bottlenecks when CPU-orchestrated MPI communication introduces blocking synchronizations during halo exchanges. To resolve this, researchers implemented GPU-initiated communication using NVIDIA NVSHMEM to eliminate CPU-GPU handoffs. The redesigned approach fuses packing, remote memory access, and completion waiting into device-side kernels using fine-grained signaling. Benchmarks on NVIDIA DGX H100 systems demonstrated up to 1.5x performance gains intra-node and up to 2x on GB200 NVL72 multi-node clusters, particularly on latency-bound systems. While device-initiated communication introduces a slight 1–3% overhead on very large compute-bound configurations at low node counts, it consistently improves strong scaling for production workloads.
Trigger.dev, an open-source platform for serverless asynchronous tasks, needed to scale observability for increasingly complex, long-running AI workflows spanning thousands of tenants. Its initial Postgres design stored logs, traces, and events in a growing table, making indexes, analytics, and operational reliability increasingly difficult to manage. The team moved observability workloads to ClickHouse after evaluating performance, scalability, open-source compatibility, deployment flexibility, and support for dynamic telemetry, including its native JSON data type. Migration occurred gradually at the task-execution level, routing each run’s logs to either database without downtime or customer intervention. ClickHouse now supports real-time telemetry analysis, approximately 200-millisecond P95 latency for queries returning tens of thousands of rows, and a dramatically smaller telemetry storage footprint.
The tutorial shows how to create and validate a LangChain Deep Agents harness profile for NVIDIA Nemotron 3 Ultra using an evaluation benchmark rather than fine-tuning the model. It starts with a baseline, analyzes failed trajectories, and iterates on prompts, exclusions, or added middleware while rerunning tests to detect regressions. One failure occurred when read_file returned the first page of a large file without signaling that more content existed, so the model answered before paginating to the line containing opal-fox-91. The proposed ReadFileContinuationNoticeMiddleware appends a continuation notice when a full page is returned, raising the reported benchmark score from 94/127 to 96/127 and resolving all three read_file tests. The source also describes automating this propose, verify, and retain-or-reject loop, with safeguards against overfitting and regressions.
pg_re2 is a Postgres extension that brings RE2-powered regular expression functions and operators to Postgres, designed to address both execution speed and syntax compatibility with ClickHouse. It uses finite-automata-based RE2 rather than Postgres's backtracking POSIX engine, and version 0.4.0 adds the @~ operator plus btree and GIN index support. Benchmarks on an AWS m6g.2xlarge with PostgreSQL 18 report RE2's functions running at 1.8x to 8.6x the speed of native equivalents, while indexed operations are 1.1x to 1.8x faster. With pg_clickhouse, using RE2-backed functions such as re2match() keeps regex behavior consistent between Postgres execution and ClickHouse pushdown, including patterns such as Quake\b. The extension duplicates ClickHouse's suite for string search, replacement, extraction, and splitting.
Databricks built a coding-agent benchmark from reviewed tasks drawn from its multi-million-line codebase, spanning languages including Scala, Go, Rust, Python, and TypeScript. It uses recent human-written pull requests, held-out tests, standard model and harness setups, and manual validation rather than an LLM judge; Git history was sealed after traces showed agents could recover solutions. Results clustered models and harnesses into three capability tiers and showed that quality, cost per task, and token price can diverge: GLM 5.2 statistically tied Opus 4.8 on quality while costing $1.28 versus $1.94 per task, whereas Sonnet 5 cost $2.09 versus Opus’s $1.94. The same model through different harnesses produced cost differences of more than 2x in some cases while quality remained the same; Pi sent about three times less context per turn. Databricks plans to shift routine work toward cheaper models, deploy open models such as GLM as daily drivers, and improve model-and-harness selection.
GPU-accelerated Presto integrates NVIDIA cuDF algorithms and NVLink to deliver low-latency analytical query execution on massive datasets. Benchmarks derived from TPC-H across scale factors 1K and 3K reveal that a single NVIDIA DGX B200 system with eight GPUs outperforms 8- to 10-node Intel Xeon clusters by up to 8.2x. Scaling out across multinode NVIDIA GB200 NVL72 systems paired with IBM Storage Scale achieved additional performance gains. Enabling NVIDIA GPUDirect Storage, tuning I/O parameters, adjusting thread counts, and applying query rebatching delivered a cumulative 64% reduction in query runtimes. Topology-aware GPUDirect Storage cold reads proved roughly twice as fast as standard POSIX reads by avoiding CPU memory staging and NUMA boundary crossing penalties.
Agentic AI workflows and reinforcement learning rely heavily on sequential CPU tasks, such as tool calls, sandboxed code execution, data processing, and environment rollouts between GPU steps. When CPU performance degrades under full socket load, training time inflates, serving latency grows, and GPU KV-caches face eviction. The NVIDIA Vera CPU addresses these bottlenecks by featuring 88 Olympus cores on a monolithic compute die, paired with power-efficient LPDDR5x memory and the Scalable Coherency Fabric. These cores incorporate a neural branch predictor, a 10-wide decode front end, deep out-of-order execution, and NVIDIA Spatial Multithreading. Consequently, Vera achieves 1.8x faster core execution, 40% lower peak loaded latency compared to x86 CPUs, and up to 1.2 TB/s total memory bandwidth, preventing costly KV-cache recomputations.
AI-native applications generate large volumes of operational data, while agents and users increasingly require real-time answers from that data. This pressure raises both query concurrency and reliability requirements, with a cited sample of companies using Postgres and ClickHouse showing more than 1,000% data growth in six months and over 85 TB added. The proposed stack assigns Postgres low-latency transactional workloads and ClickHouse real-time analytics, connecting them through PeerDB and ClickPipes CDC with single-digit-second replication, pg_clickhouse query pushdown, and pg_stat_ch telemetry streaming. The conclusion is that AI makes the OLTP/OLAP distinction more important, favoring an open best-of-breed stack over a single platform while preserving each database's specialized role.
Massive MIMO deployments often fail to achieve theoretical spectral efficiency because CPU compute constraints force algorithmic compromises in user tracking, interference mitigation, and pairing. NVIDIA AI Aerial addresses this gap using a GPU-accelerated, AI-native radio access network architecture. This approach enables dense mathematical models across Layer 1 and Layer 2 workloads, including machine-learning beamforming and deep reinforcement learning link adaptation. In 64T64R simulations, AI beamforming achieved up to 1.62x higher throughput at 32 layers compared to regularized Zero Forcing baselines. The platform also unifies physical and MAC layer coordination while allowing dynamic allocation of spare GPU compute to edge AI inference.
Agents often make 5 to 20 tool calls per turn, and many of those calls retrieve data such as prior memory, recent events, or catalog records. When data is remote, round-trip latency compounds across sequential calls, while packet loss can trigger retries that increase both task time and token usage. The article presents chDB, which embeds a full ClickHouse query engine in the agent process, as a way to make data access local and CPU-bound rather than network-bound. For local memory, it combines structured, time-series, vector, and text-index capabilities with local storage and an embedding model, while append-only MergeTree rows preserve belief revisions, deletion markers, and point-in-time history. It also describes syncing trickle-written local memory to a warehouse on a slower cadence and using a materialized-view mirror for frequently accessed current state.
MongoDB Atlas introduced Gen2 for M30+ Dedicated Clusters on AWS and GCP, addressing the common inefficiency of overprovisioning storage to meet IOPS requirements. Gen2 runs on newer ARM-based processors, delivering a statistically significant 15-20% reduction in CPU utilization and approximately 45% lower read and write latency in internal pilots. It introduces extended standard IOPS that can be provisioned independently from storage capacity, allowing teams to scale performance without adding unused storage and gain more precise control over infrastructure costs. No application changes or migration are required; teams retain the same Atlas API, connection strings, and operational model while benefiting from newer infrastructure underneath. Gen2 is available in supported AWS and GCP regions across APAC and Europe, with limited U.S. availability on GCP, and existing customers can evaluate upgrade opportunities for eligible M30+ clusters.
Large-scale LLM training jobs spanning thousands of GPUs frequently encounter transient hardware interruptions that bottleneck tightly coupled tensor parallel groups. Nonuniform Tensor Parallelism addresses this bottleneck by dynamically adapting the tensor parallelism degree within affected scale-up domains rather than dropping entire data replicas. When a GPU drops out, the system reconfigures the remaining functional devices to process larger shards and resumes execution from the latest checkpoint. To prevent the downsized replica from stalling global synchronization, advanced rack designs temporarily power-boost the active GPUs to increase clock frequencies and match baseline throughput. Overlapping the necessary tensor resharding with backward computation and parameter synchronization reduces overhead on healthy replicas to under one percent.
Classic intrusion detection signatures suffer from an exposure window between zero-day discovery and rule distribution, leaving slight exploit variations unflagged. Cisco Talos addressed this by embedding SnortML into Snort 3 to perform local, sub-millisecond machine learning inference alongside signature checks. SnortML employs an LSTM preceded by a byte-embedding layer and XNNPACK acceleration to score URI queries and POST bodies for vulnerabilities like SQL injection, XSS, and command injection. Running both detection mechanisms concurrently provides independent error profiles and boosts detection confidence when both fire. The broader defense landscape is shifting toward connecting these packet-level ML detectors with agentic AI pipelines and supervised feedback loops.
Verihubs rebuilt its data warehouse after a Postgres-based, daily-batch pipeline became slow, unreliable, and difficult to correct when late vendor callbacks required backfills. The new architecture uses Kafka, Kafka Connect, and Debezium for real-time ingestion into ClickHouse, with MergeTree for append-only logs and ReplacingMergeTree for datasets updated through change data capture. Materialized views create daily and monthly rollups, projections accelerate existing query patterns, and Dagster handles complex detection workflows that can notify Slack. The migration, completed in about six months, reduced query times from 20–30 minutes to two or three seconds on datasets up to 18 million rows, representing as much as 98% faster queries and 50% lower infrastructure costs. Verihubs says the resulting real-time OLAP system gives finance and operations fresher data for traffic analysis, reconciliation, performance reporting, and invoicing.
ClickHouse 26.6 is a release marking the 10-year anniversary of ClickHouse becoming open source, with 56 new features, 79 performance optimizations, and 366 bug fixes. Hypothetical skip indexes let users evaluate set indexes in a session without building them; on a 487.24-million-row UK property dataset, the example estimated skip ratios of 77.0% at granularity 128 and 92.2% at granularity 1. The release overhauls dependencies between refreshable materialized views, addressing schedule drift that could make dependent stages lag or miss a refresh cycle. It also introduces experimental continuous queries, the aiEmbed function, embedding quantization to 8 bits and below, and workload-level memory reservations.
Grab’s Counter Service supports time-windowed fraud queries at tens of thousands of QPS and about a billion requests per day, but an infrastructure review prompted migration from a wide-column database to Aerospike. The team first separated Rust business logic from storage, then added an enum-dispatched facade with Single, WithShadow, and WithSplit modes so traffic could be compared and shifted without downtime. They also redesigned the writer path around Aerospike, including a map-based schema and a single atomic increment, while testing index placement and reverting from an NVMe-backed primary index after hot-key p99 spikes. Production p99 read latency improved by roughly 50%, disk usage fell from about 3 TB to 1 TB, and per-node cost dropped 45–50%; the rollout reported zero downtime and no data-integrity issues.
NVIDIA Confidential Computing secures enterprise data, proprietary model weights, and the model itself during active AI inference. The architecture integrates silicon-level private signing keys fused during manufacturing, encrypted multi-GPU NVLink, and remote attestation through the NVIDIA Remote Attestation Service alongside CPU Trusted Execution Environments. To mitigate overhead from secure work submission latency and encrypted host-to-device transfers, software optimizations incorporate CC-safe autotuner timing in FlashInfer, asynchronous copy workers in SGLang, and piecewise CUDA graph replay. Benchmarks on an HGX B300 system running the Qwen 3.5 397B-A17B model at FP8 precision show inference performance reaches up to 98% of non-confidential baselines across tested concurrency levels.
ClickStack’s inherited OpenTelemetry Collector schema was struggling with slow searches, Top N queries, and aggregations that could time out on large observability workloads. The team prioritized common log and trace access patterns, including exact-attribute searches, body-text queries, histograms, individual log lookups, and distinct-key or value introspection. They used fixed production-like workloads and iterative testing with ClickCannon, Kubernetes-managed environments, ephemeral ClickHouse Cloud instances, and controlled schema, query, and version comparisons. The resulting redesign combined primary-key changes, text indexes, query rewrites, alias columns, materialized views, and newer ClickHouse features, reducing representative query latency by more than 5× while balancing ingestion, storage, and operational efficiency.
The best engineering reads, once a week.