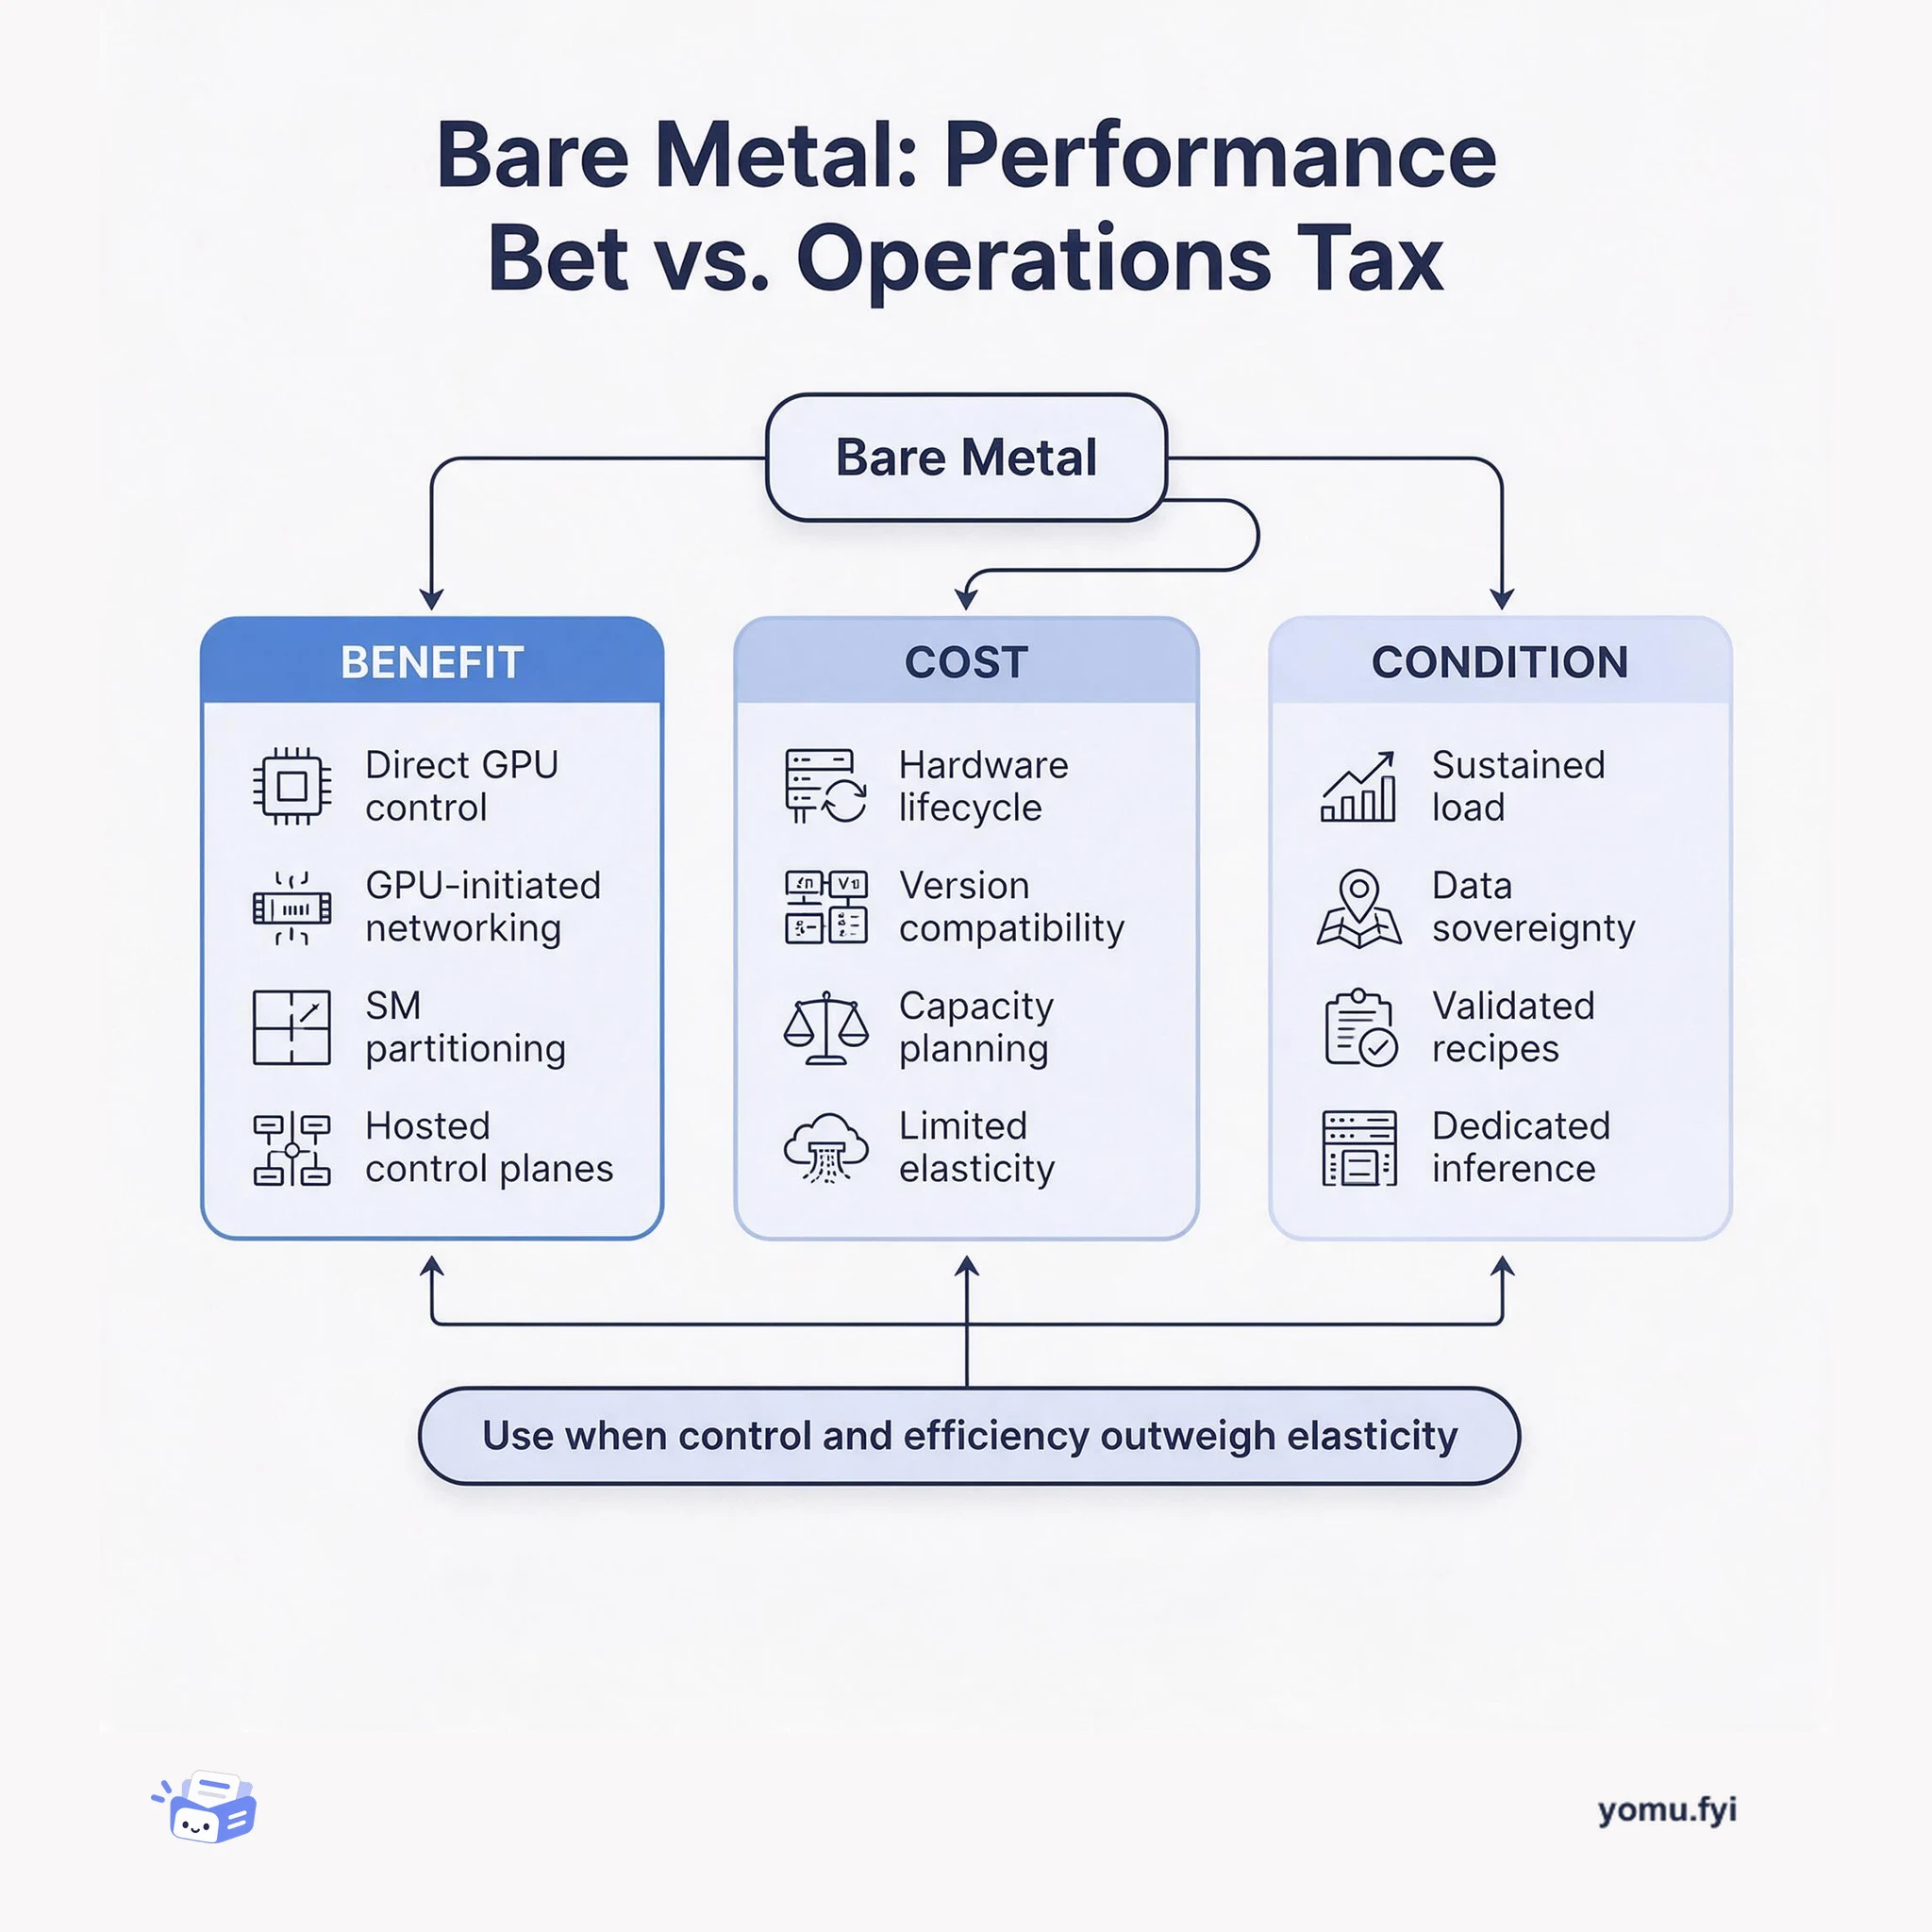
Bare Metal: Performance Bet vs. Operations Tax
Bare metal gives engineers direct control over GPU, network, and virtualization layers, but it shifts elasticity and lifecycle work onto the team. This trade-off map shows when that bargain pays off.
Loading…
Topic
812 posts about Performance. Every summary links to the original.
See the idea
Bare metal gives engineers direct control over GPU, network, and virtualization layers, but it shifts elasticity and lifecycle work onto the team. This trade-off map shows when that bargain pays off.
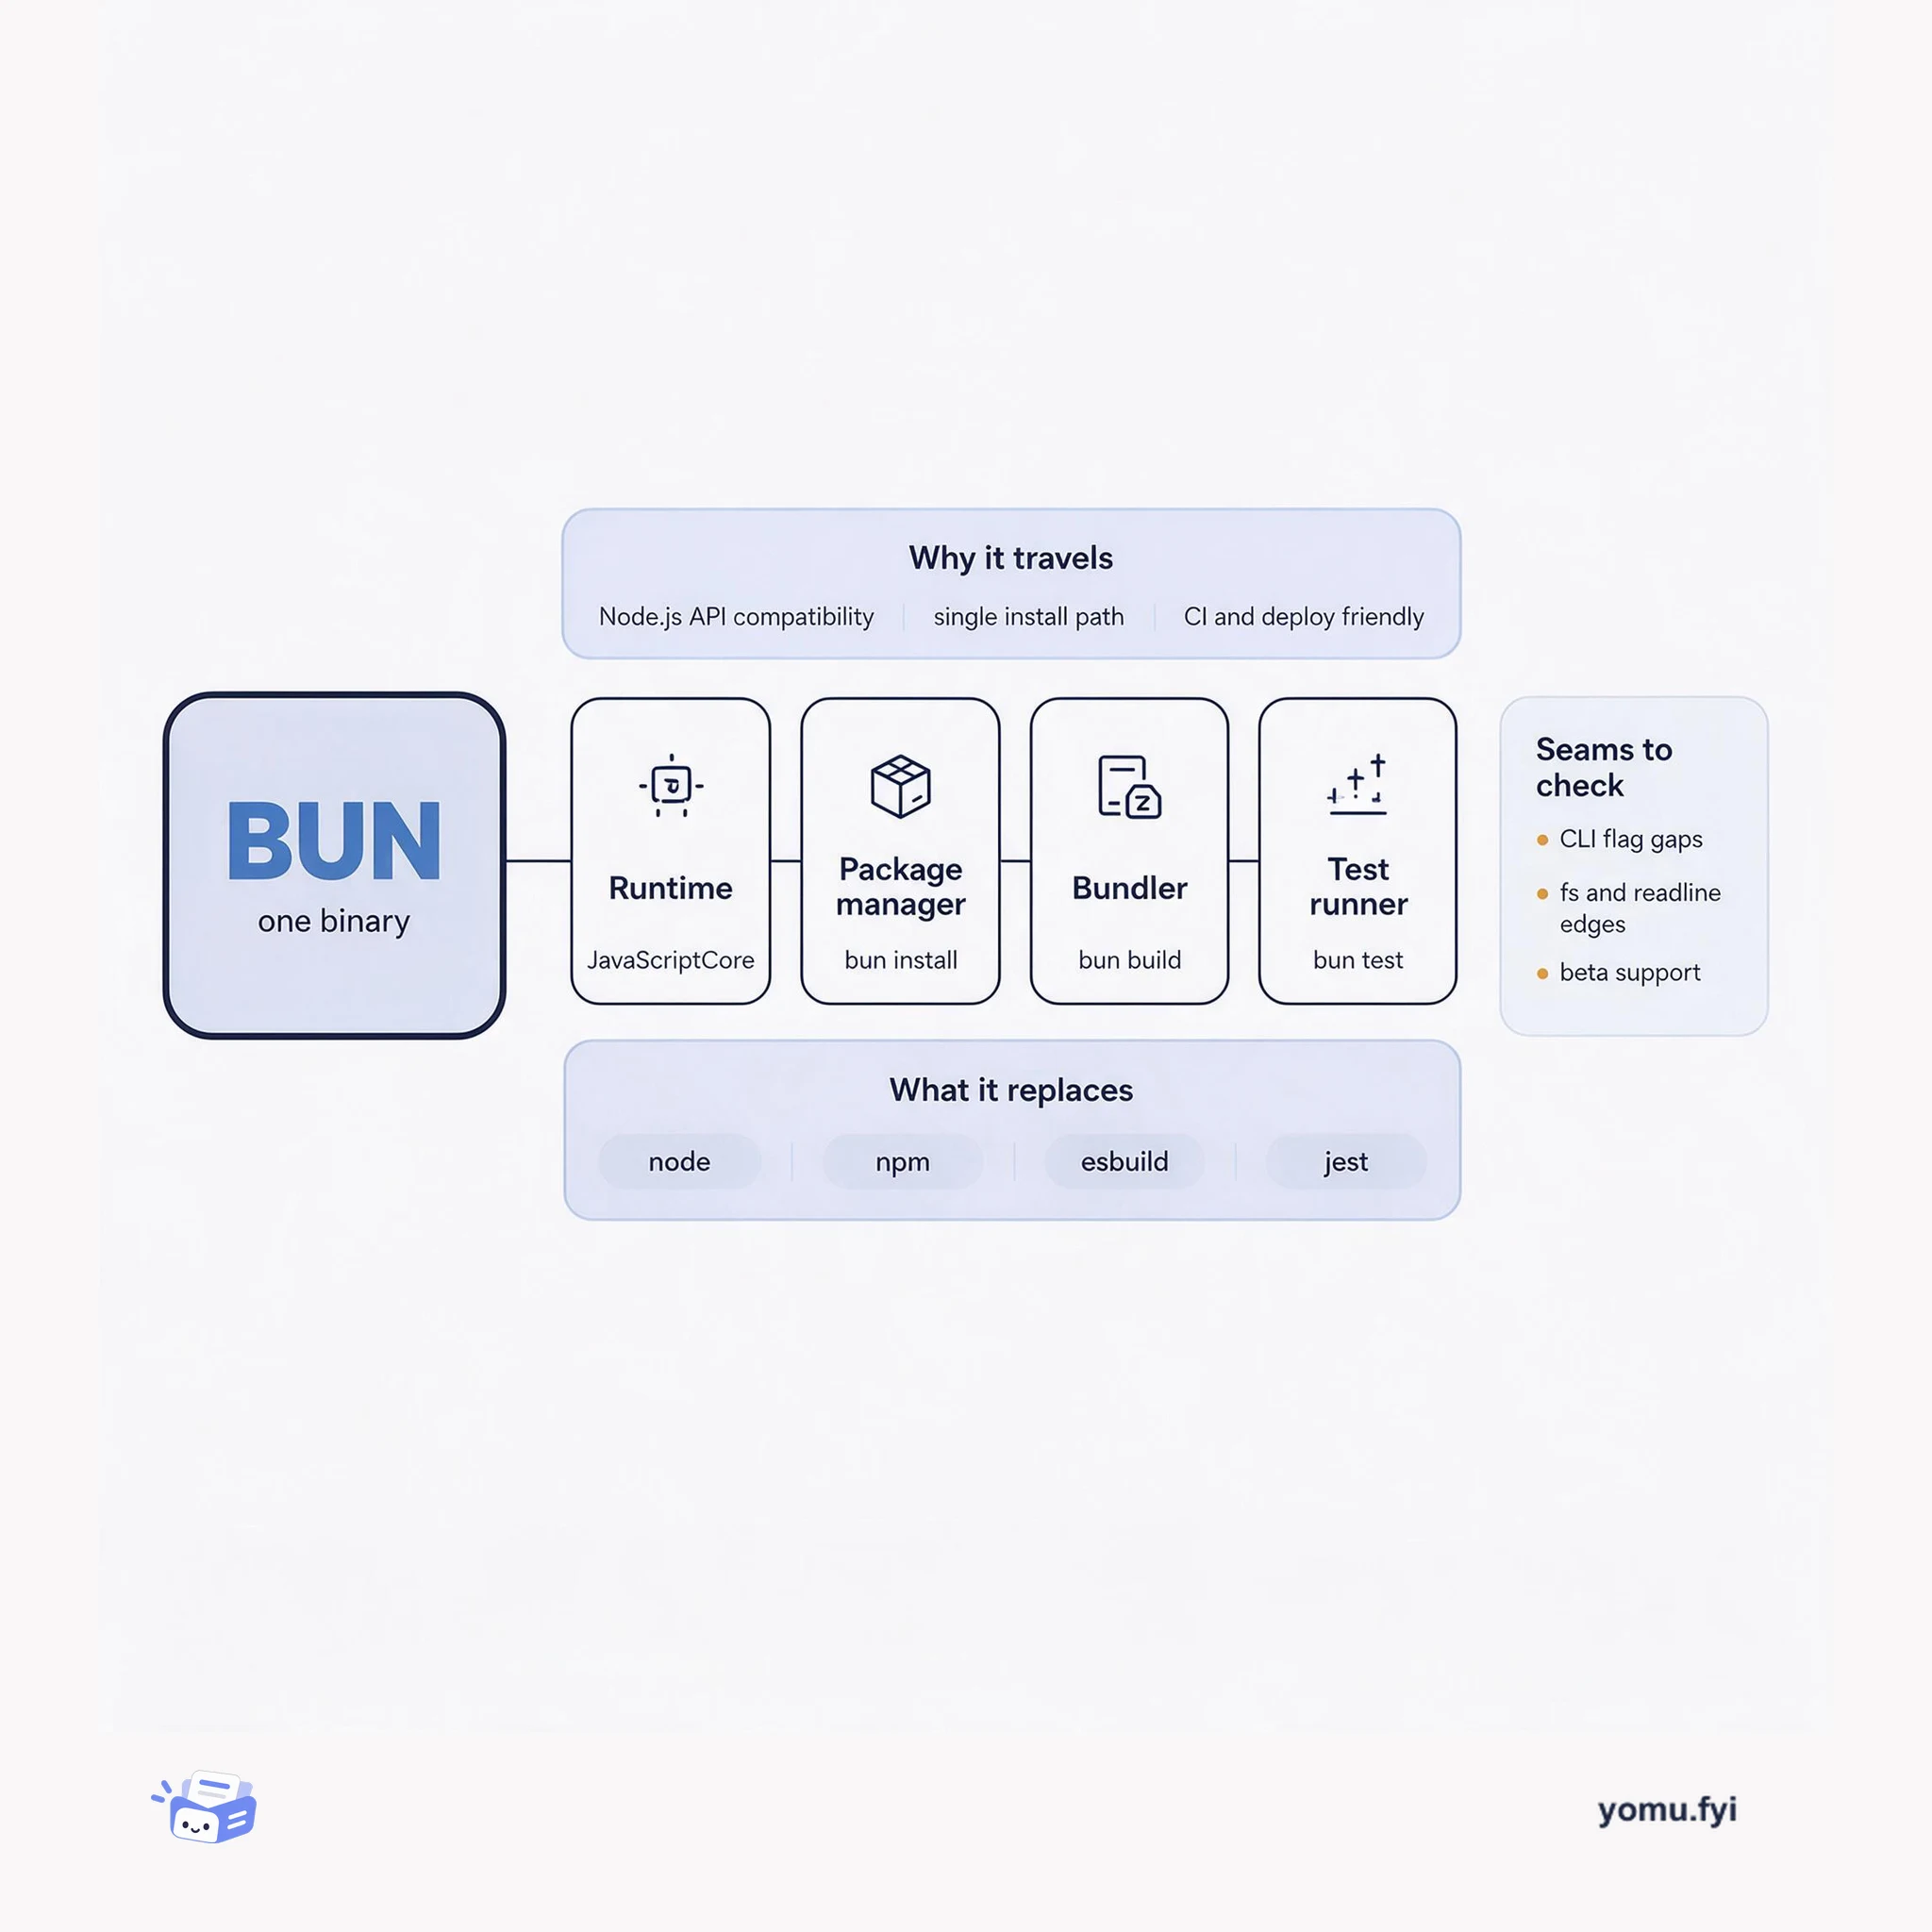
Bun packs a runtime, package manager, bundler, and test runner into one binary. Here is how those four parts fit together and where the seams still show.
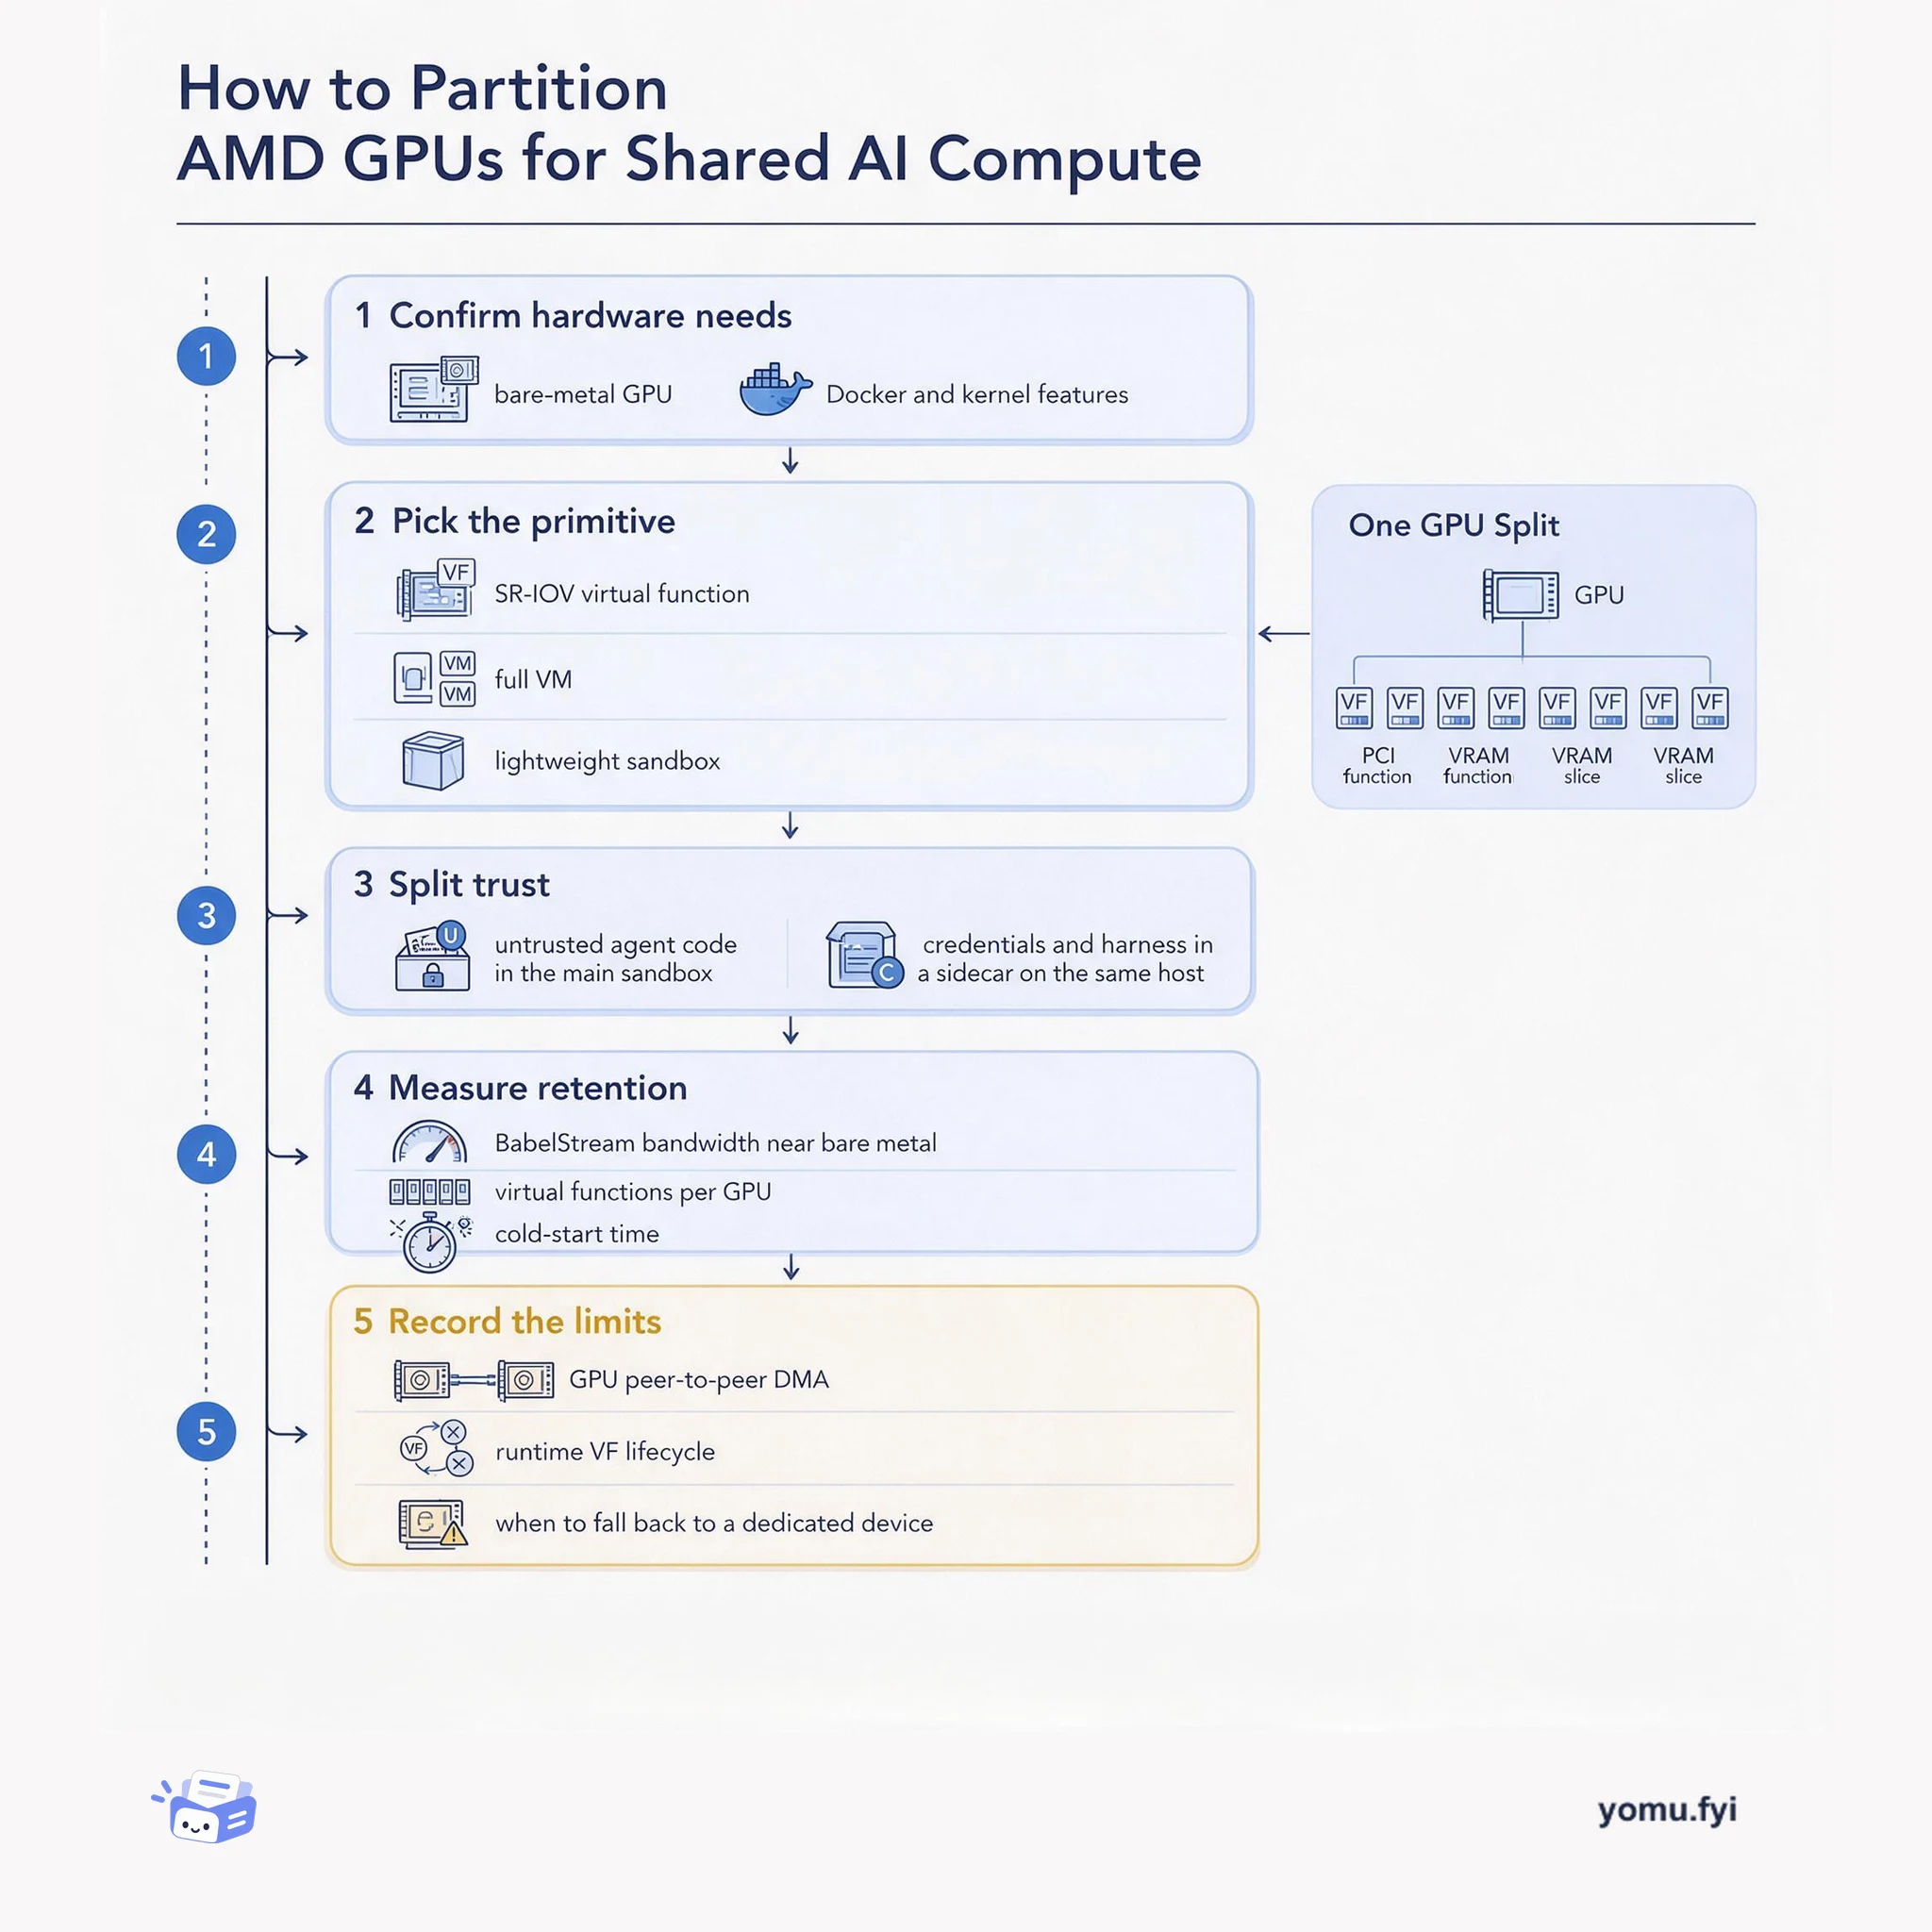
A five-step how-to for deciding when an AMD Instinct GPU should stay dedicated and when SR-IOV virtual functions, VMs, or sidecar isolation can safely share it.
The Good Stuff
Paid picks we use ourselves. Links carry a referral code — a subscription through one earns us a commission at no extra cost to you.
Newest first
Observability systems frequently encounter high cardinality when metrics contain numerous unique label combinations across multidimensional cloud infrastructure. In Prometheus, every unique label combination instantiates an independent time series that incurs metadata overhead, requires in-memory memSeries registration, and continually expands inverted index posting lists. The ingestion engine stores samples in two-hour Head blocks using compressed 120-sample chunks with XOR-based encodings, but rapid series creation and elevated scrape frequencies multiply chunk allocations and memory consumption. When executing read operations, broad aggregations and regular expressions require intersecting expansive posting lists and decoding entire chunks sequentially because the engine cannot push value predicates directly into compressed storage blocks. Consequently, managing high-cardinality workloads in series-oriented architectures forces operational trade-offs between system stability and granular visibility into ephemeral components.
Continuous batching improves GPU utilization with tightly packed batches, but its synchronous loop makes the CPU and GPU take turns, leaving the GPU idle while the CPU prepares each next batch. Profiling 8K-token generation with a batch size of 32 and an 8B model recorded 300.6 seconds, with the GPU idle for 24.0% of runtime. The post builds asynchronous batching by overlapping CPU preparation with GPU computation, using non-default CUDA streams, non-blocking transfers, and synchronization events to coordinate dependencies. In the same experiment, GPU activity rose to 99.4% and total generation time fell to 234.5 seconds, a 22% speedup, without new kernels or model changes while maintaining model accuracy.
Postgres Foreign Data Wrapper extensions allow PostgreSQL to query external datastores like ClickHouse by delegating execution to remote engines. Engineering pg_clickhouse centers on pushdown decisions that determine whether SQL expressions run remotely or stream raw data back across the wire. Because pushdown depends on planner callbacks, deparser translations, and ClickHouse semantic compatibility, a single untranslated clause can block upper-level query pushdown entirely. Resolving pushdown barriers enables complex analytic queries to return hundreds of rows in milliseconds rather than pulling tens of millions of rows for local processing. Ultimately, pushdown development requires an iterative negotiation across differing SQL grammars, occasionally requiring the revocation of translations that fail to maintain strict equivalence.
ClickHouse Cloud provides an in-memory Join table engine for precomputed hash-map lookups and joins, aimed at enriching append-only fact data with dimensions that change occasionally. With Join(ANY, LEFT, key), inserting another row for a key acts as an upsert, while joinGet and matching JOIN clauses use the in-memory structure. Open-source Join tables are not distributed and persist each INSERT batch as separate .bin files without automatic compaction, but ClickHouse Cloud transparently uses SharedJoin with MergeTree for ALL or ReplacingMergeTree for ANY. In the demonstrated enrichment query, duplicate inserts for id 1 leave value 42 visible, while the underlying table retains duplicates until merging; the in-memory load applies FINAL and always selects the latest entry, making ANY LEFT suitable for frequently updated dimensions.
The open-source Databricks JDBC driver 3.x and later releases address connectivity needs affecting dashboards, spreadsheets, applications, and other data workflows. Compared with the legacy 2.x driver, they deliver up to 30% faster retrieval of large query results while preserving backward compatibility. Architectural changes add full Arrow-based transfer for JDK 16+, a first-class asynchronous execution API, stream-based ingestion into Databricks Volumes, and integration with the Statement Execution API. The driver also supports stored procedures, multi-statement transactions, Unity Catalog metric views, query tags, geospatial and complex data types, plus built-in client telemetry for query latency, metrics, and errors. Its open-source ownership and Databricks maintenance are presented as enabling faster fixes, new features, transparency, contributions, and tighter platform integration.
Shopify replaced its Redis-based inventory reservation system with MySQL to unify reservations with the inventory ledger and provide ACID coordination between payment and inventory updates. The new design stores one row per sellable unit in a bounded pool of up to 1,000 rows per item/location combination, uses MySQL 8's SKIP LOCKED to avoid waiting on locked units, and replenishes depleted pools. Composite primary keys reduced row locks, READ COMMITTED avoided gap locks that interfered with replenishment, and consistent lock ordering prevented deadlocks. The investigation found connection-pool usage elsewhere in checkout, rather than reservation query speed alone, was the immediate ceiling; cleanup removed 50% of primary-database reads and 33% of transactions, while configuration changes added headroom. Shopify validated the design in shadow mode, then rolled it out gradually with a Redis rollback path, meeting high-throughput targets during peak 2025 traffic.
The post explains how foundation-model scaling now spans pre-training, post-training, and test-time compute, creating shared infrastructure requirements rather than a single pre-training curve. It examines how AWS infrastructure and open-source tools support these workloads across accelerated compute, networking, storage, orchestration, ML frameworks, and observability. Technical detail includes NVIDIA H100, H200, B200, and B300 GPU characteristics, NVLink/NVSwitch scale-up communication, and EFA-based scale-out networking for distributed collectives. The architecture also incorporates EC2 P instances, tiered storage, Slurm, Kubernetes, SageMaker HyperPod, CUDA, NCCL, PyTorch, Prometheus, and Grafana. The conclusion presents integration points between these layers as the basis for diagnosing bottlenecks and making scaling decisions across the foundation-model lifecycle.
AI-assisted software development often generates functional code that lacks proper instrumentation, leading to unindexed database queries, N+1 patterns, and fragmented connection strategies. While Supabase provides built-in query analytics, security advisors, and subsystem logs, it cannot trace distributed requests across the entire application stack. Integrating Sentry bridges this visibility gap by establishing distributed traces across Next.js frontends, Deno-based Supabase Edge Functions, and Postgres databases. Teams can forward Supabase logs into dedicated Sentry projects and configure runtime integrations to automatically detect performance bottlenecks such as slow spans and Web Vitals regressions. Furthermore, integrating Model Context Protocol servers allows Sentry's Seer debugger to identify root causes and generate automated fixes for emerging issues.
Avride’s expanding autonomous passenger vehicle and delivery robot fleet generated thousands of data points per minute, overwhelming its legacy Apache Iceberg and Parquet metadata indexing architecture. Iceberg’s optimistic concurrency model struggled with parallel writes, pushing ingestion latencies to hours or days, inflating query times to 10–20 seconds, and requiring raw data duplication across storage locations. To resolve these bottlenecks, Avride built a custom indexing and metrics warehouse powered by ClickHouse Cloud on AWS backed by Amazon S3 object storage. The new architecture dropped ingestion delays to seconds, reduced worst-case lookup latencies to under one second, eliminated the need for bespoke caching layers, and removed payload duplication. Beyond operational analytics, the unified ClickHouse platform now supports internal ride-replay debugging tools, simulation workflows, and high-cardinality vehicle C++ performance trace profiling.
ClickHouse Release 26.4 introduces 39 new features, 45 performance optimizations, and 238 bug fixes, focusing on broader SQL compatibility and indexing improvements. The update expands standard SQL support by allowing VALUES clauses as table expressions with column aliases, PostgreSQL-style EXTRACT units, NATURAL JOIN, and SET TIME ZONE commands. For text search, LIKE and ILIKE pattern queries using splitByNonAlpha tokenizers scan inverted index dictionaries instead of executing full-table scans when the dedicated evaluation setting is active. The release also provides the JSONAllValues function to extract all leaf values from a JSON column into a string array, enabling text skip indexes that significantly reduce scanned data and improve query latency.
Unreal Engine games frequently experience performance issues such as frame-rate drops, hitches, and network degradation that do not register as application crashes. To address the lack of live production telemetry, the Sentry Unreal SDK introduces automatic performance metrics. The integration periodically samples frame times, network health, active UObject counts, physical memory usage, and garbage collection pause durations across desktop, console, and Android platforms. Telemetry entries attach contextual hardware and environment attributes alongside trace IDs to connect aggregate latency spikes directly to underlying traces and spans. Enabled by default in Unreal SDK version 1.11.0, this telemetry provides developers with fleet-wide visibility into hardware-specific bottlenecks across game releases.
At Uber, repeated Go goroutine stack expansion consumed substantial CPU in a service whose stack-memory usage remained low, making memory a viable trade-off. Go starts goroutines with 2KB stacks and doubles them when needed, copying the previous stack; the post also notes that adaptive stack sizing and stack shrinking can add runtime cost. Uber patched the runtime, disabled adaptive sizing and shrinking, and used profile-guided analysis of pprof traces plus assembly-derived function stack usage to choose a static power-of-two starting size. For the profiled service, the analyzer identified about 19KB of required stack usage, leading to a 32KB setting instead of 2KB. After deployment, stack-growth CPU fell from close to 10% to below 1%, while most instances used about 50MB of stack and a few reached 200MB.
ClickHouse Cloud introduced Query Insights in preview for Managed Postgres to help teams diagnose slow database queries. Powered by the open-source extension pg_stat_ch, the tool streams per-statement telemetry directly into ClickHouse to enable fast aggregations across billions of execution rows. Postgres normalizes query literals into placeholders during the parse-analyze phase before telemetry leaves the database, preventing sensitive data exposure. Telemetry emission maintains around three percent producer overhead by utilizing a non-blocking try-lock on a shared-memory ring buffer. Users can examine high-level database health metrics, rank query patterns by runtime or latency percentiles, and inspect execution flyouts detailing disk spills, cache hits, and parallel worker behavior.
MongoDB announced the general availability of MongoDB 8.3, designed to support high-throughput AI workloads without requiring application code changes. Compared to version 8.0, the release provides a 35 percent boost in write throughput, a 45 percent increase in read speeds, and 15 percent faster ACID transactions. Additionally, cross-region connectivity for AWS PrivateLink is now generally available, enabling private traffic routing between Atlas clusters across distinct AWS regions without public internet exposure. MongoDB Atlas supports deployments across 130 regions spanning AWS, Google Cloud, and Microsoft Azure, including multi-cloud cluster topologies. These infrastructure updates target enterprise demands for sub-100ms retrieval, sub-second context updates, zero downtime, and strict data residency compliance.
Lakebase’s separation of Postgres compute and distributed storage removes the local-disk torn-page risk that necessitates full page writes (FPW) in traditional deployments. The change disables FPW on compute and moves full page image generation into the pageserver, which creates reset points after a configured number of WAL deltas while preserving bounded read reconstruction. In HammerDB TPROC-C tests, 32-vCPU throughput rose from 95,686 to 439,300 new orders per minute, while average WAL per transaction fell from 58KB to under 4KB, a 94% reduction. Production validation reported WAL reductions from 30MB/s to 1MB/s on a 56-vCPU project, p99 read latency improvements of 30% to 50%, and up to threefold regional storage p99 improvement. The rollout reached all Lakebase Serverless and Neon databases without restarts or customer interruption, using the existing XLOG_FPW_CHANGE mechanism.
PipelineRL migrated its rollout inference engine from vLLM V0 (0.8.5) to V1 (0.18.1), but trainer-side logprobs, policy ratios, KL, entropy, clip rate, and reward diverged from the V0 reference. The investigation separated semantic mismatch, inference-path mismatch, and objective mismatch, then prioritized backend parity before changing the RL objective. Fixes included processed rollout logprobs, explicit V1 runtime settings disabling prefix caching and async scheduling, a V0-like inflight weight-update path, and an fp32 lm_head for the final projection. With those changes, the final V1 run tracked the V0 trajectory across the reported metrics, while processed_logprobs alone did not resolve the training gap.
Expo applications generate approximately 75% of the total event volume received from React Native applications in Sentry. In response, Sentry updated its React Native SDK starting in version 8.10 to improve Expo debugging and performance monitoring workflows. The update automatically enriches events with Expo constants and over-the-air update context, including channels, runtime versions, and emergency launch warnings when an OTA update fails. Developers can track remote EAS Build lifecycle failures and successes using dedicated hooks configured in package.json. Performance instrumentation now supports span generation for Expo Router route prefetching as well as asset and image loading through wrapper functions around expo-image and expo-asset.
The Open ASR Leaderboard is adding private English speech-recognition datasets from Appen Inc. and DataoceanAI to evaluate scripted and conversational speech across several accents. To reduce benchmark-specific optimization (“benchmaxxing”) and test-set contamination, the datasets remain private, while the default Average WER continues to use public datasets only. A toggle exposes the private data, with macroaverages for overall, scripted, conversational, American, and non-American subsets; individual split scores are withheld to discourage provider- or accent-specific optimization. The leaderboard uses a shared Hub dataset, normalized transcripts and outputs, and open-source evaluation code, while private evaluation is run after public-set verification when models are submitted.
Agentic analytics workflows introduce bursts of concurrent, low-latency analytical queries over continuously ingested data. Analytical query efficiency relies on columnar storage and chunk-level pruning, which require contiguous, sorted data to avoid full-table scans. Rather than evaluating warehouses solely at query runtime, this benchmark compares the write-side cost of maintaining query-ready data in ClickHouse and Snowflake during continuous ingestion at approximately one million rows per second. Snowflake relies on post-write clustering to organize data, whereas ClickHouse constructs sorted layouts on the write path and refines them via background merges. Across 100B, 200B, and 300B row checkpoints on the ClickBench dataset, ClickHouse achieved a query-ready layout at 22 times lower cost and delivered 28 times better write-side cost-performance.
Supabase Realtime and Supabase Pipelines both read PostgreSQL changes through logical replication, but they target different jobs. Realtime delivers live updates and communication to browsers and apps through Broadcast, Presence, and Postgres Changes; its Postgres Changes path checks Row Level Security for subscribed users, uses temporary replication slots, and offers best-effort delivery without replay after disconnects. Pipelines is a managed change-data-capture system that performs an initial sync, then replicates selected publication data in batches to supported analytical destinations through a persistent replication slot, retaining progress and retrying transient failures. The choice depends on the destination and delivery needs: use Realtime for low-latency user experiences that can tolerate gaps, Pipelines for durable analytical copies with at-least-once processing and idempotent destination writes, and both when an application needs both capabilities.
The best engineering reads, once a week.