From Ringing Line to Resolved Contact: How a Call Center Works
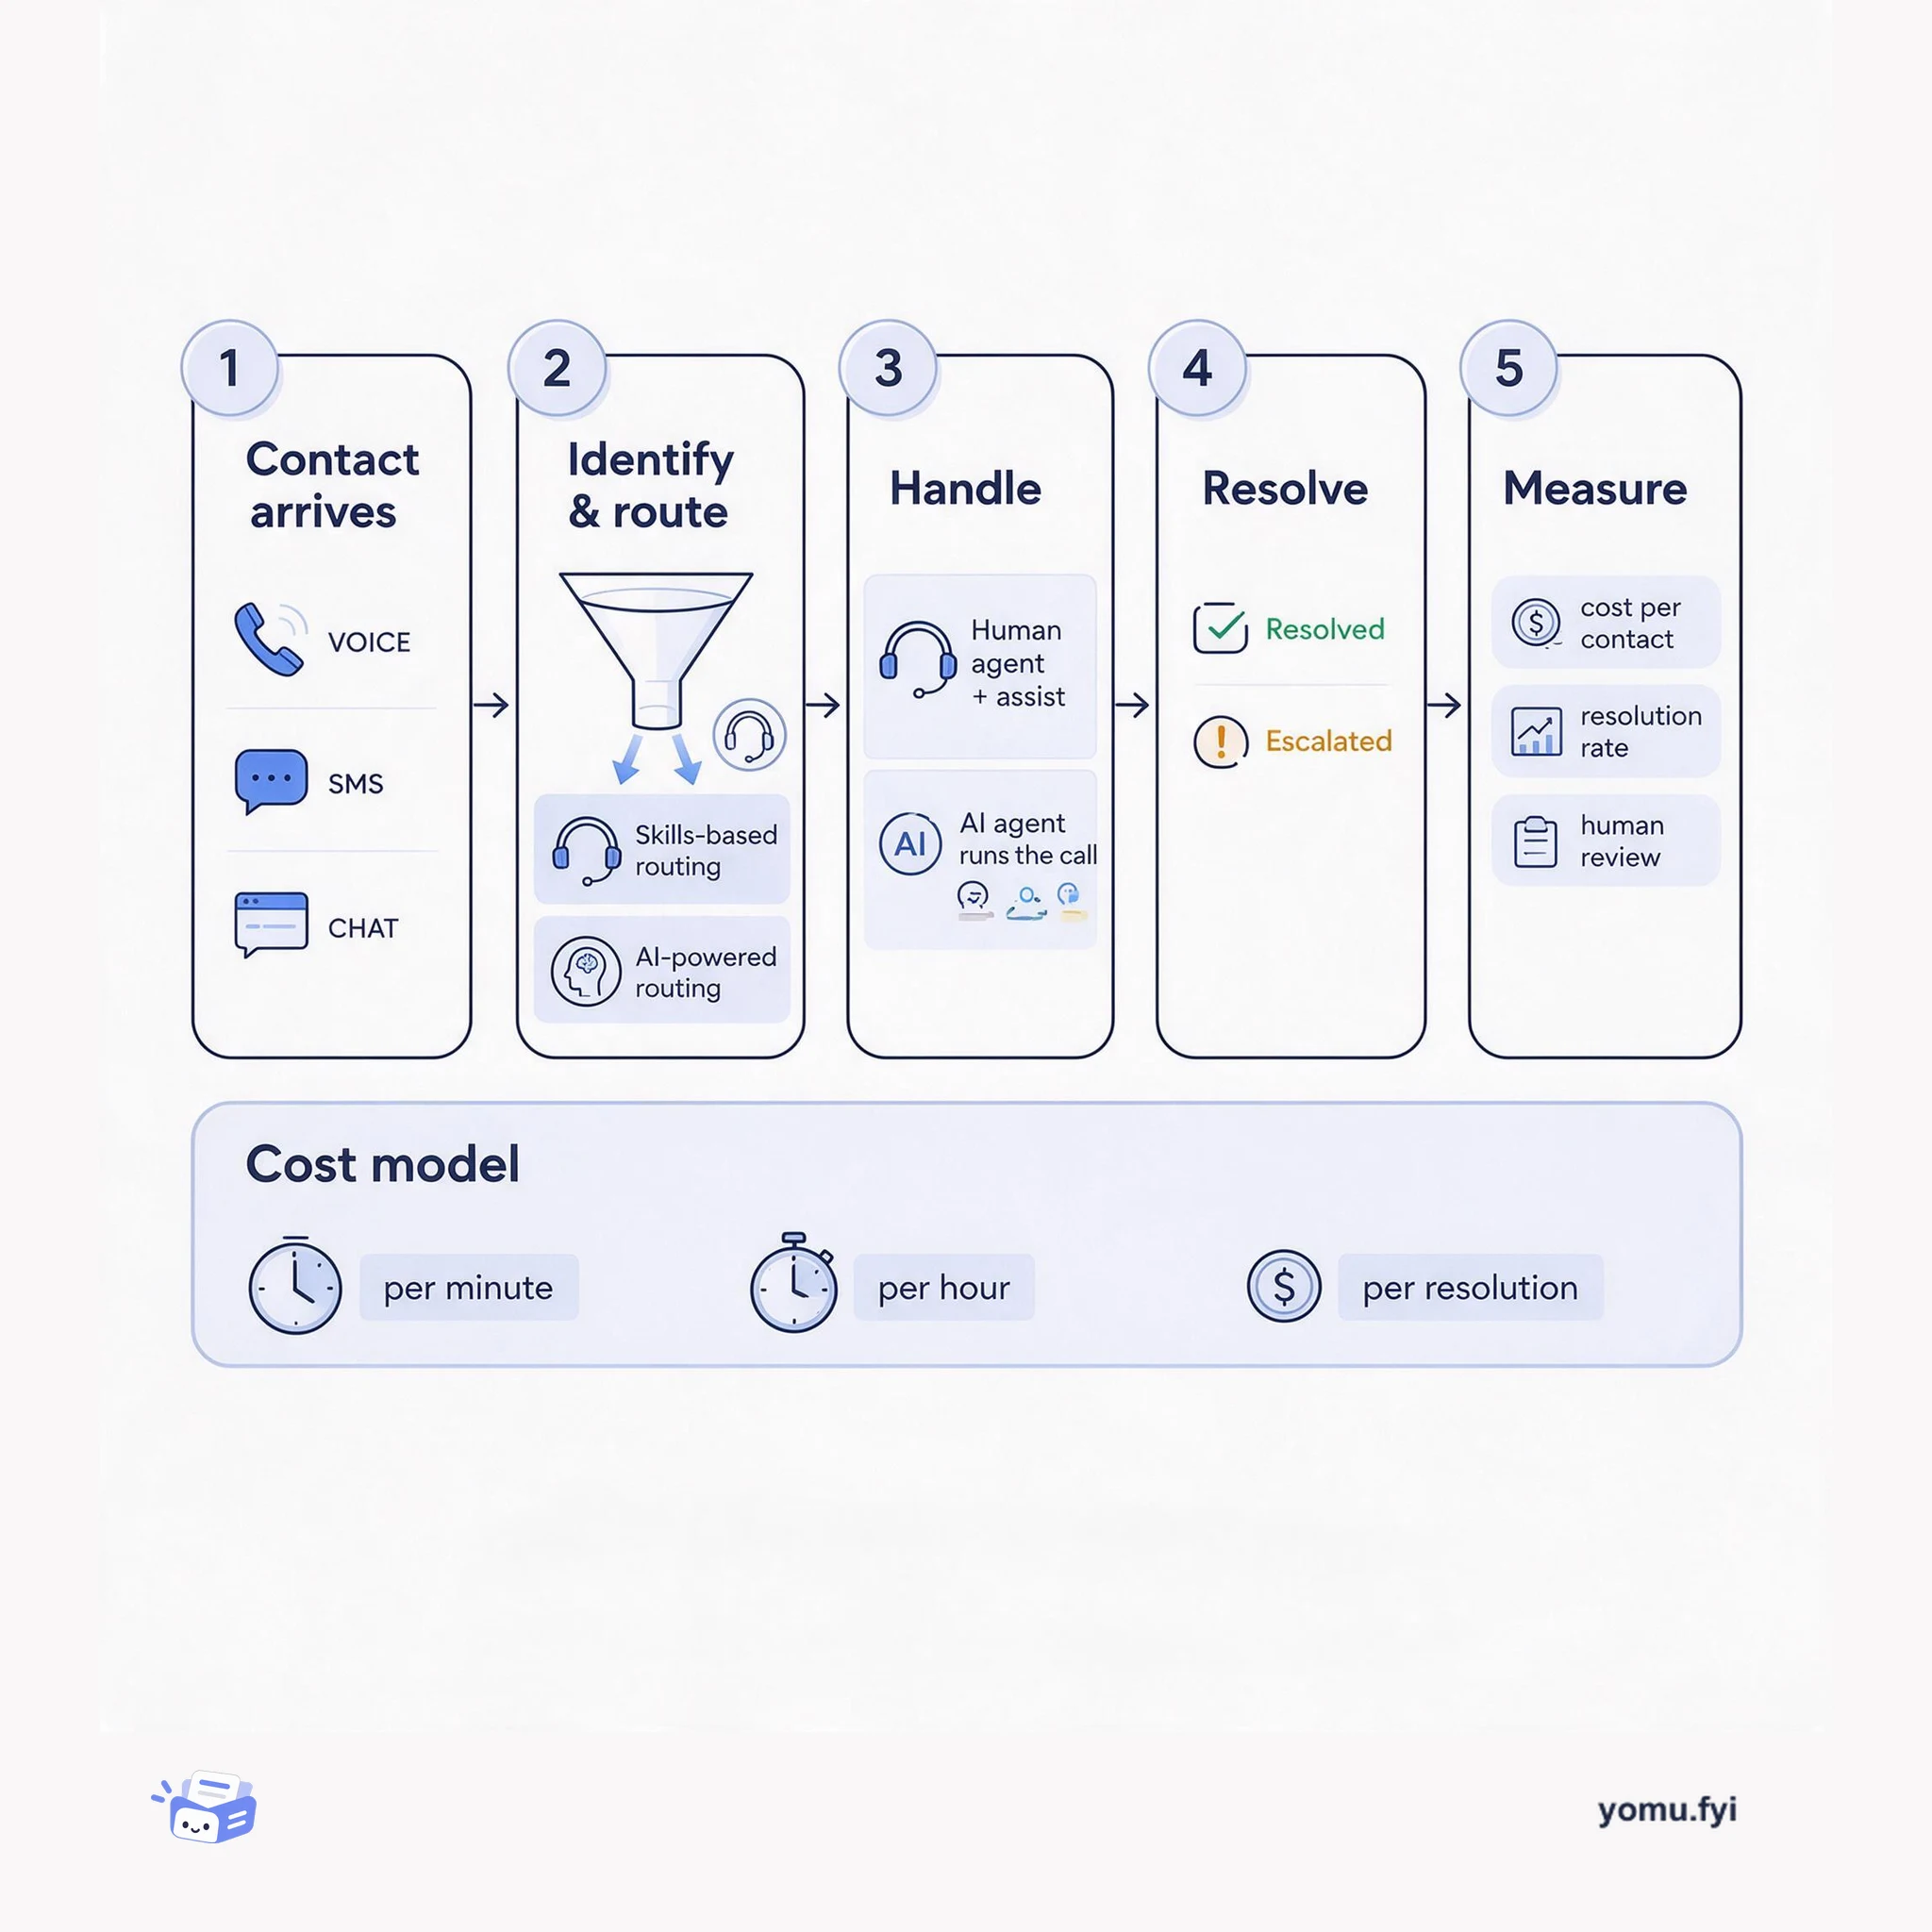
Follow one contact through a call center: arrival, routing, handling by a human or AI agent, resolution, and the cost-per-contact math that decides which path to use.
ChatOps turns a chat channel into the control plane for an incident: a bot pages roles, opens the room, runs mitigations, and timestamps every action. This flow shows where the channel helps and where it stops.
In a ChatOps incident, the channel is the shared control plane rather than the system of record. Signals from alerting reach a bot, which pages the incident manager and component experts, opens a dedicated room, and binds the incident to one timeline. Mitigation and status updates then run as commands from that room, so responders share one state instead of switching between consoles. The flow only holds together if the durable artifacts — notes, event times, post-incident documents, and reproducible investigations — land somewhere outside chat.
ChatOps becomes a control plane once chat commands carry operational authority. In Shopify's incident procedure, the Spy bot in Slack pages responders, starts the incident and its dedicated war room, communicates status, runs mitigation, and stops the incident, with paging, status page, and code integrations wired through webhooks. Notifications alone do not do that.
Because chat history is a poor system of record — investigations often end up as Slack snippets nobody can rerun. Supabase's Explorer and Notebooks store the queries rather than the results, so rerunning returns current data, and notebooks live in a versioned folder that goes through pull request review. Treat the channel as the live timeline and the durable artifact as the follow-up.
Anything whose correctness cannot depend on a human typing at the right moment. Multigres treats Postgres failover as a consensus problem, acknowledging writes only after synchronous replication to enough nodes, and federated automation drives remediation from Git as a single source of truth. Keep chat for coordinating and recording.
The posts behind it
 Cloudflare · · Incident / postmortem
eMudhra’s eight shockingly weak intermediate private keys, including the number 4, could be recovered instantly from public certificates, allowing anyone to forge certificates for any domain. Cloudflare patched high-impact systems within hours on October 19, 2026, using Pingora to reject the vulnerable keys and AI-assisted code analysis to identify all affected systems. By October 21, logging detected about 22,000 handshakes with the weak keys, with two-thirds being test site fetches and most of the rest appearing to be servers using the weak intermediate themselves. About 160 handshakes involved forged certificates naming other organizations’ domains, including consumer IoT domains, with one forged certificate dated less than an hour after the weakness became public. Cloudflare’s challenge page probes show that while modern browsers are mostly patched, bots, old browsers, and embedded browsers like Android WebView still accept the compromised chain, with over half of probes on large networks still vulnerable.
 Red Hat · · Problem & solution
An outage of a central Red Hat Ansible Automation Platform controller halts CI/CD pipelines and automated remediation. To maintain continuous availability, platform teams can deploy a federated multi-cluster architecture managed through GitOps, using Git repositories as a single source of truth for declarative Infrastructure as Code. This approach decouples platform configuration from workload execution, with GitHub Actions coordinating deployment and integrating with ServiceNow for change governance and Splunk for centralized logging. The framework operates in two stages: declarative infrastructure provisioning via the main branch runs playbooks/configure_aap.yml to configure enterprise settings and inventory mappings, while dynamic workload dispatch via the deploy branch uses playbooks/dispatch_round_robin.yml to route jobs across clusters using round-robin or explicit targeting. Key use cases include continuous operations across geographic clusters, rolling updates by diverting workloads to a secondary datacenter, and phased platform migrations by running distinct Ansible Automation Platform versions side by side.
 Supabase · · Announcement
Explorer is a new query editor in the Supabase Dashboard that unifies database and log queries into one interface, solving the common problem of diagnosing production issues across separate tools and keeping investigations in one place. Notebooks combine saved queries with markdown notes, storing queries rather than results so rerunning always returns current data, making investigations reproducible and shareable instead of being lost in Slack snippets. Users write SQL against either source and render results as tables or charts, and the Assistant can write queries from plain language while keeping the SQL visible and editable, with every change awaiting approval. Log queries carry their own time range, and notebooks live in the supabase folder for versioning and pull request review, with CLI commands supabase notebooks pull and push. Explorer is in feature preview, enabled under Feature Previews in the Dashboard, with notebooks commands available in the beta CLI.
Supabase · · AnnouncementMultigres, an open-source operating system for Postgres built by the Vitess team, has entered private alpha on the Supabase platform. It provides automatic failover across three nodes in different availability zones, guaranteeing no acknowledged writes are lost when the primary fails. Failover is treated as a consensus problem using Postgres synchronous replication, so the system acknowledges a write only after it has been replicated to enough nodes to survive a failure. Built-in connection pooling eliminates the need for a separate pooler and deduplicates prepared statements across clients. The alpha is free for up to two projects per organization on paid plans, but it is not covered by the normal SLA, does not support Realtime or Point-in-Time Recovery, and cannot be enabled on existing projects.
 Shopify · · Explainer
Shopify’s incident management process separates coordination from technical remediation: the incident manager on call (IMOC) leads response, while component experts fix production issues and a Support Response Manager handles public communication. The process follows a simplified Incident Command System hierarchy and moves from detection and confirmation through communication, mitigation, verification, documentation, investigation, and root cause analysis. Its ChatOps chatbot, Spy, runs in Slack through Lita and integrates with PagerDuty, StatusPage, and GitHub via webhooks, providing commands for paging, incident startup, status communication, mitigation, and stopping incidents. Spy binds incidents to a shared #war-room, records notes and event times, generates service disruption documents, sends status-page reminders, and can summon the IMOC squad when an incident lasts beyond a specified period. The result is a more consistent response that reduces context switching and post-incident toil while supporting detailed post-mortems.
More like this
Follow one contact through a call center: arrival, routing, handling by a human or AI agent, resolution, and the cost-per-contact math that decides which path to use.
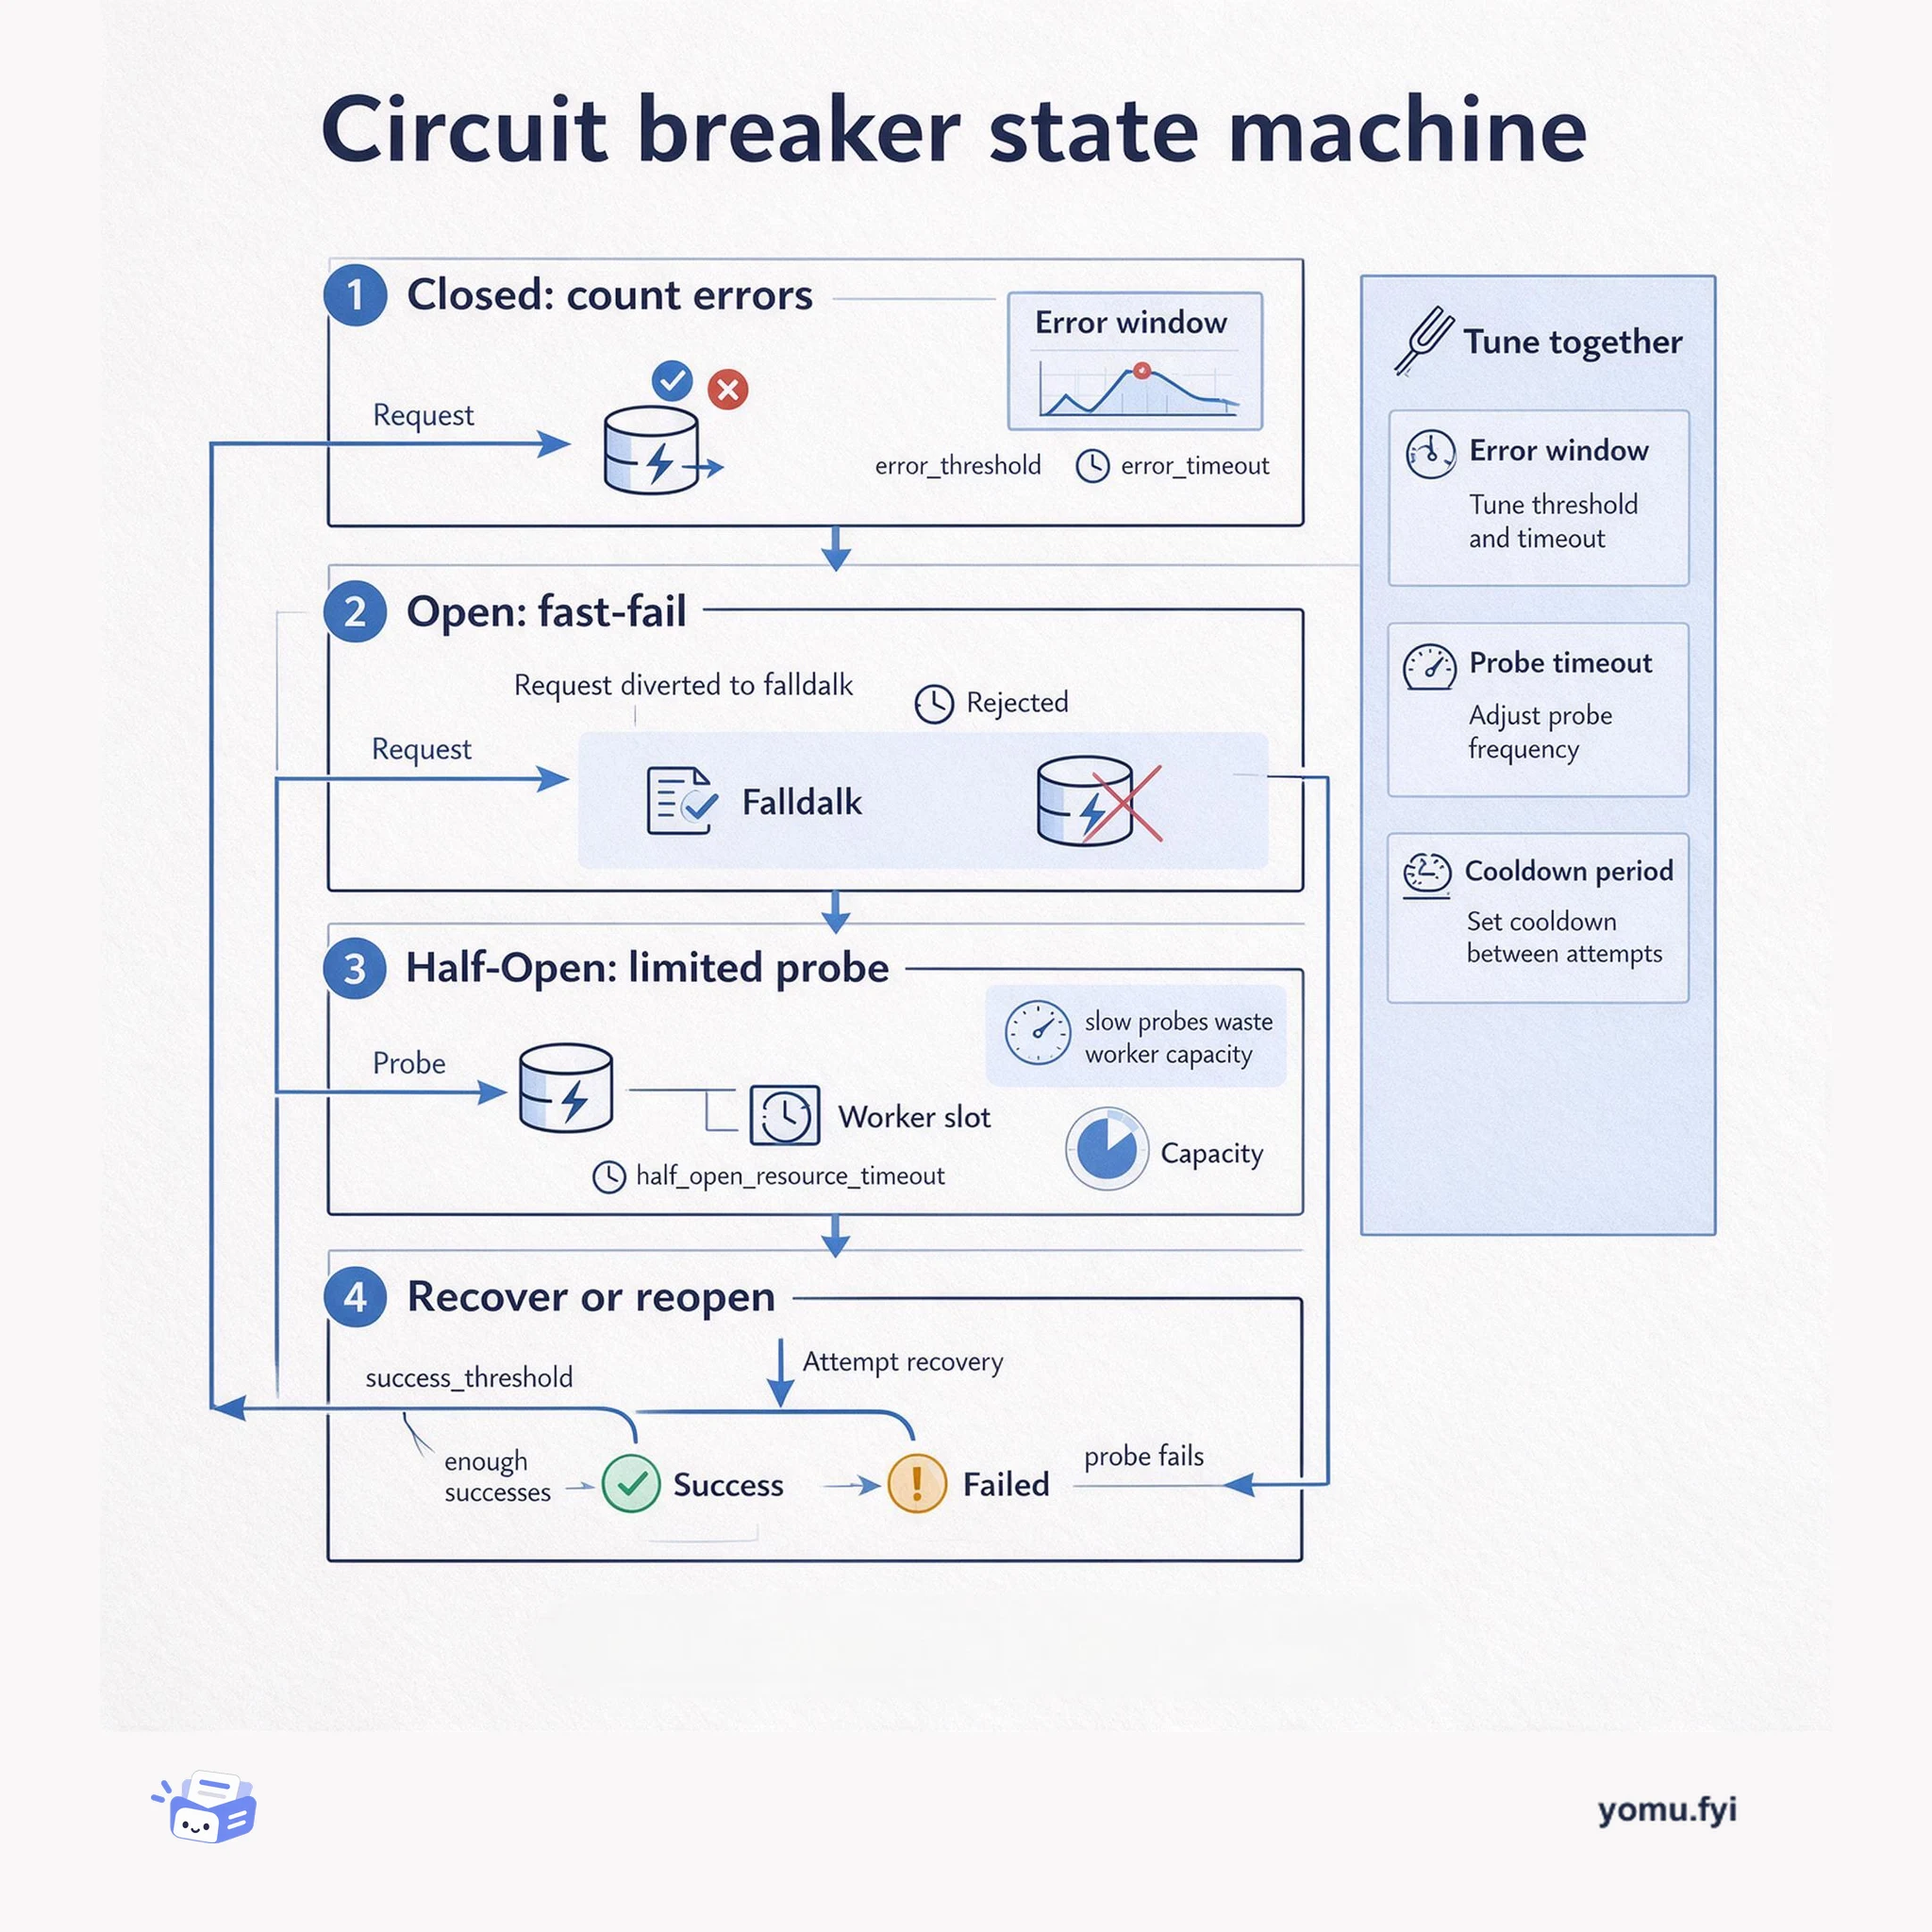
A circuit breaker turns dependency failures into fast failures, then probes for recovery. See the state loop and how half-open probes can quietly consume worker capacity.
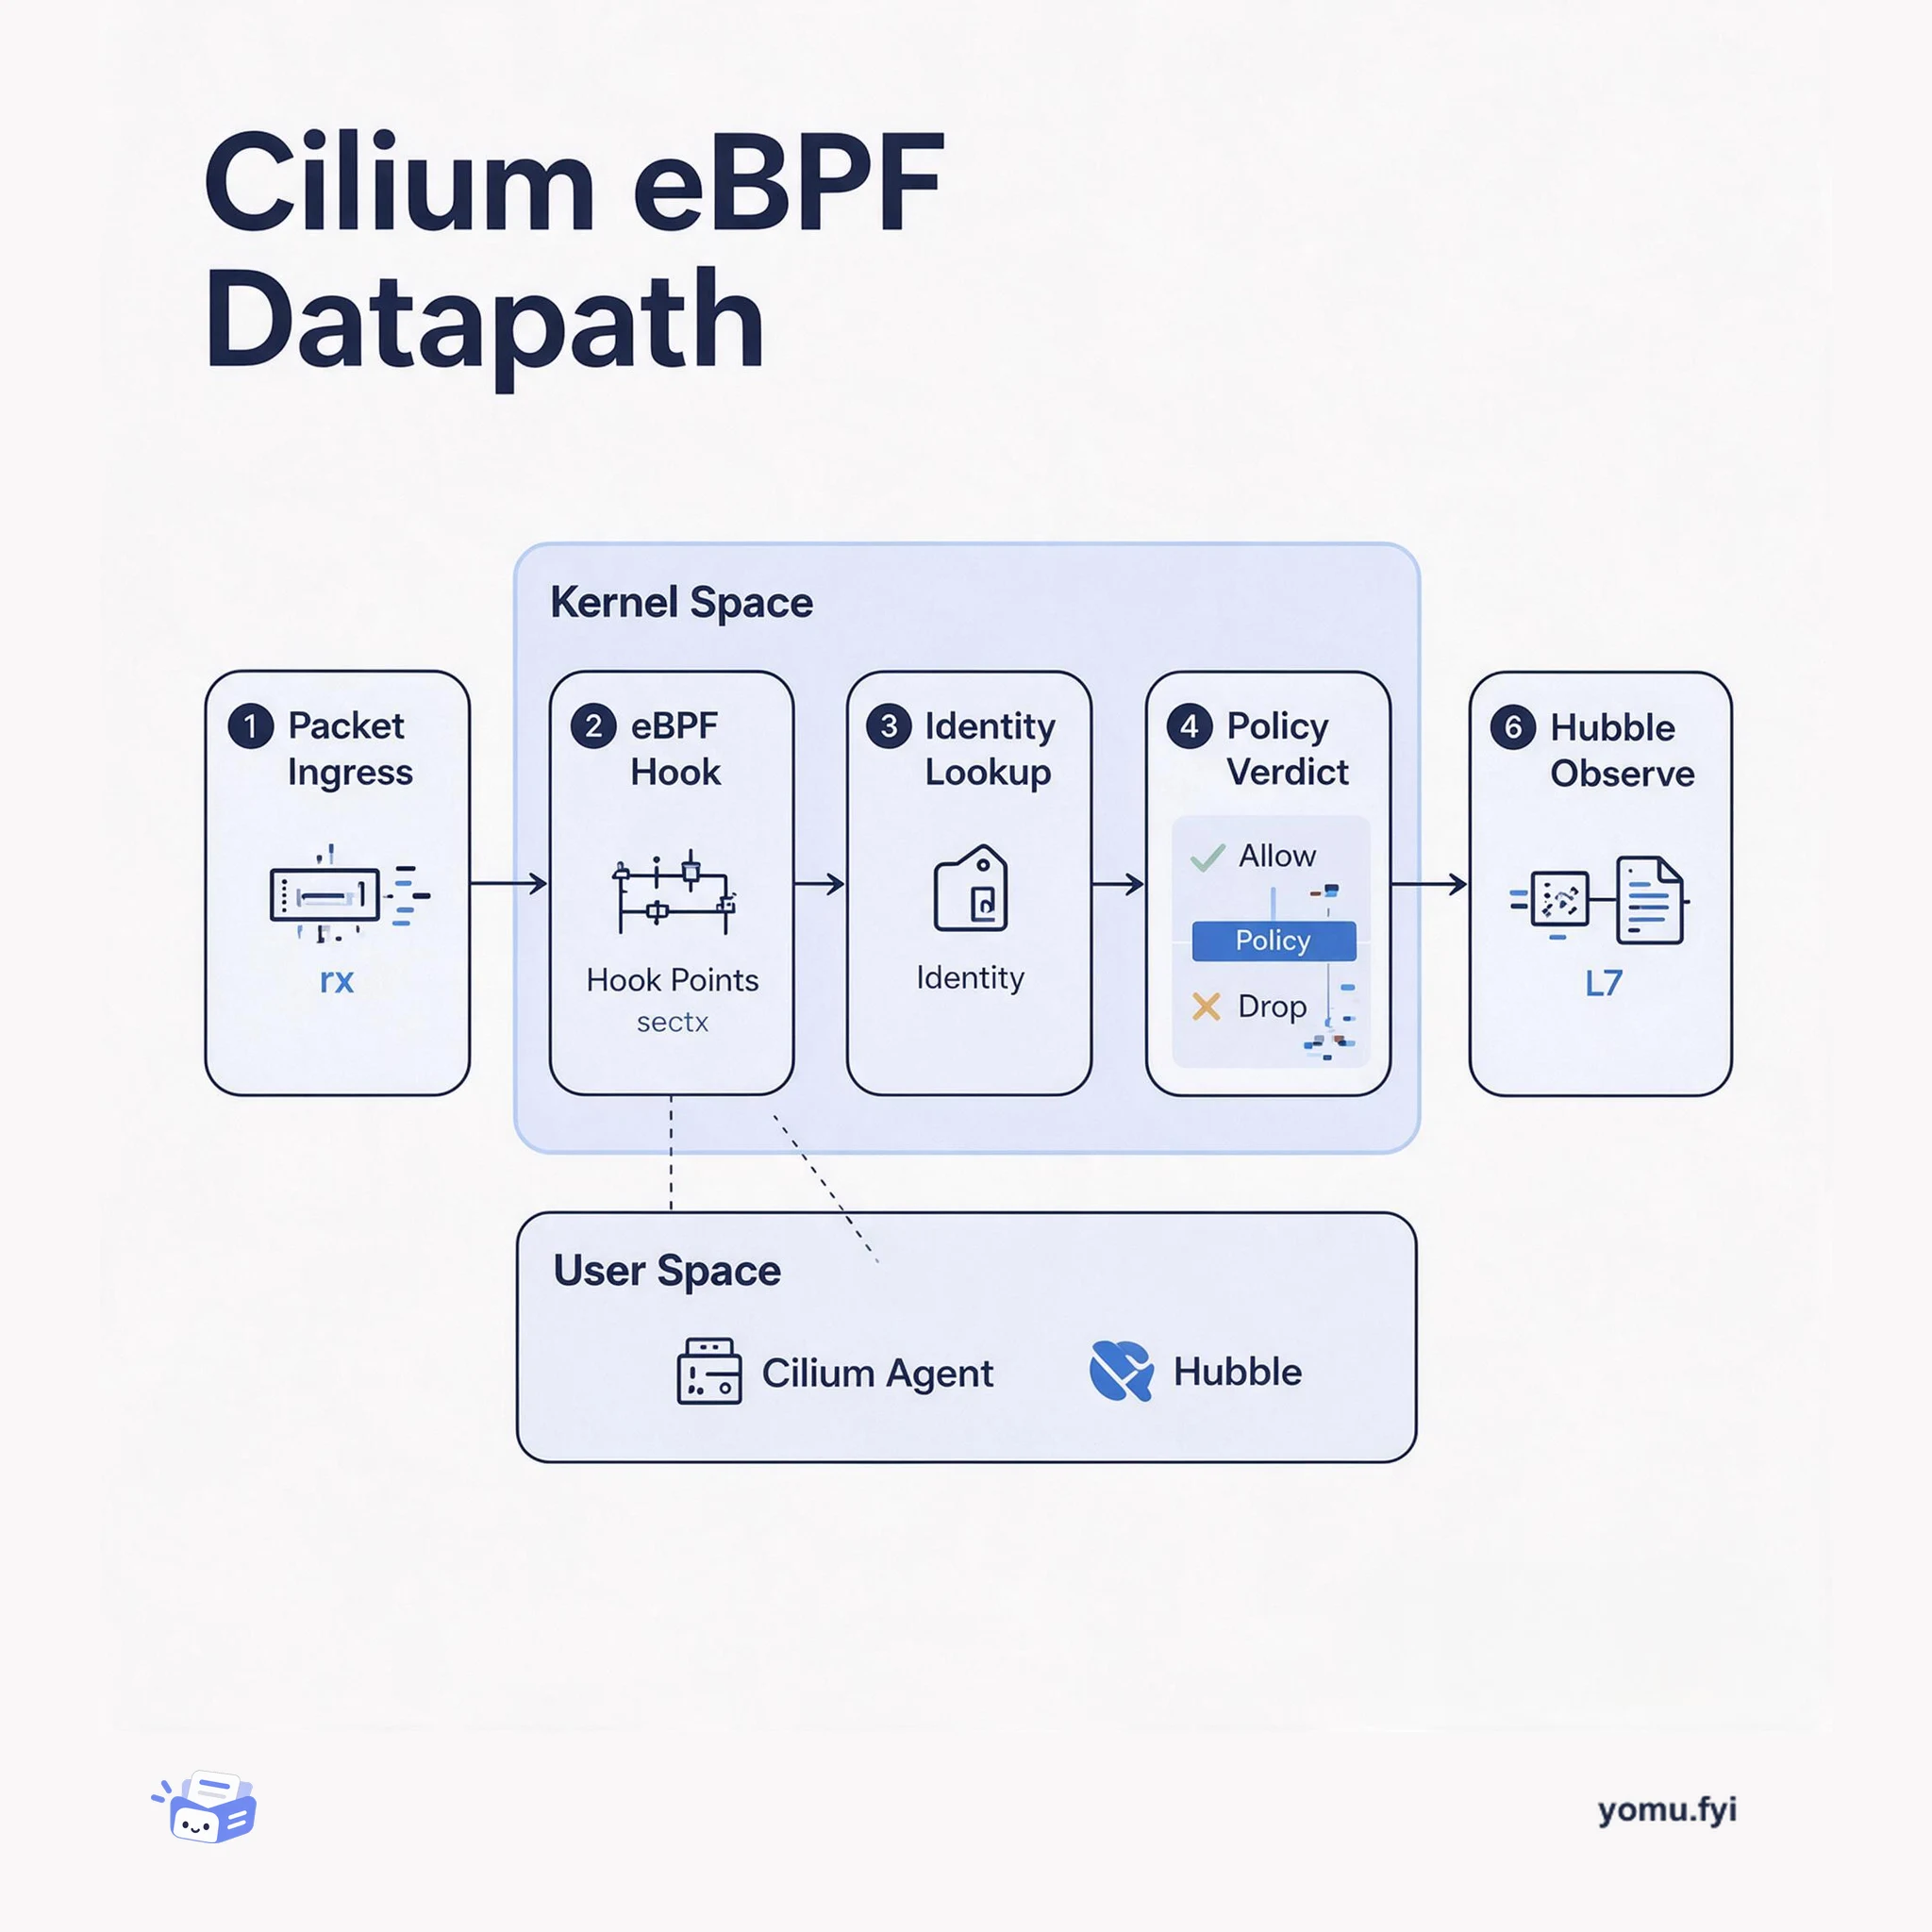
Cilium uses eBPF programs in the Linux kernel to enforce identity-based network policies and capture L7 observability for Kubernetes workloads. This diagram traces the path from packet arrival to policy verdict and Hubble flow.
The Good Stuff
Paid picks we use ourselves. Links carry a referral code — a subscription through one earns us a commission at no extra cost to you.
One useful email. Unsubscribe anytime.