What Is a Real-Time Test Loop?
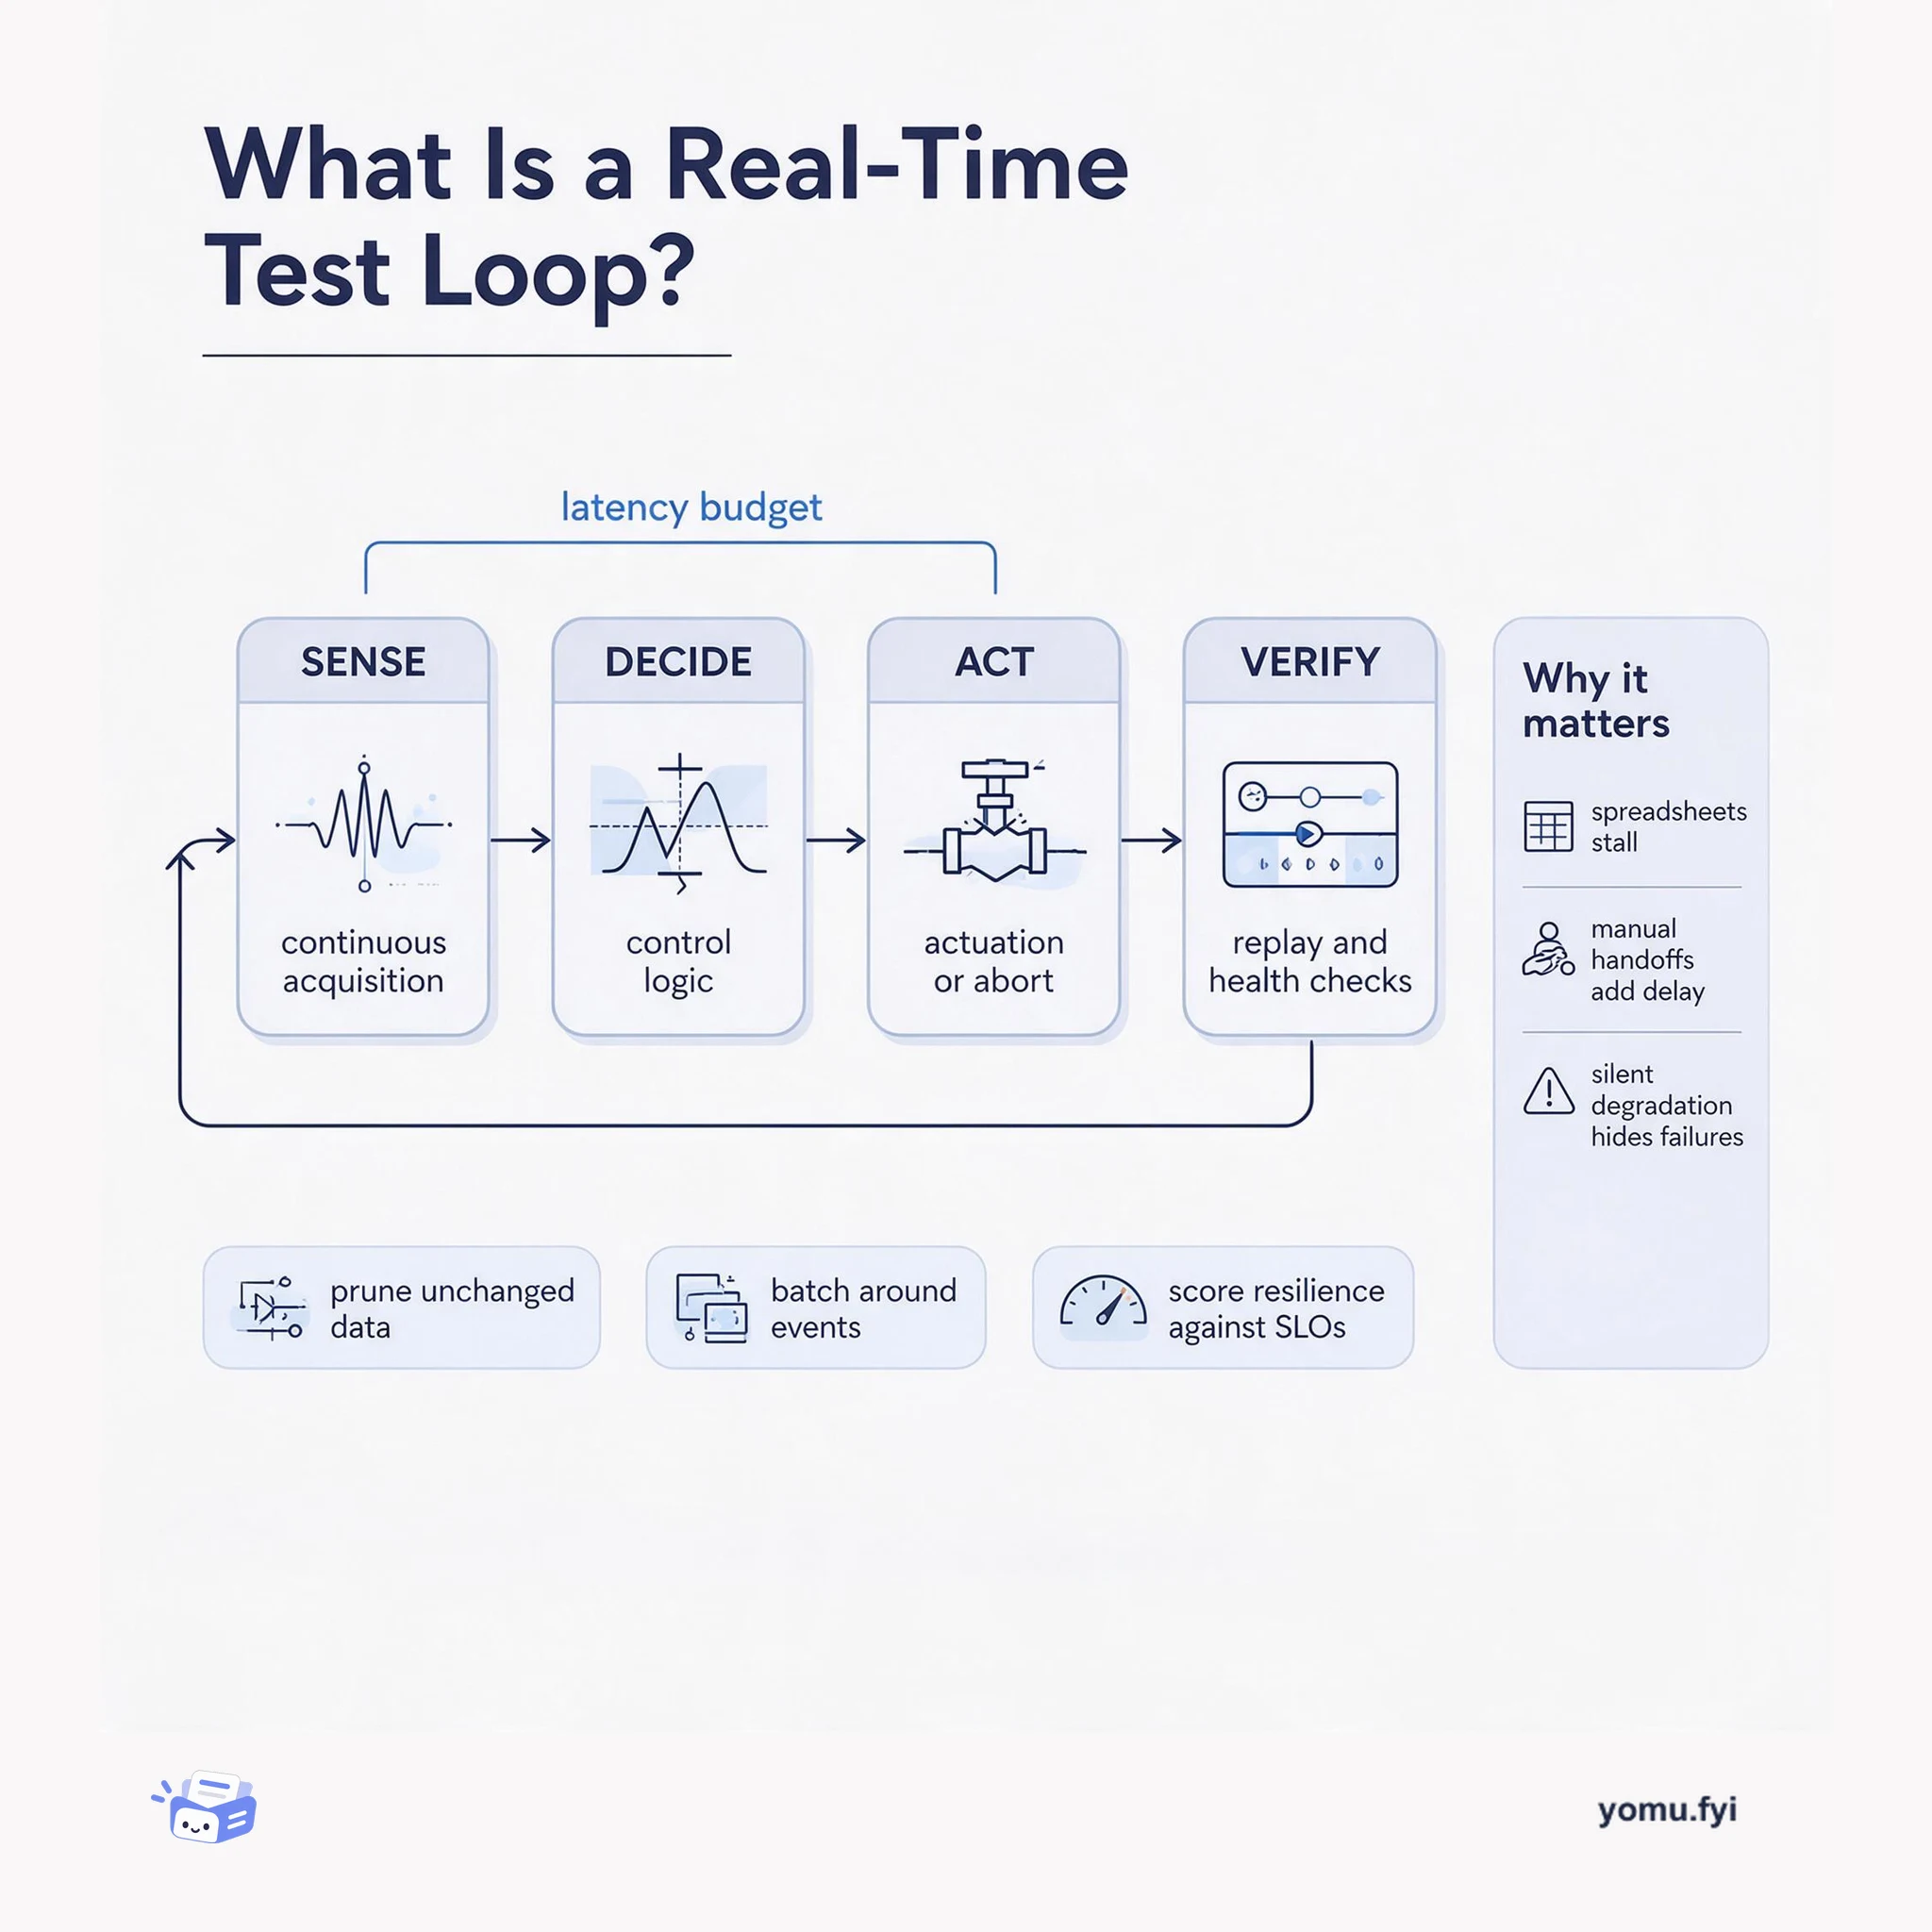
A real-time test loop is the closed path from sensor acquisition to control action and back to verification. This explainer maps its four parts and the latency budget that binds them.
Loading…
Topic
11 posts about Latency. Every summary links to the original.
See the idea
A real-time test loop is the closed path from sensor acquisition to control action and back to verification. This explainer maps its four parts and the latency budget that binds them.
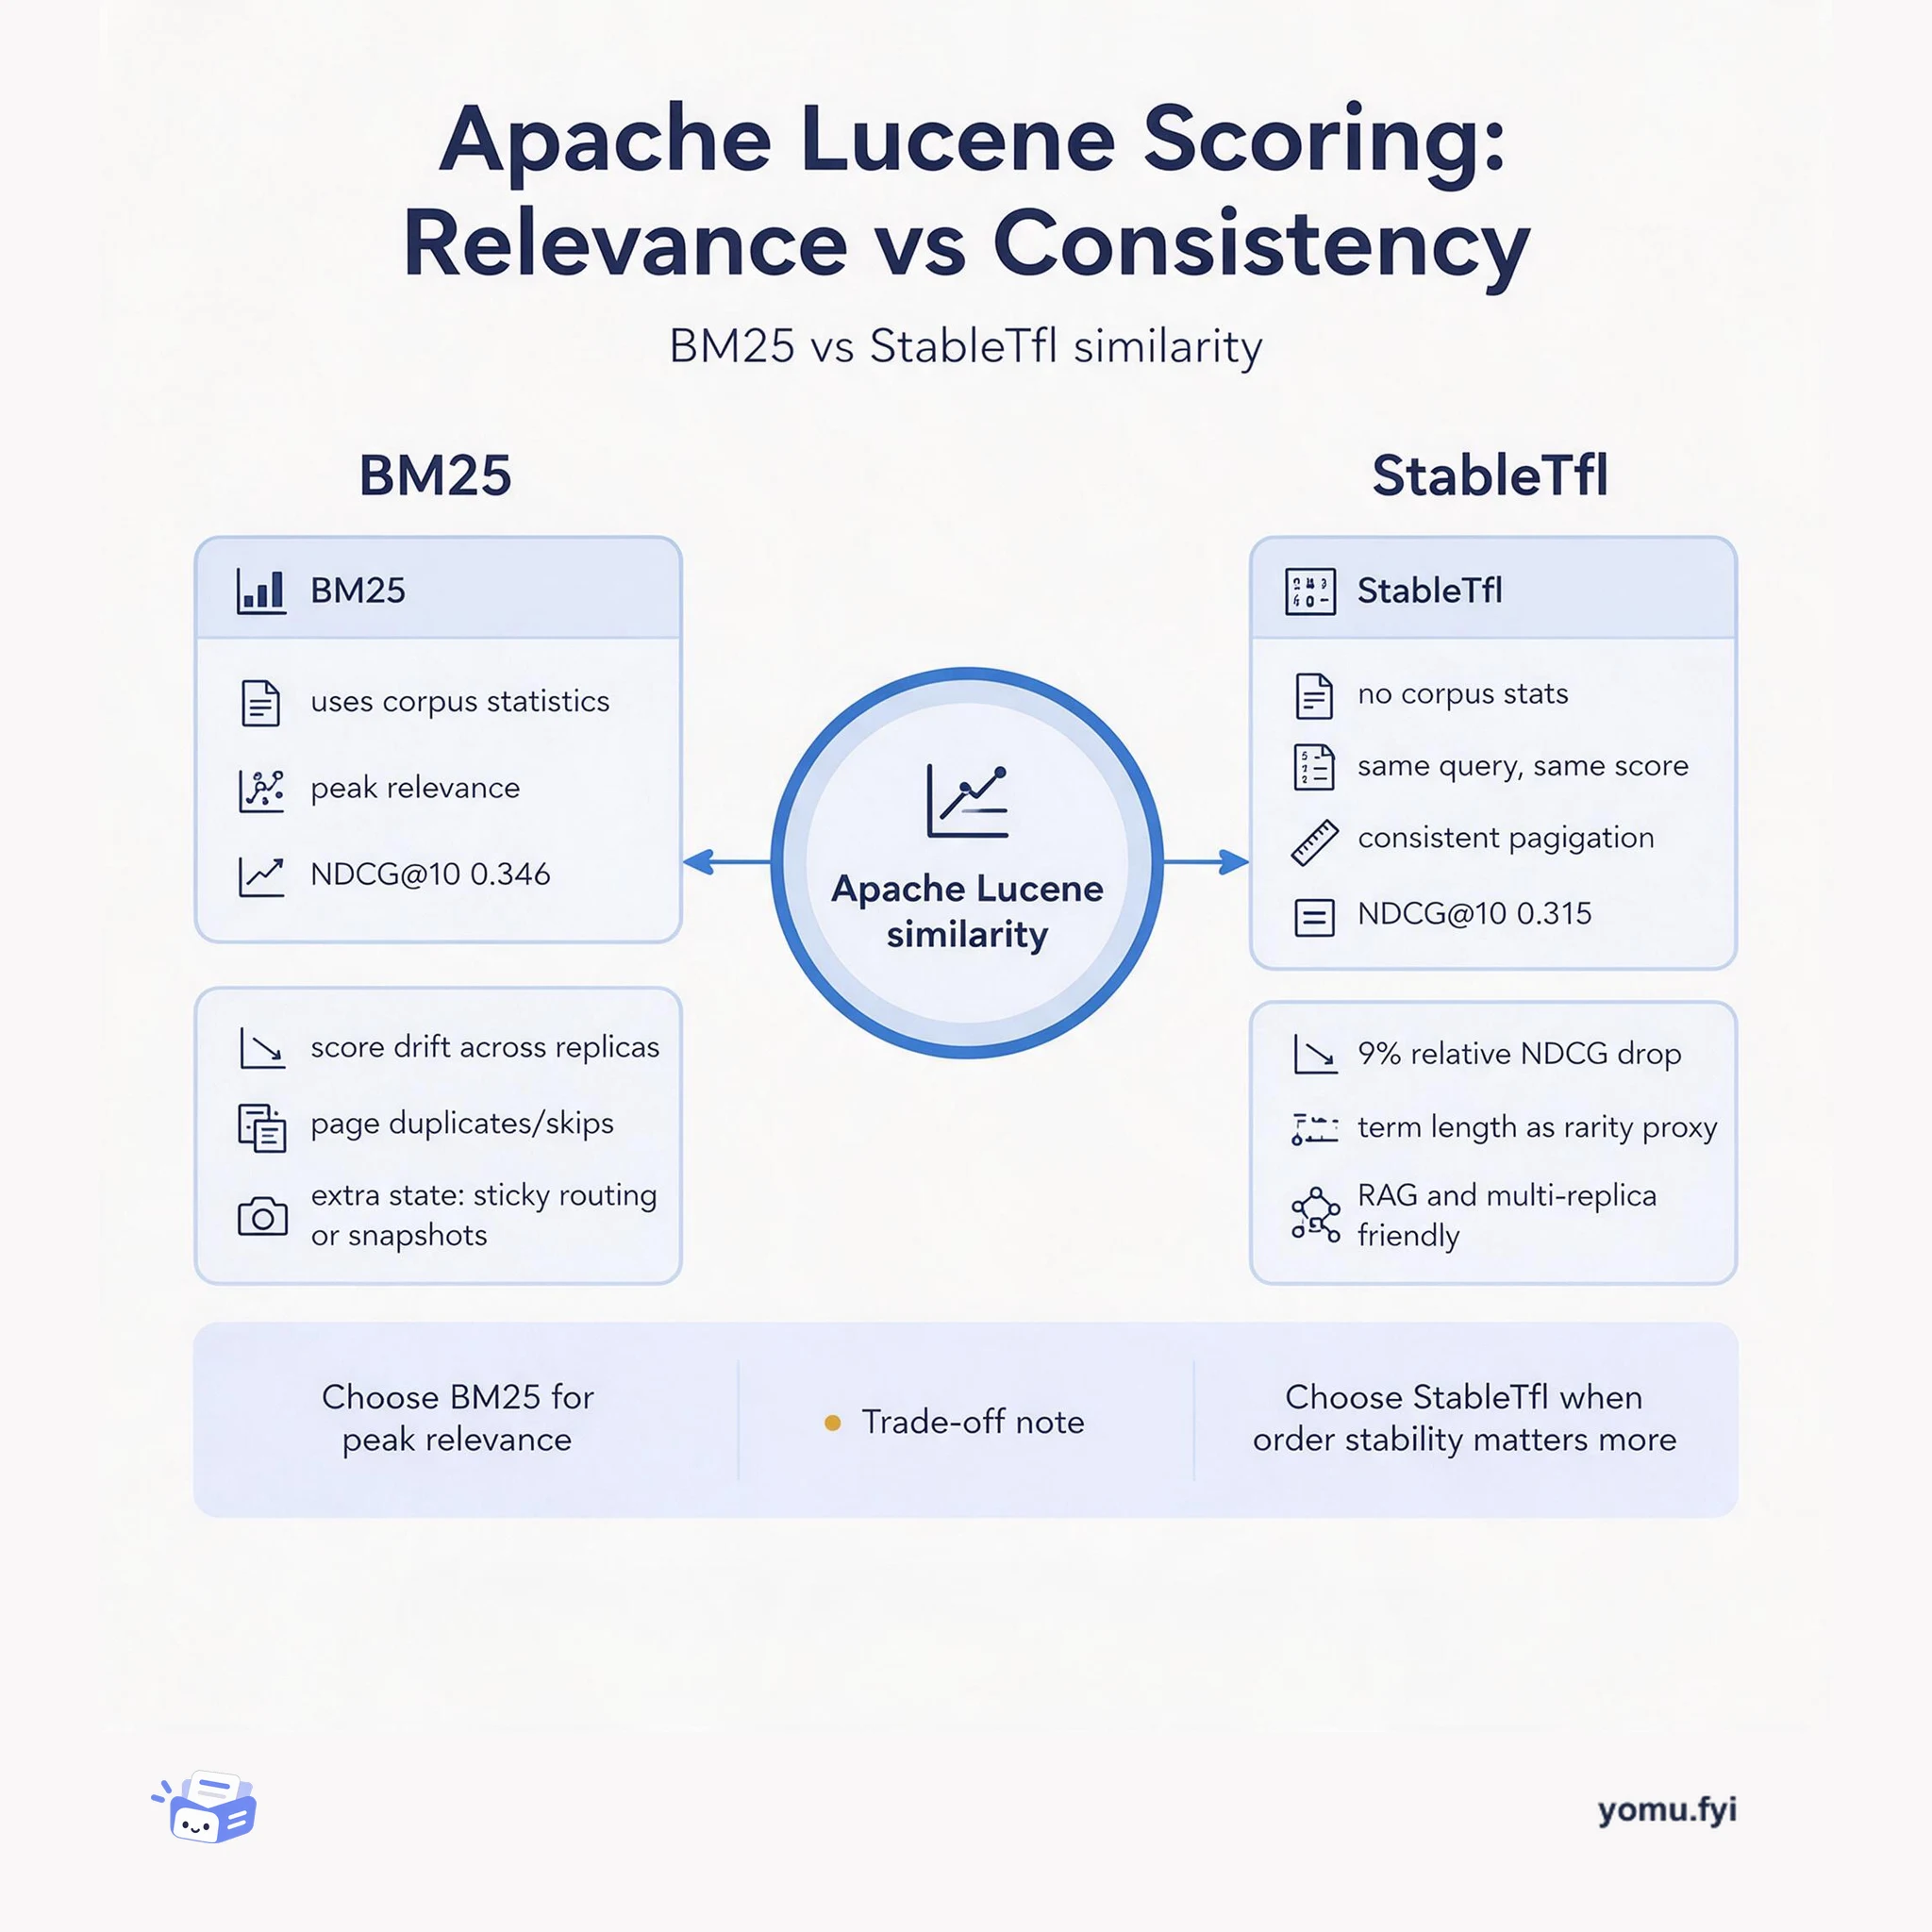
A comparison of Apache Lucene's BM25 scoring and StableTfl for paginated search: BM25 maximizes relevance, while StableTfl trades a small relevance drop for consistent ranking across replicas and pages.
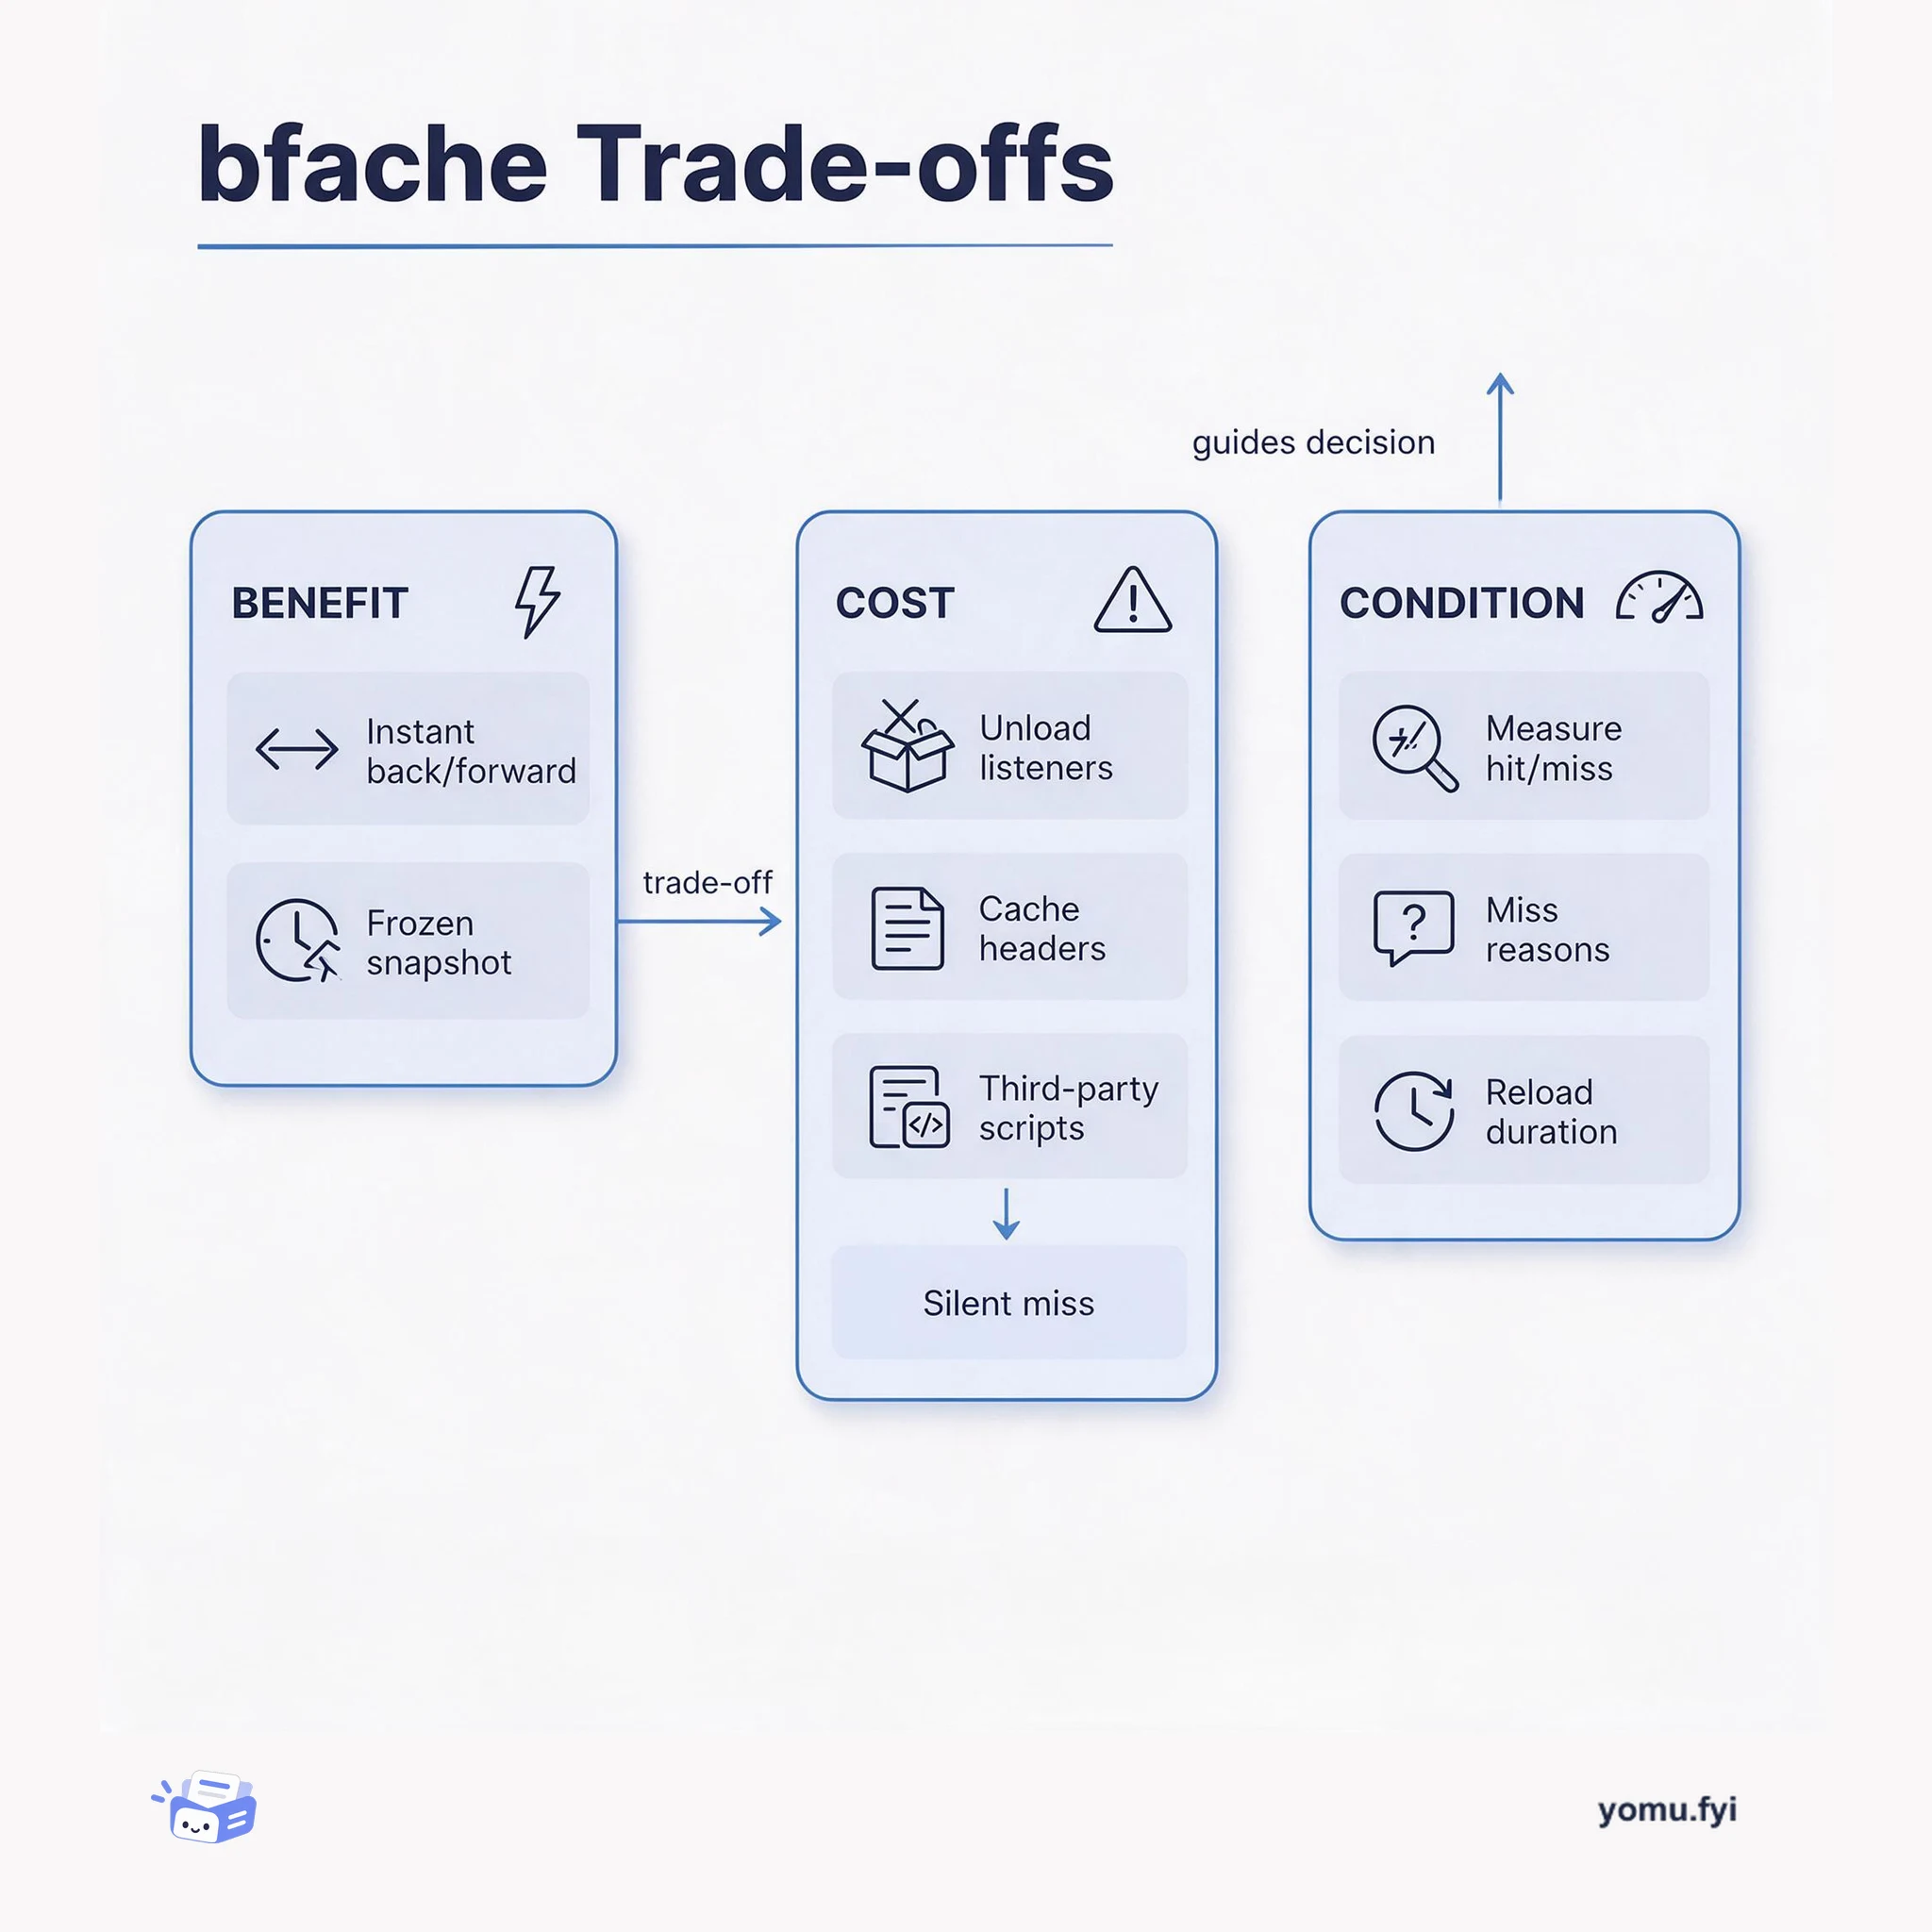
bfcache freezes page snapshots for instant back/forward navigation, but unload listeners, cache headers, or third-party scripts can silently disable it. This explainer maps the trade-offs and the metrics that reveal them.
The Good Stuff
Paid picks we use ourselves. Links carry a referral code — a subscription through one earns us a commission at no extra cost to you.
Newest first
Building enterprise-grade AI voice agents in production demands managing real-time latency, telecommunication networks, regional accents, compliance frameworks, and unpredictable customer behaviour—issues that standard text-based LLM benchmarks do not capture. The recommended approach combines Microsoft Azure for hyperscale infrastructure, Twilio for global communications, and WIZ.AI for localisation, so engineering teams avoid building low-level infrastructure and focus on unique business value. Field data from WIZ.AI across Asia reveals an ideal conversational response window of 500–800 ms, with a P90 latency under 2.0 s currently acceptable, and real-time code-switching support for languages like Singlish and Hinglish. Success metrics shift from pilot capability to commercial production benchmarks such as connection rate, recognition and tagging accuracy, and measurable business outcomes like Promise-to-Pay conversion. Engineering practices to maintain code quality include cross-model code reviews and strict pull-request line-count guardrails enforced by pre-commit hooks.
Uber Eats rebuilt its search pipeline after accumulated architectural decisions made latency increasingly costly across retrieval, hydration, ranking, ads, and presentation. The team changed its primary metric from backend API response time to Above-the-Fold completion, then introduced paginated responses with server-side caching and concurrent template rendering; these changes improved ATF by over 200 milliseconds. Other work removed low-yield retrieval strategies, grouped items by product identity to reduce lookups by over 100 times, split ranking and presentation hydration, eliminated false DAG dependencies, added request hedging, and redesigned ad data as column-oriented in memory. The combined effort cut search latency in half, including approximately 120 milliseconds from retrieval, 100-plus from hydration changes, and 130 from ads, while planned product-based search, zero-pass ranking, and streaming target further gains.
Adaptive Instructed-Retriever addresses the tension between retrieval quality and latency for enterprise data agents, especially on multi-hop questions that benefit from sequential search. It combines parallel single-step retrieval with bounded multi-step search, using a fixed upper limit and an adaptive stopping policy that spends extra steps only when they are likely to improve results. The model is trained with online reinforcement learning using CISPO, a reward that balances trajectory quality against search cost, and synthetic multi-hop data alongside Instructed-Retriever-1 data. Across seven held-out internal and external benchmarks, it matches leading third-party and open-source models while answering in 5.8 seconds, reported as more than twice as fast as the compared alternatives, and substantially improves over single-step search. Varying the step penalty produces checkpoints spanning different quality-latency tradeoffs for production workloads.
Conversational AI call-center latency can feel like dead air, and the delay may come less from LLM inference than from the infrastructure moving audio among telephony, media servers, ASR, the agent, and TTS. The described approach uses a unified voice path: ConversationRelay provides a WebSocket API to stream live call audio, handle speech-to-text and text-to-speech in one connected pipeline, connect with a backend agent, and support barge-in. It is model-agnostic, allowing teams to retain their LLM, knowledge bases, AI tools, and third-party voice providers, while Conversation Orchestrator, Conversation Memory, and Agent Connect address context and integration. Twilio’s internal benchmarks report median latency below 0.5 second and below 0.725 second at the 95th percentile, though relevance and context also matter alongside speed.
Modal’s legacy I/O plane routed all function inputs and outputs through us-east servers, adding up to ~200ms of network latency for calls from other regions. The new geographically distributed I/O plane, available in four or more regions, reduces end-to-end function call latencies by roughly 80ms at p50. The redesign involved moving non-critical work to background async processing, minimizing shared storage interactions on the hot path, and rewriting the server layer in Go for better concurrency. The team evaluated Valkey but chose Redis 7.1 because engine CPU usage spiked aggressively on Redis 7.2 onwards during input queue load testing. Users can further optimize by selecting the nearest routing_region, keeping input and output payloads under 2MiB to avoid blob storage uploads, and batching small inputs to reduce network hops.
DE Dost is a GenAI onboarding companion embedded in Swiggy’s delivery-executive app, designed for new DEs who receive information but lack confidence-building, immediate guidance. It supports questions in nine languages across SOPs, earnings, payouts, app navigation, shifts, and support, adapting detail and tone to conversational context. Before the first LLM call, a graph state assembles user context, preprocessing resolves references, and embedding-based semantic routing separates general knowledge-base questions from personal diagnostics. Retrieval uses authored QnA pairs plus hybrid semantic and lexical scoring to handle paraphrases and terms such as “MG” and “COD,” while guardrails constrain follow-ups to available knowledge. Evaluation spans about 800 cases per language across fleet and payout combinations, with macro accuracy trending at 90%+ and a target P50 latency of 4.5 seconds after reducing an initial 15-second pilot.
Modal introduces Servers, a low-latency HTTP serving solution designed for applications like LLM inference where milliseconds matter. Servers reduce p50 latency from 39ms to 6ms compared to Modal Web Functions by removing control-plane lookups and queuing from the hot path. The architecture uses a stateless proxy (fprs) for domain association and load balancing, with Envoy for TLS termination and HTTP/2 multiplexing. Two design principles governed development: maximizing resource sharing while minimizing interference, and making no network calls on the request path. The system supports autoscaling, regionalized routing, proxy authentication, and mirroring for A/B testing and continual learning.
Sandbox startup benchmarks measure container boot time, but in production application-level initialization after boot dominates, making container boot the smallest variable. Modal defines a lifecycle with events Created, Scheduled, Started, and Ready, where Ready indicates completion of tasks like git pulls or dependency installs. The gap between Started and Ready can be multiple seconds, directly affecting user-perceived latency for coding agents needing cloned repos and running services. To reduce perceived latency, Modal recommends warm pools that pre-initialize sandboxes using a Queue, combined with Directory Snapshots for per-project customization without rebuilding the environment. Readiness Probes, now generally available, allow defining a shell command that exits 0 or a TCP port that accepts connections, with wait_until_ready() blocking until the sandbox is truly ready, simplifying warm pool producer code and providing dashboard events for observability.
AI demonstrations fall into two categories: polished “Hollywood demos” and raw “real-world demos,” with the latter showing how customer-service AI agents perform under messy, complex interactions rather than edited presentation. Voice provides an especially demanding test because timing, tone, turn-taking, latency, interruptions, and real-time adaptation all shape the experience. At Pioneer, Paul Adams called Fin Voice live; within 90 seconds, it verified identity, retrieved account data, handled an interruption, offered options, completed the workflow, and sent a follow-up email. The demonstration exposed brief pauses for backend work, natural conversational flow, tone changes, and unscripted behavior, while later updates added voice customization, escalation guidance, deployment controls, integrations, support for 28 languages, and roughly 30–40% lower latency since launch.
Ben Johnson argues that SQLite should be considered as the core data and persistence layer for many production full-stack applications, rather than being relegated to unit tests in an n-tier architecture. He attributes this case to cheaper, faster hardware and the fact that most successful applications will never approach terabyte-scale data, making distributed database infrastructure excessive for some workloads. Litestream works alongside standard SQLite by taking control of WAL-mode journaling, capturing WAL updates, replicating them to storage such as S3, and handling checkpoints itself. This preserves ordinary SQLite libraries and transactions while providing a path to restore copies and improve resilience to storage failure; upcoming direct database-to-database replication is also mentioned. The resulting model places data in the application process, where the post reports 10–20 microsecond per-query latency, but it remains aimed at single-node applications and has restore, deployment, and replication-guarantee limitations.
LiveView sends HTML fragments over a WebSocket connection, allowing Phoenix applications to update the DOM in response to server or user activity. For interactions such as a like button, however, a server round trip can make feedback feel slow: a sub-100ms sequence may be acceptable, while many interactions benefit from responses under 40ms. The post presents client-side state prediction as one remedy, where the browser displays an expected value immediately and later reconciles it with the server. Its preferred “boring” alternative is reducing round-trip time by running application processes near users in multiple cities, connecting Phoenix instances over a private network and enabling clustering. A seven-region Counter deployment is shown with fly regions set and fly scale count 7, while Phoenix.PubSub and Phoenix.Presence handle clustering transparently.
The best engineering reads, once a week.