The Claude Platform now supports native OpenTelemetry export to Databricks MLflow, enabling developers to trace agent executions. Traces record model requests and tool calls as spans, ingested via Zerobus and stored in Unity Catalog tables linked to MLflow experiments. Setting up requires creating an experiment with Unity Catalog trace storage, configuring native export with a table-scoped OAuth token, and running a task to inspect traces. Developers can debug unexpected answers by analyzing traces with Genie Code, which identifies missing context or failed tool calls, and MLflow Issues detects recurring problems across traces. Agent Evaluation compares baseline and revised agents using the same traces to measure improvements or regressions, with domain experts able to review traces via Review Queues.
Context
Agent behavior can be opaque: a plausible answer may hide missing findings or repeated reads, and the answer alone does not explain why. Traces provide visibility into model and tool calls to investigate failures.
Approach / What changed
The integration uses native OpenTelemetry export from Claude Platform to Databricks MLflow. Developers create an MLflow experiment with Unity Catalog trace storage, configure native export with a table-scoped OAuth token, and run tasks to inspect traces. MLflow provides tools like Genie Code for analyzing traces, Issues for detecting recurring problems, Review Queues for domain expert feedback, and Agent Evaluation for comparing agent versions.
Takeaways
1
Claude’s native OpenTelemetry traces record model requests and tool calls as spans, ingested via Zerobus and stored in Unity Catalog tables linked to MLflow experiments.
2
MLflow Issues uses Genie Code to identify recurring quality and operational problems across traces, such as repeated searches or missing arguments, and can be scheduled for ongoing detection.
3
Agent Evaluation allows comparing baseline and revised agents using the same traces and LLM judges to measure improvements or regressions, with side-by-side scores and trace evidence.
FAQ
How do I set up native OpenTelemetry export from Claude to Databricks MLflow?
Create an MLflow experiment with Unity Catalog trace storage, configure native export using your workspace ID, region, and spans table with a table-scoped OAuth token, then run a task and inspect traces in the experiment.
What can I do with traces in MLflow to debug my Claude agent?
Use MLflow's Analyze trace action with Genie Code to examine execution and identify missing context, failed tool calls, or expensive steps. MLflow Issues detects recurring problems across traces, and Review Queues let domain experts assess responses.
How can I evaluate changes to my Claude agent using traces?
Run MLflow Agent Evaluation on Claude traces with LLM judges to test whether changes to prompts, skills, or tools improve or regress the agent. Compare evaluation runs side by side in the MLflow UI.
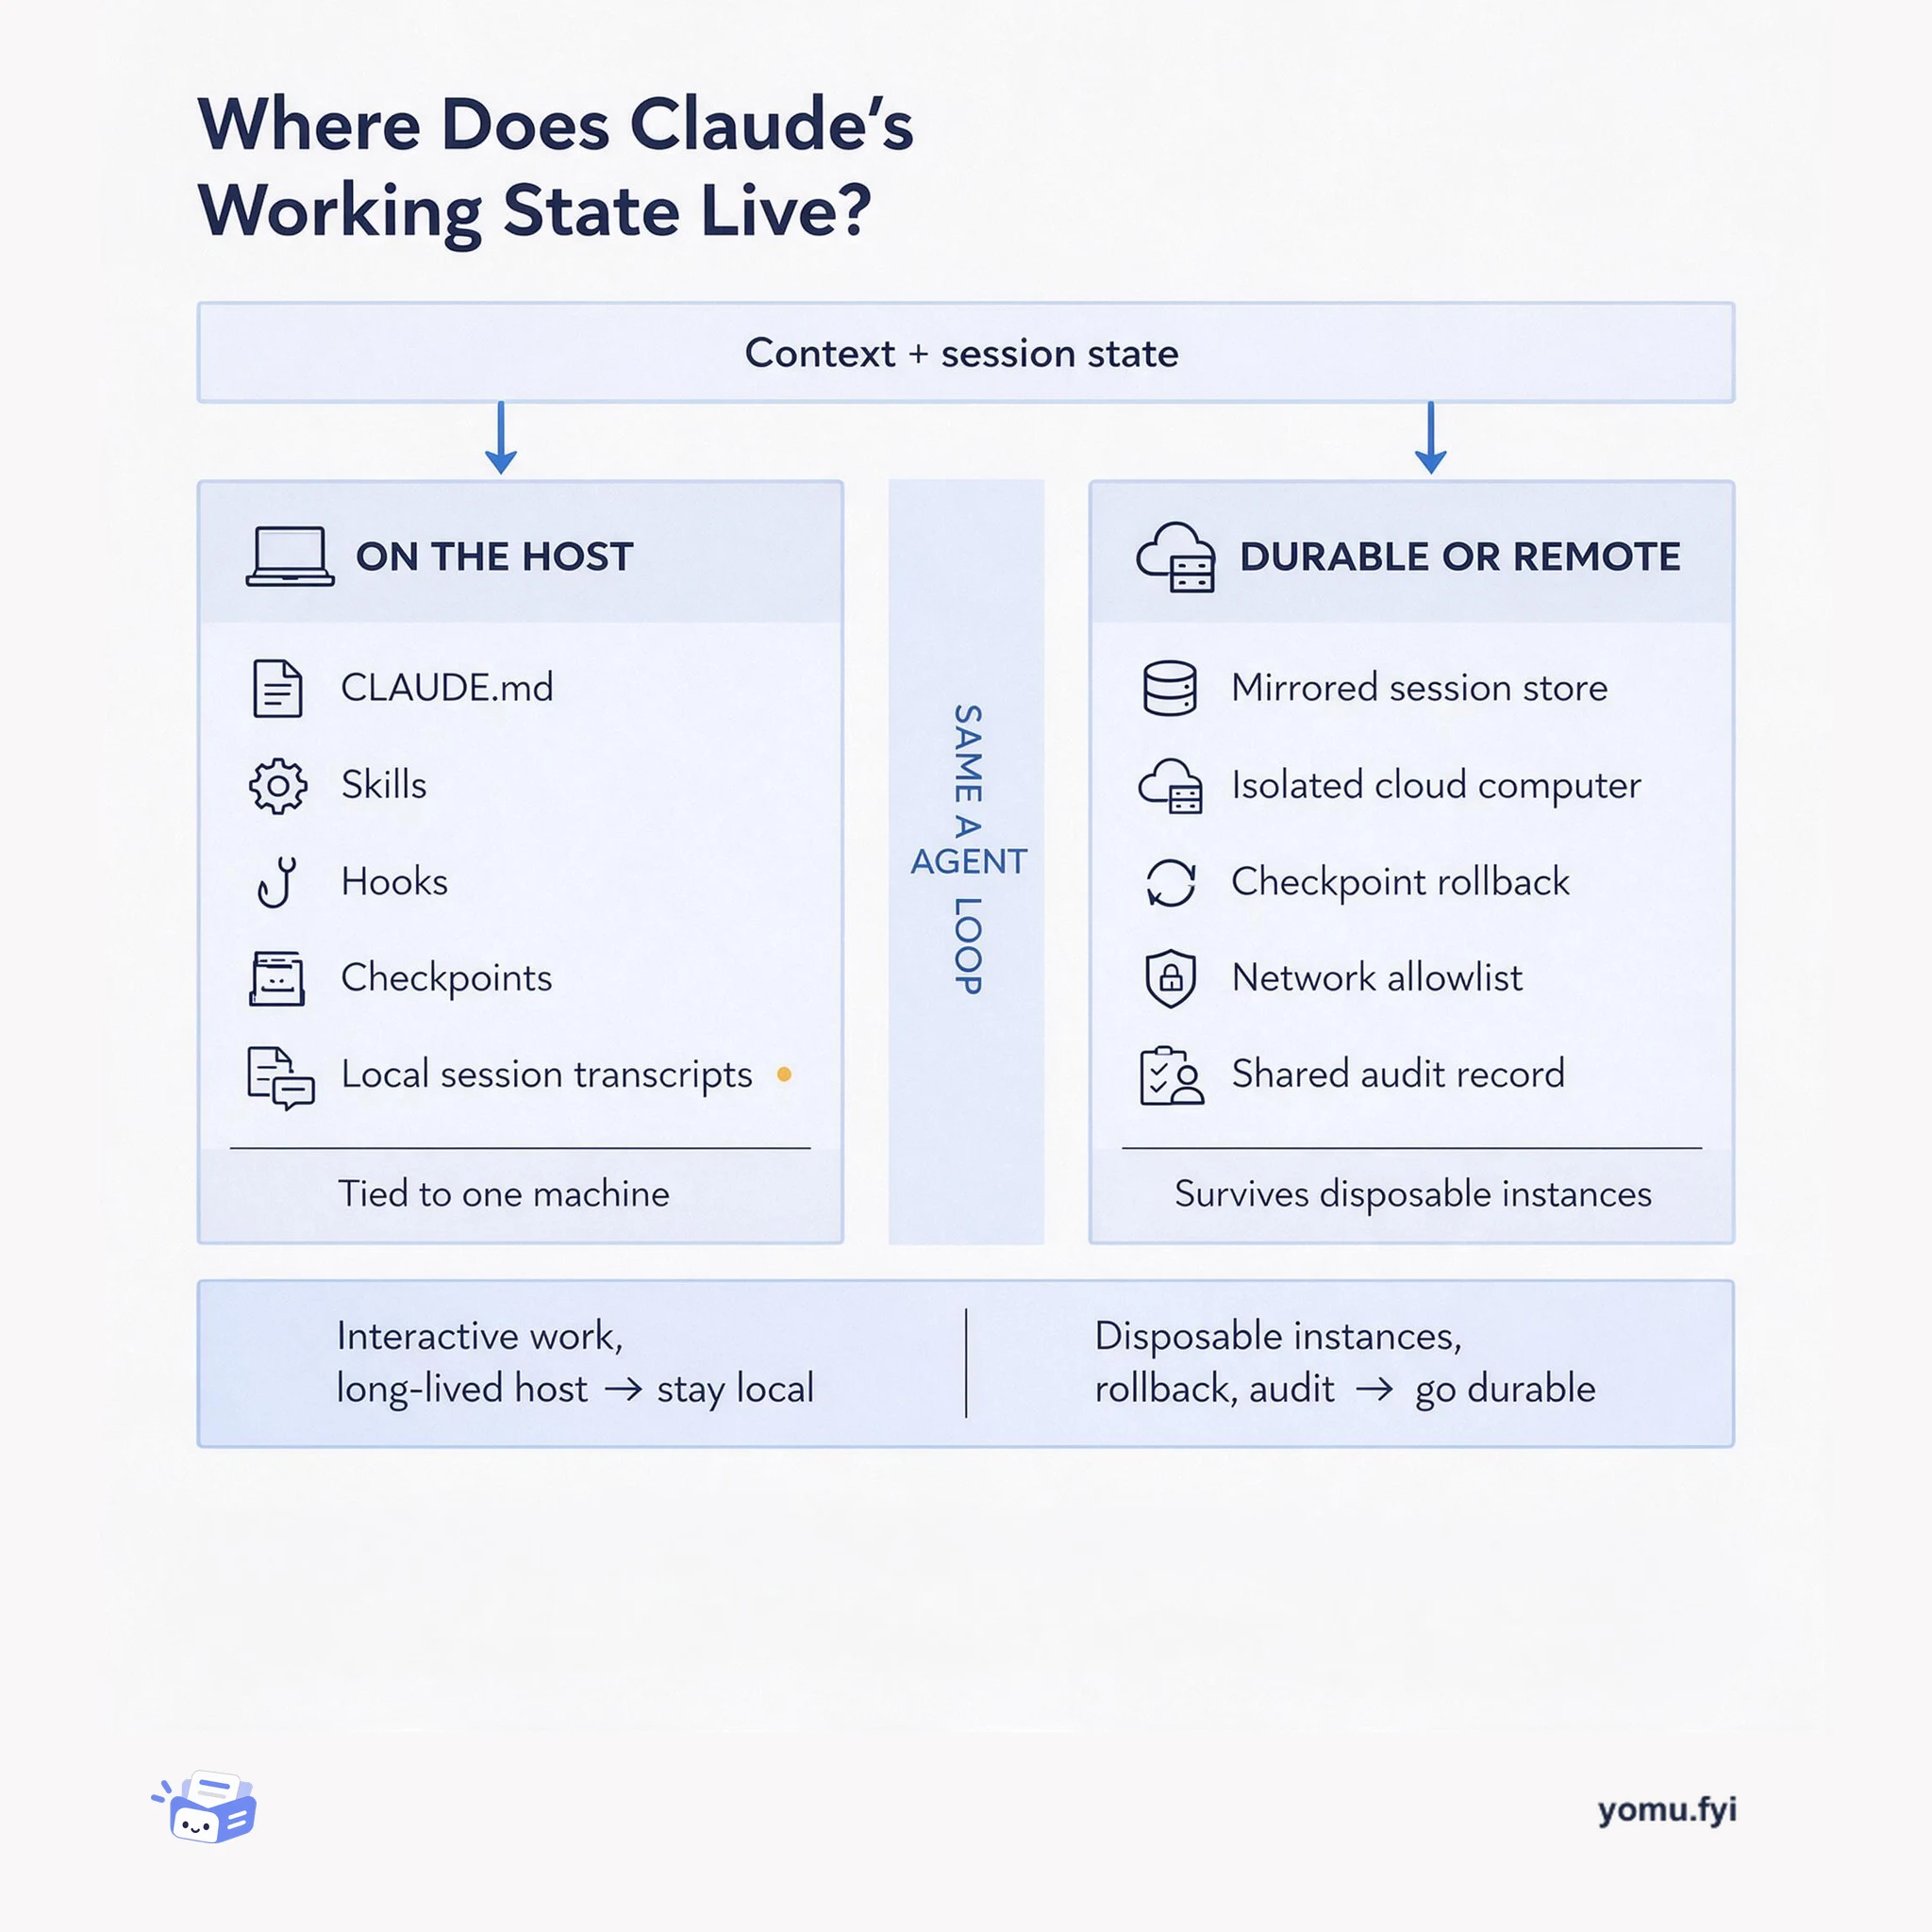
Compare two places to keep Claude's working state: curated files on your own machine versus a durable session store or isolated cloud computer, and learn which one fits your deployment.
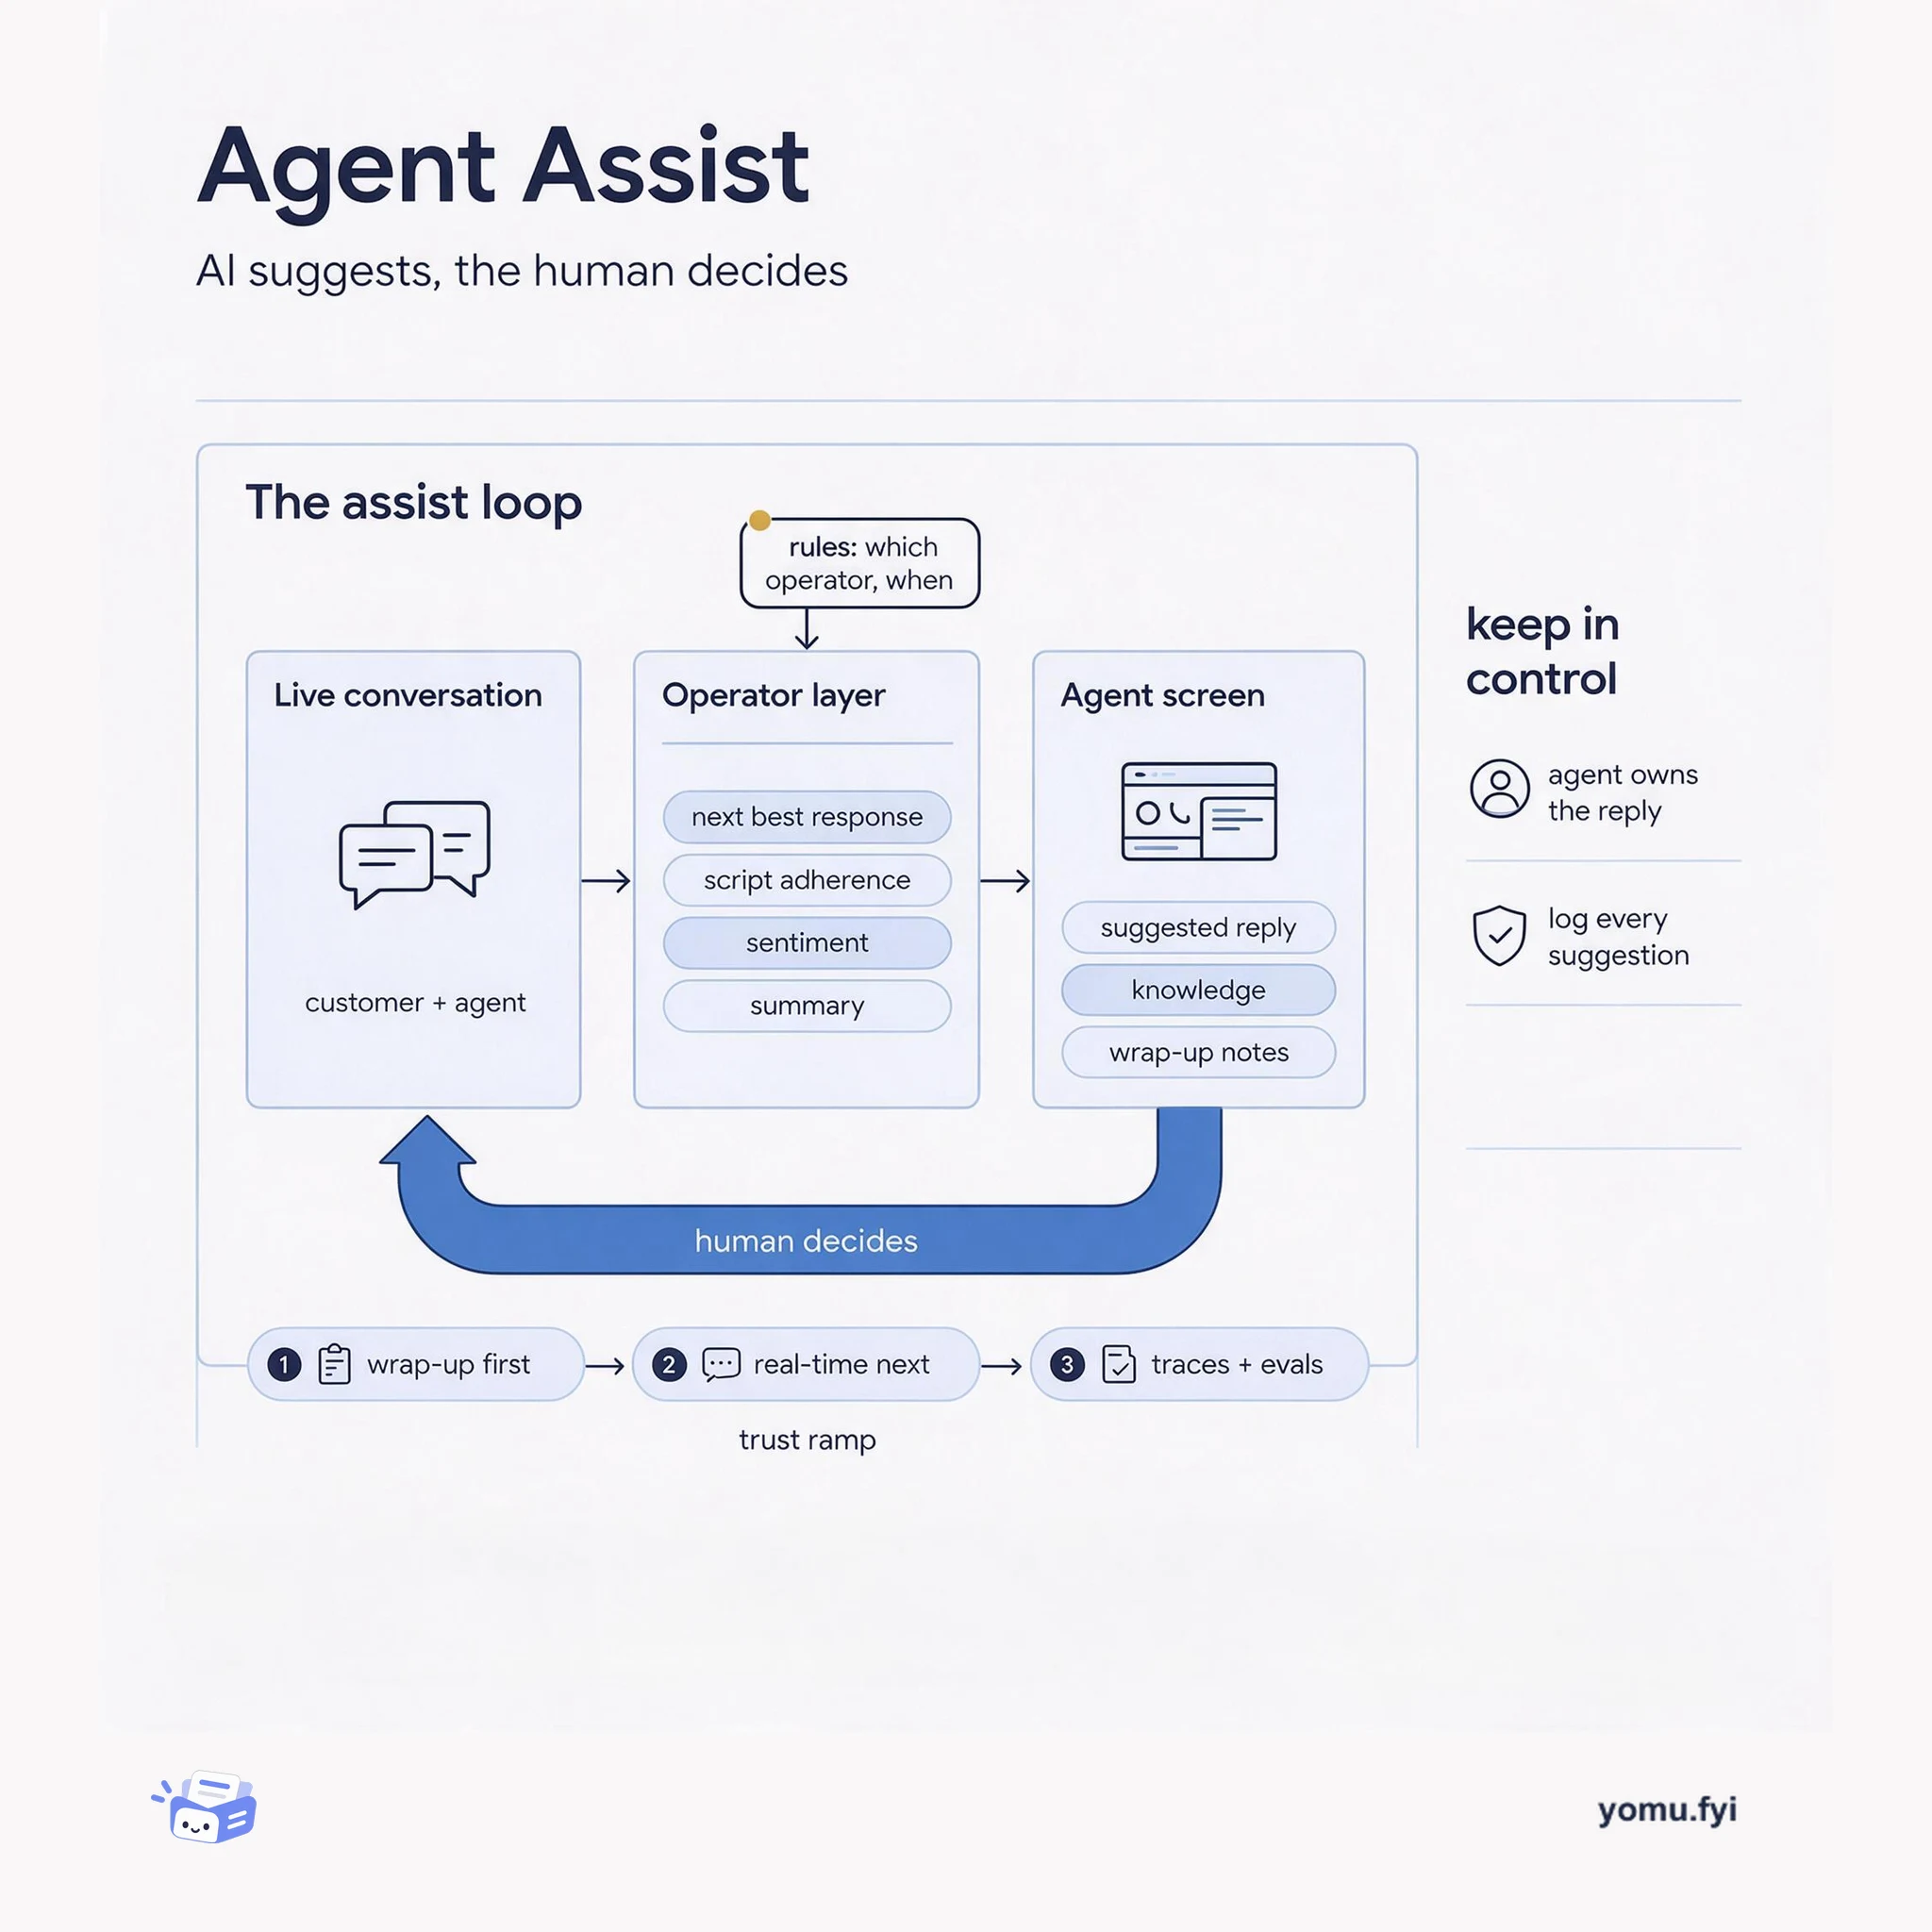
Agent assist is AI that feeds a human agent suggestions, knowledge, and wrap-up work during a live conversation. This diagram shows the loop that decides what runs, when, and who stays in control.
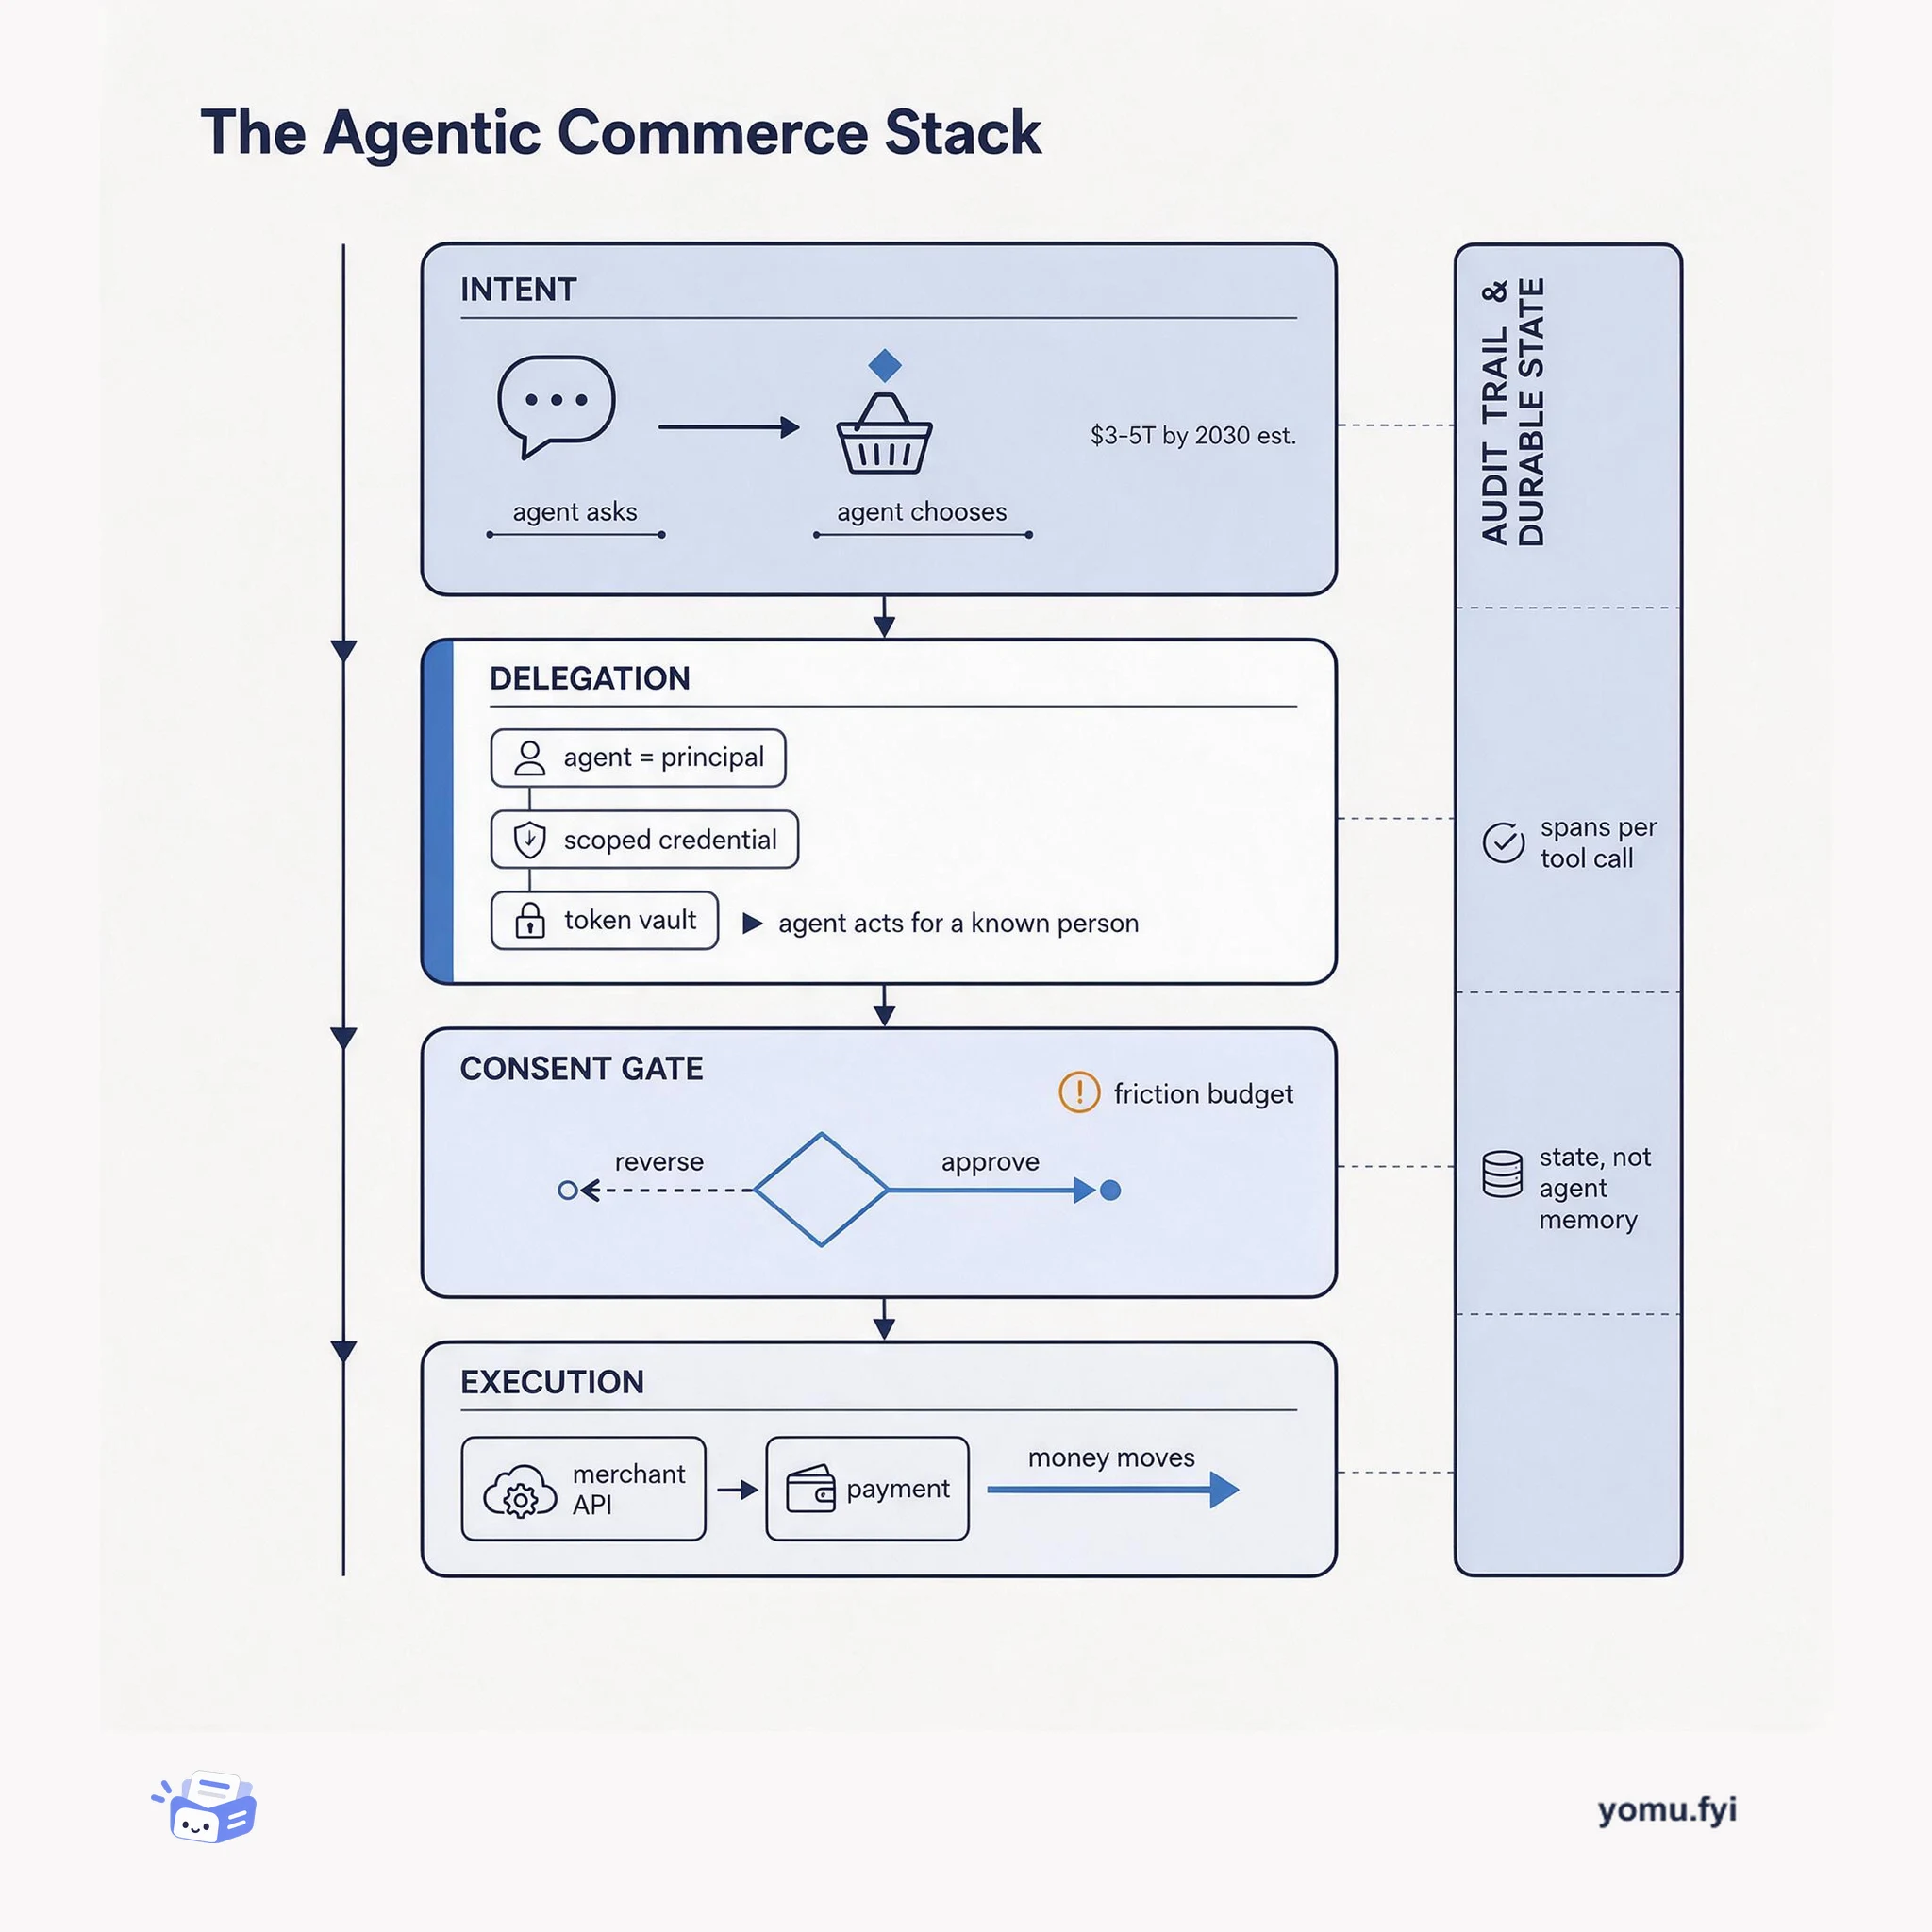
Agentic commerce works only when a shopper's agent can be identified, scoped, and audited at each step. This architecture map shows the delegation, consent, and audit layers that make an agent's purchase safe.
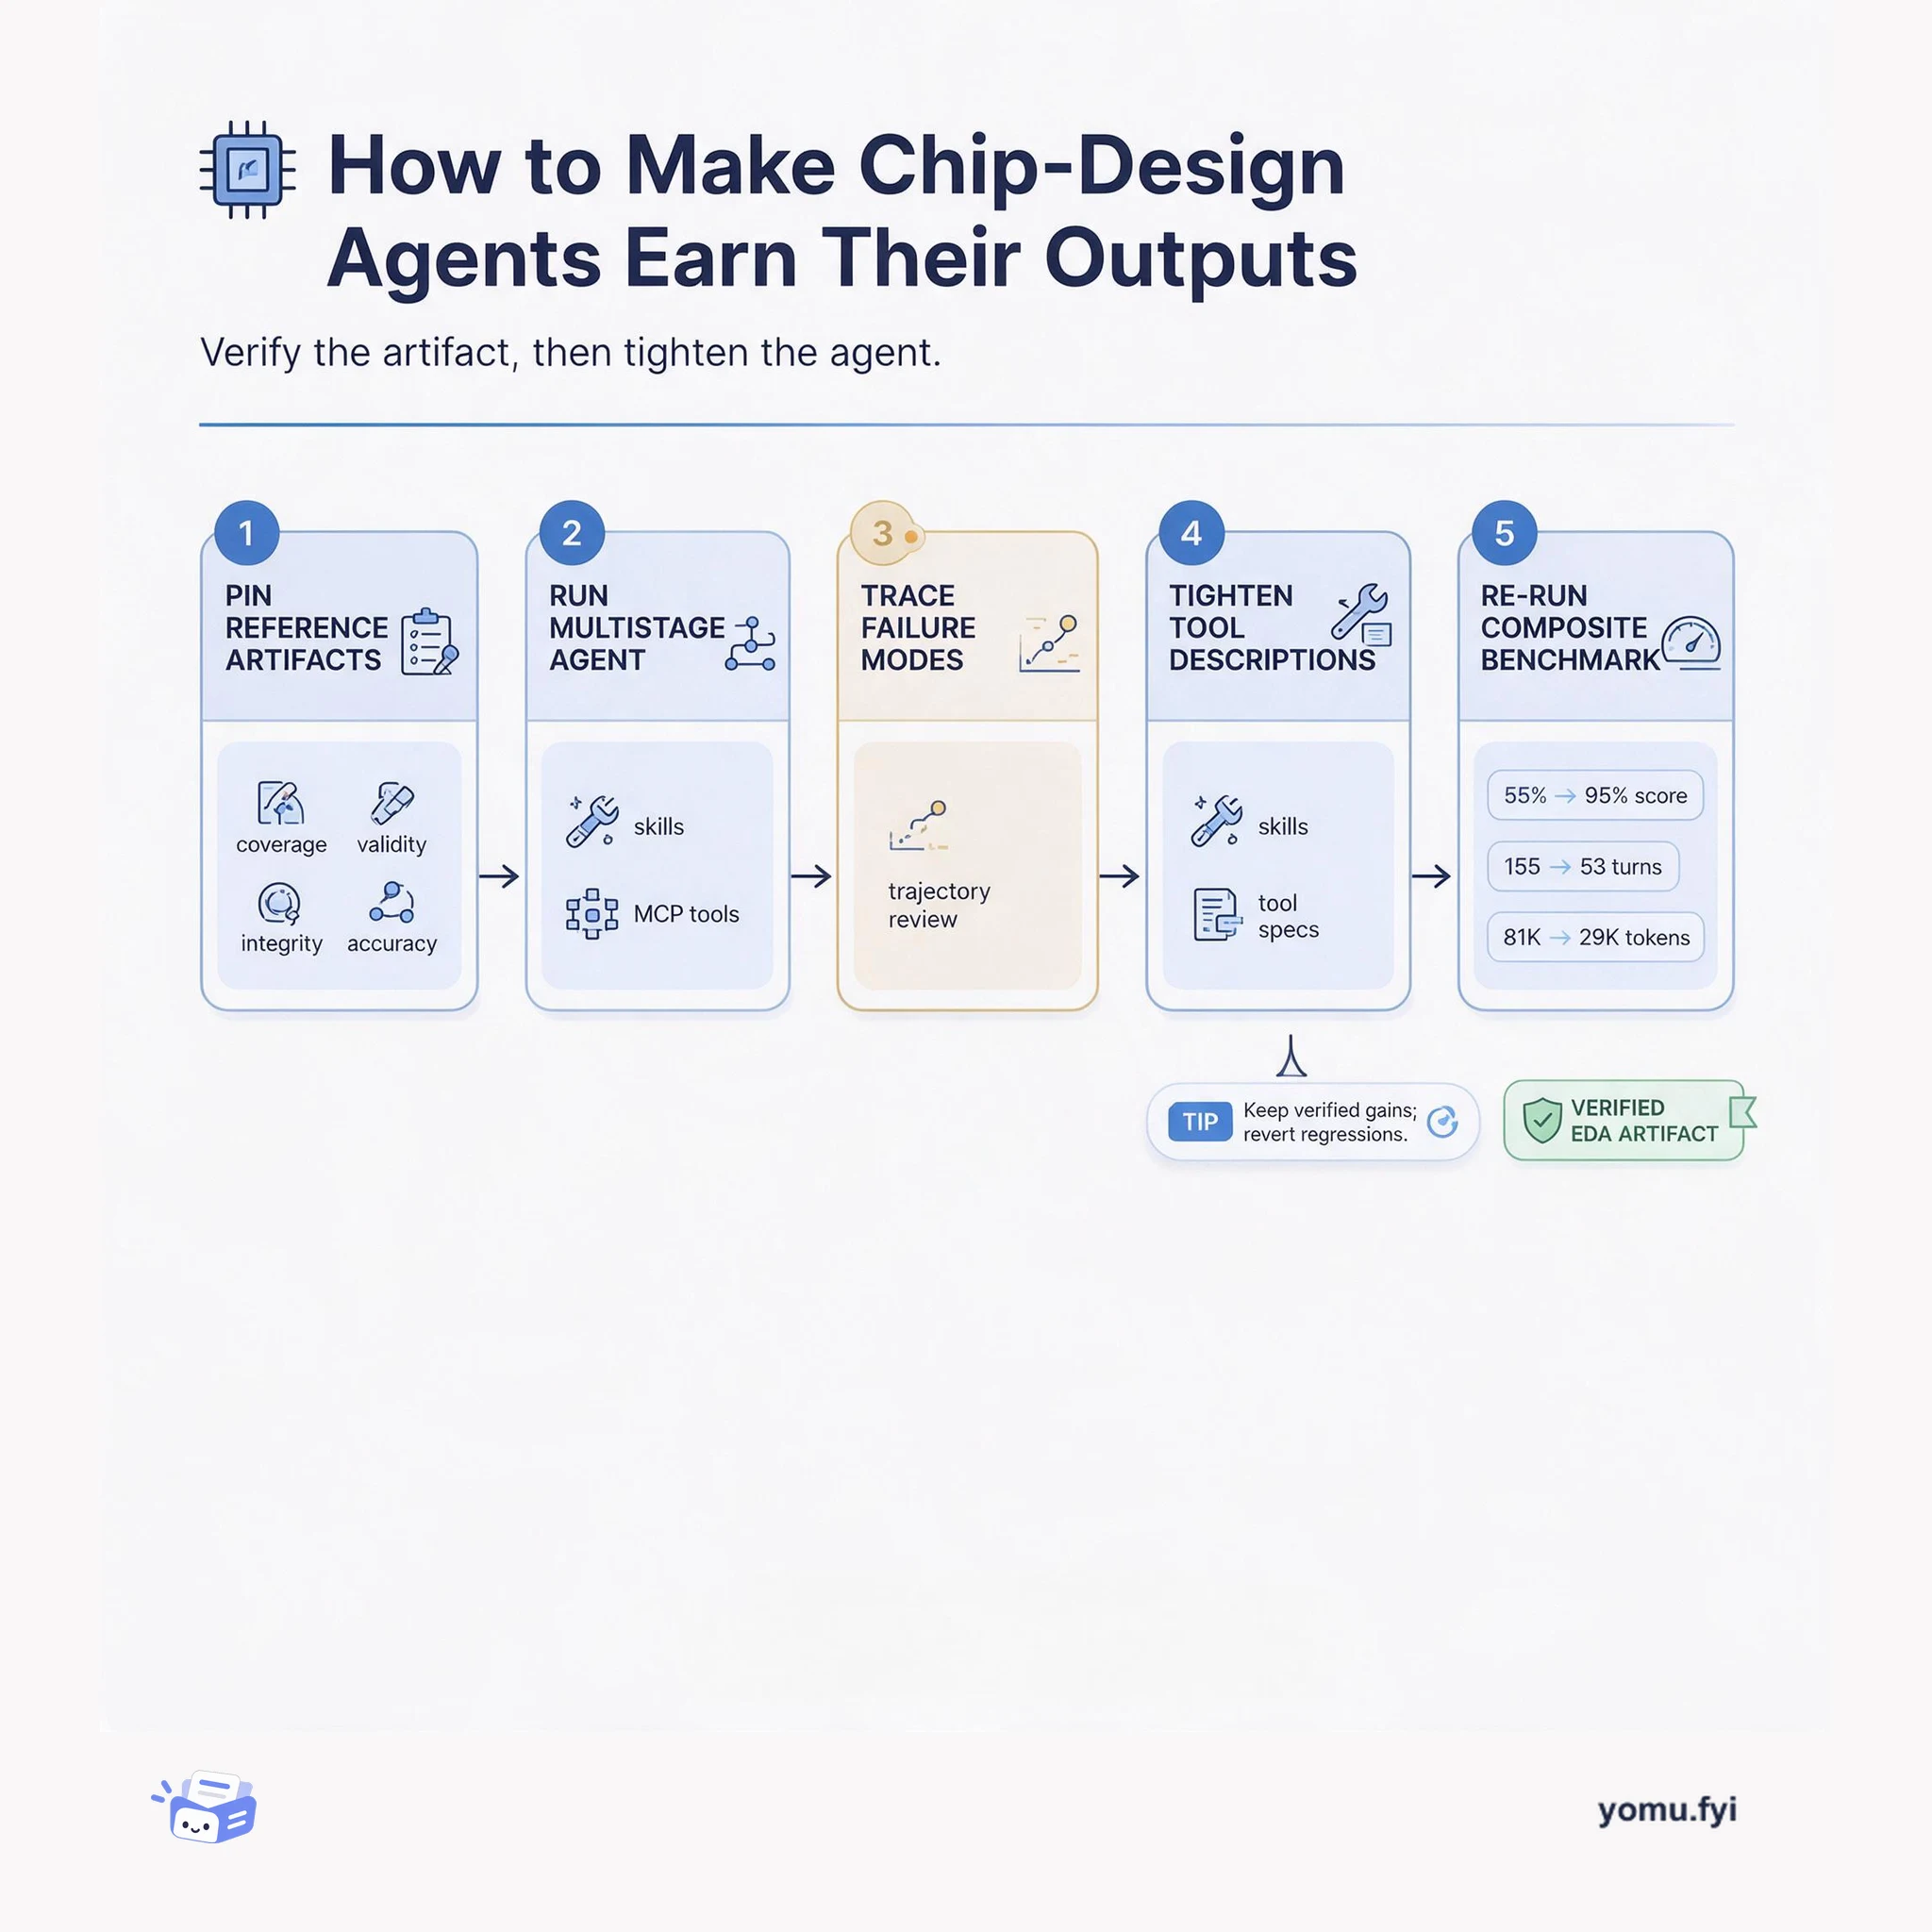
A five-checkpoint loop for chip-design teams: pin reference artifacts, trace multistage agent runs, refine tool descriptions, and re-run a composite benchmark so outputs are verified, not merely plausible.
Keep reading
Related reading
The Good Stuff
Paid picks we use ourselves. Links carry a referral code — a subscription through one earns us a commission at no extra cost to you.