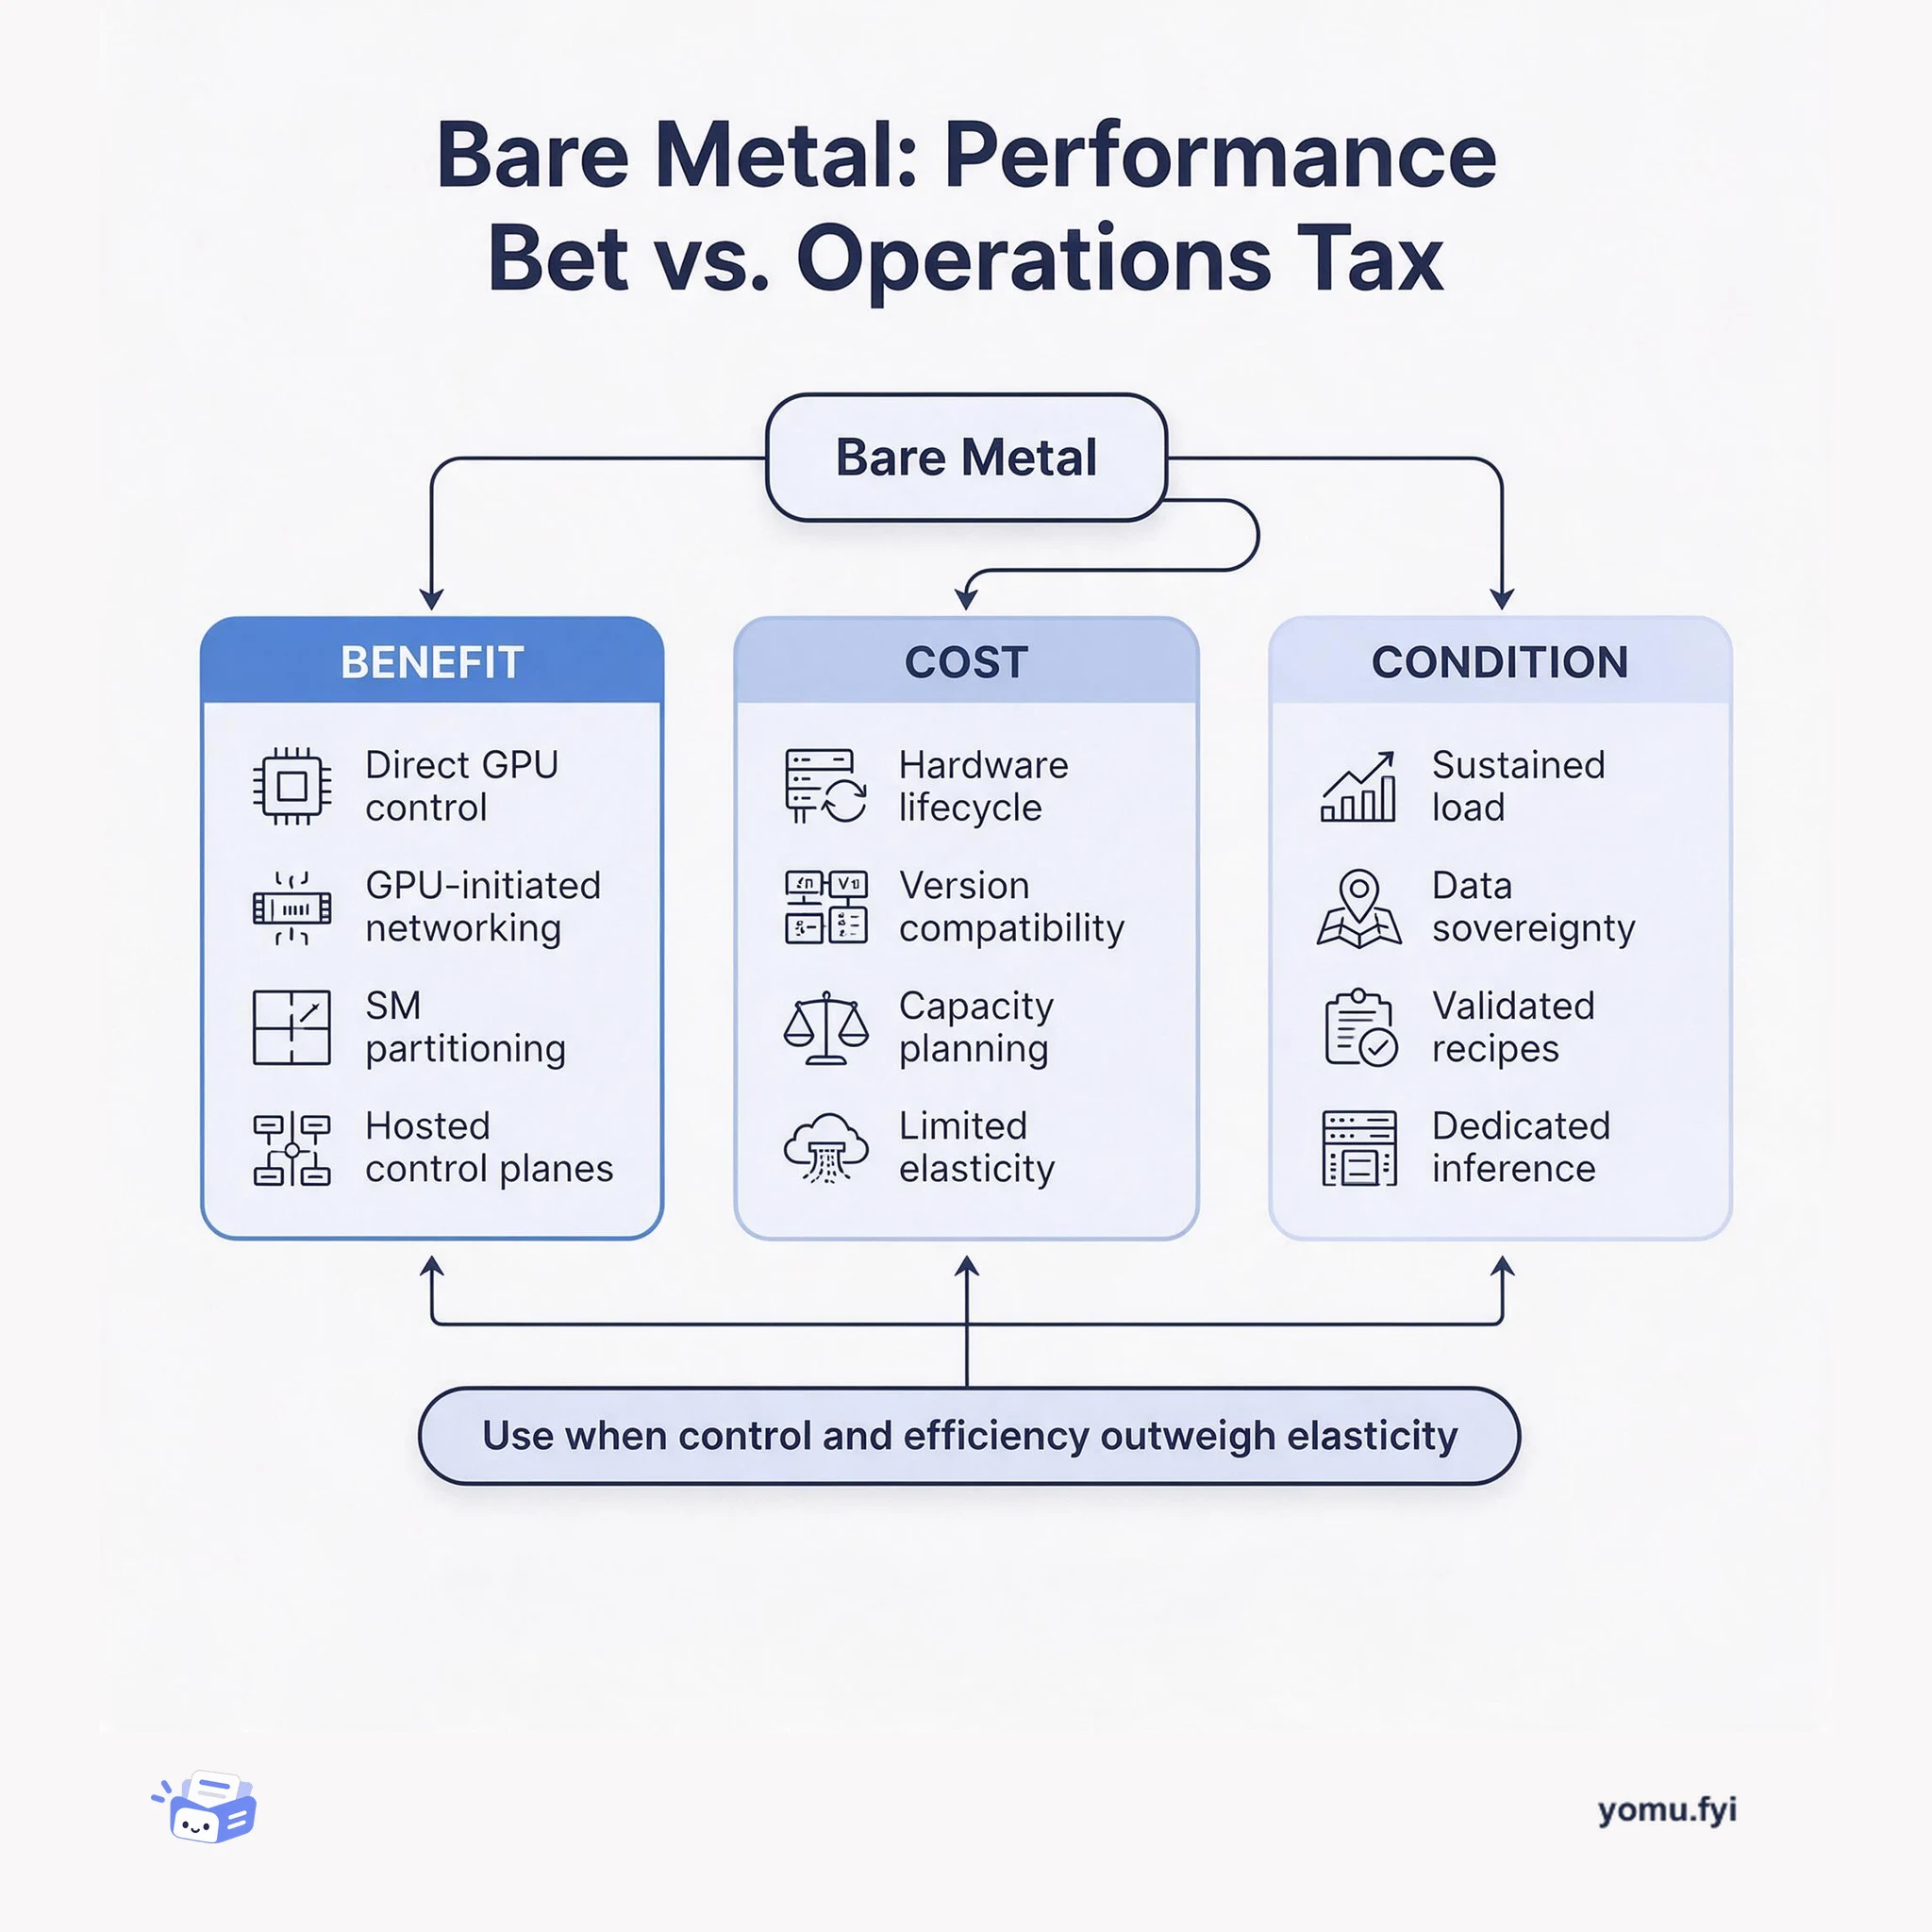
Bare Metal: Performance Bet vs. Operations Tax
Bare metal gives engineers direct control over GPU, network, and virtualization layers, but it shifts elasticity and lifecycle work onto the team. This trade-off map shows when that bargain pays off.
Loading…
Topic
812 posts about Performance. Every summary links to the original.
See the idea
Bare metal gives engineers direct control over GPU, network, and virtualization layers, but it shifts elasticity and lifecycle work onto the team. This trade-off map shows when that bargain pays off.
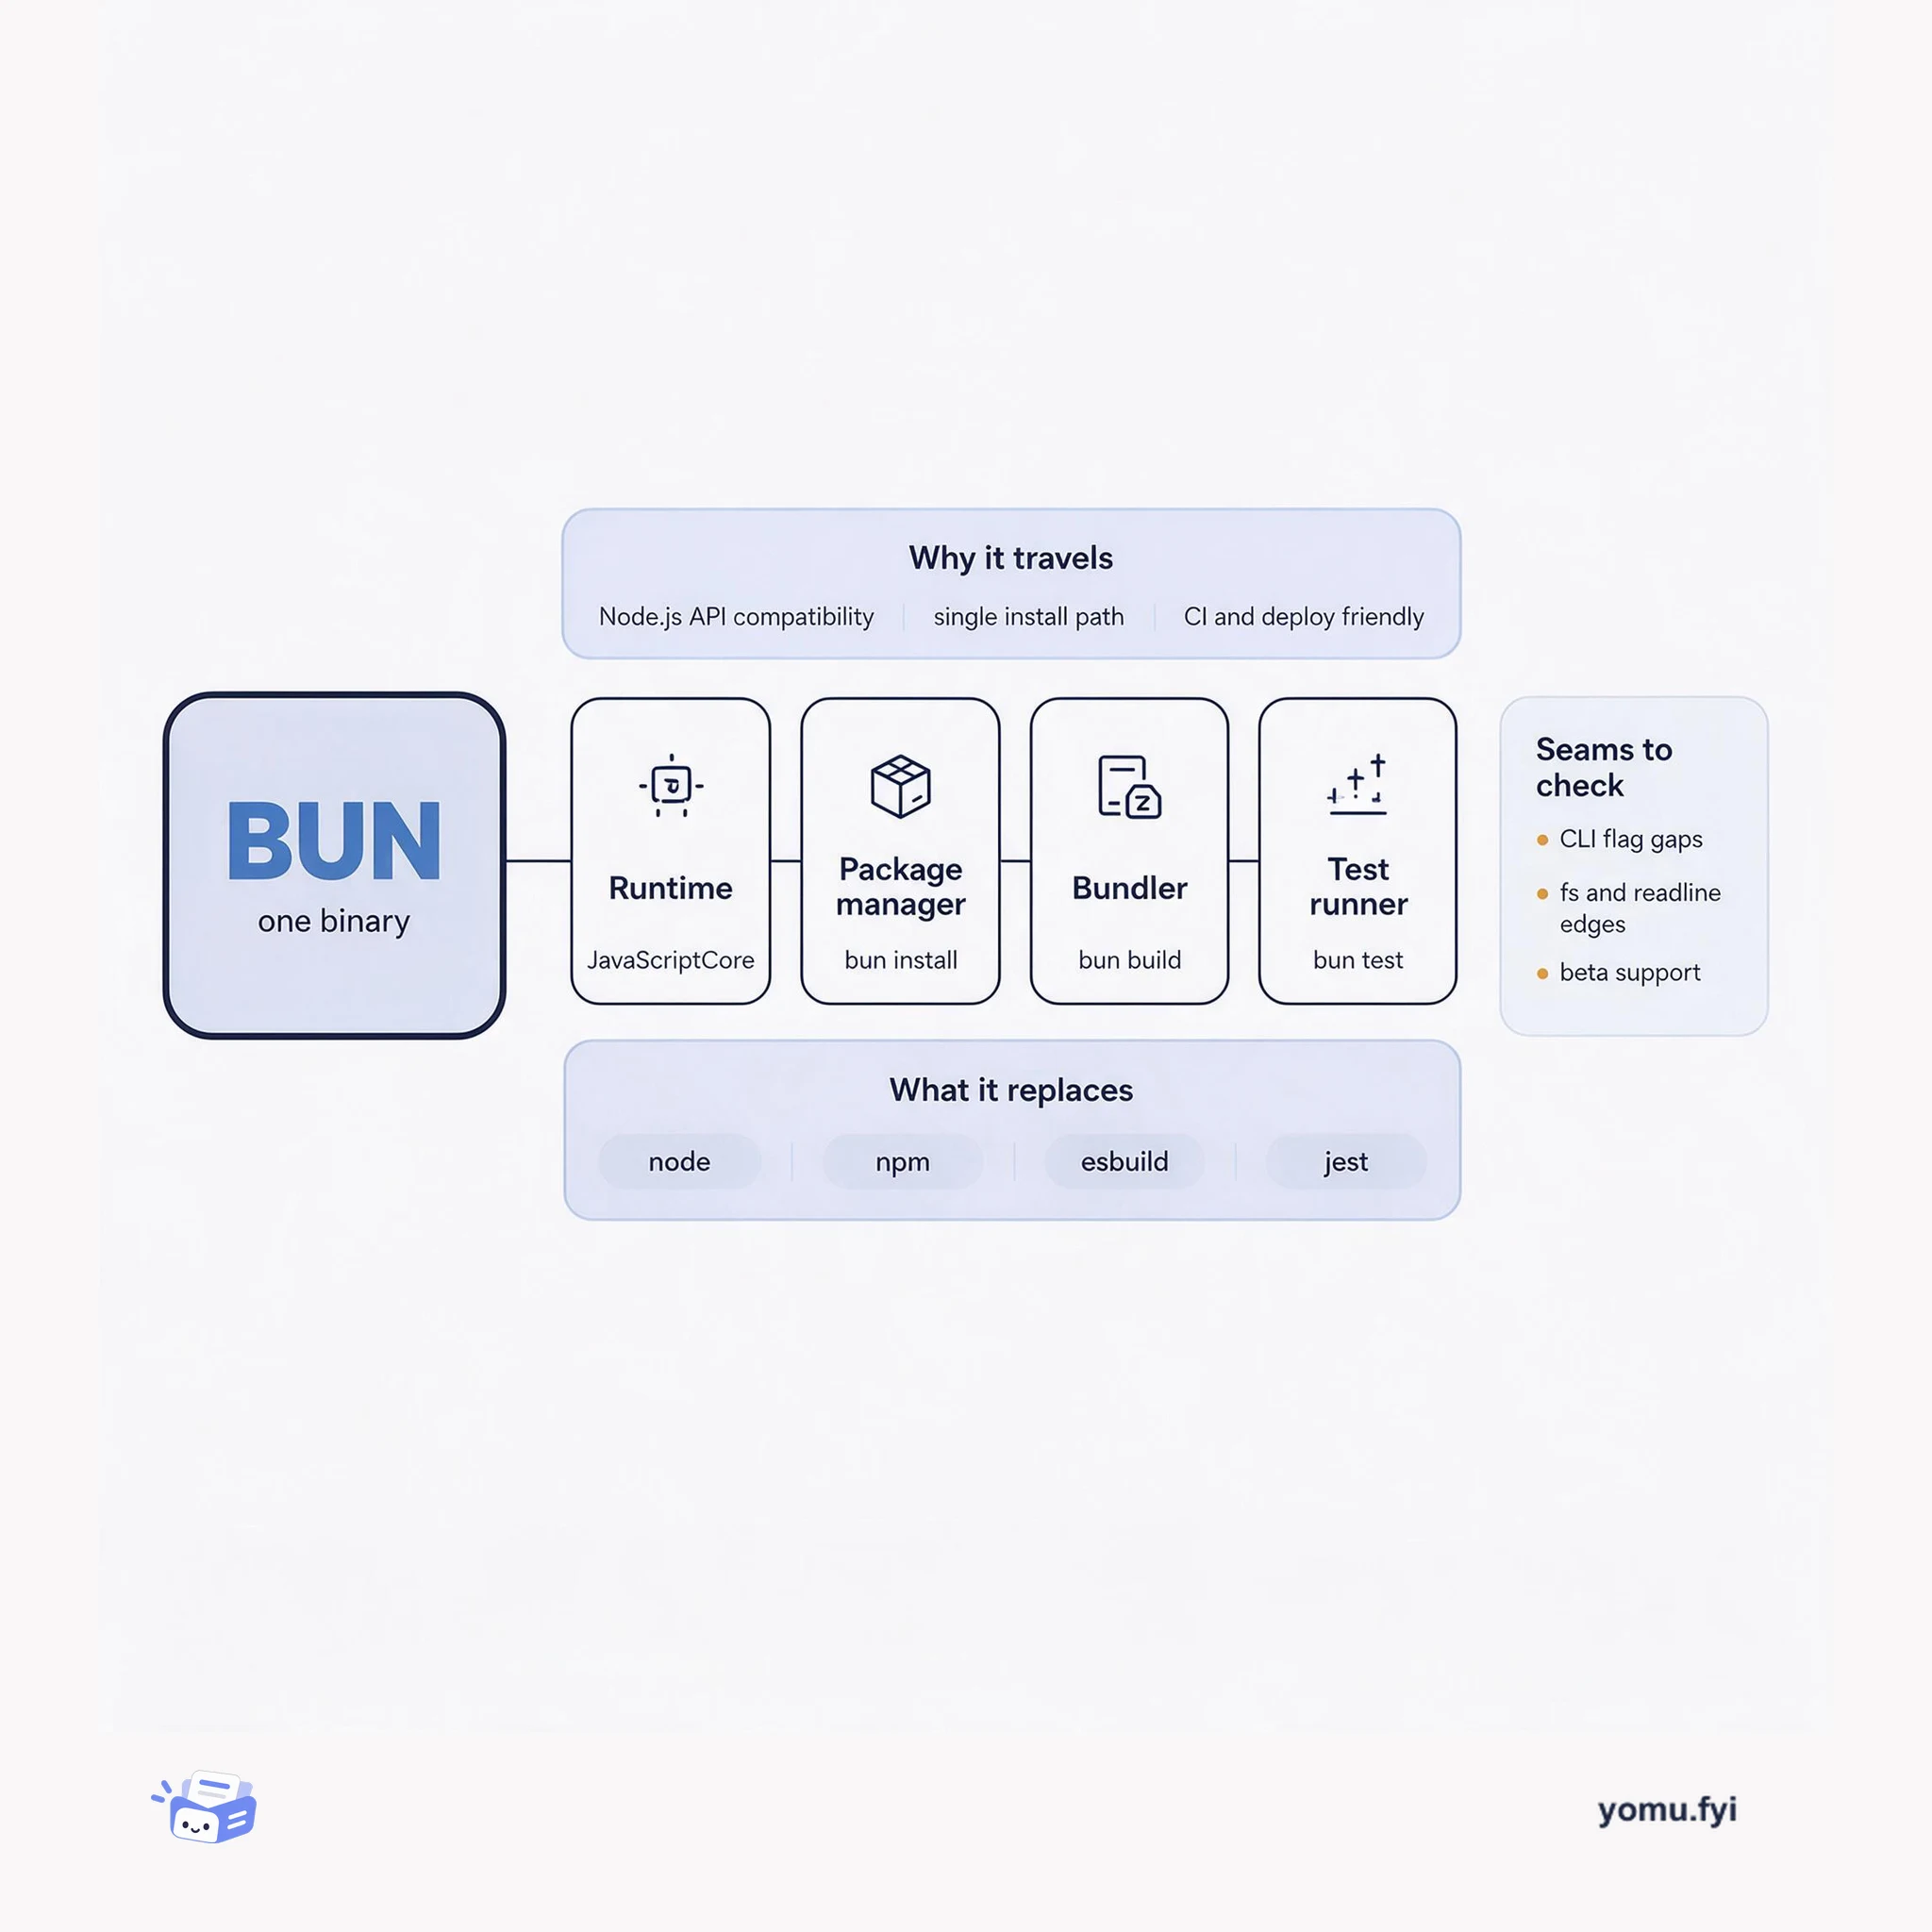
Bun packs a runtime, package manager, bundler, and test runner into one binary. Here is how those four parts fit together and where the seams still show.
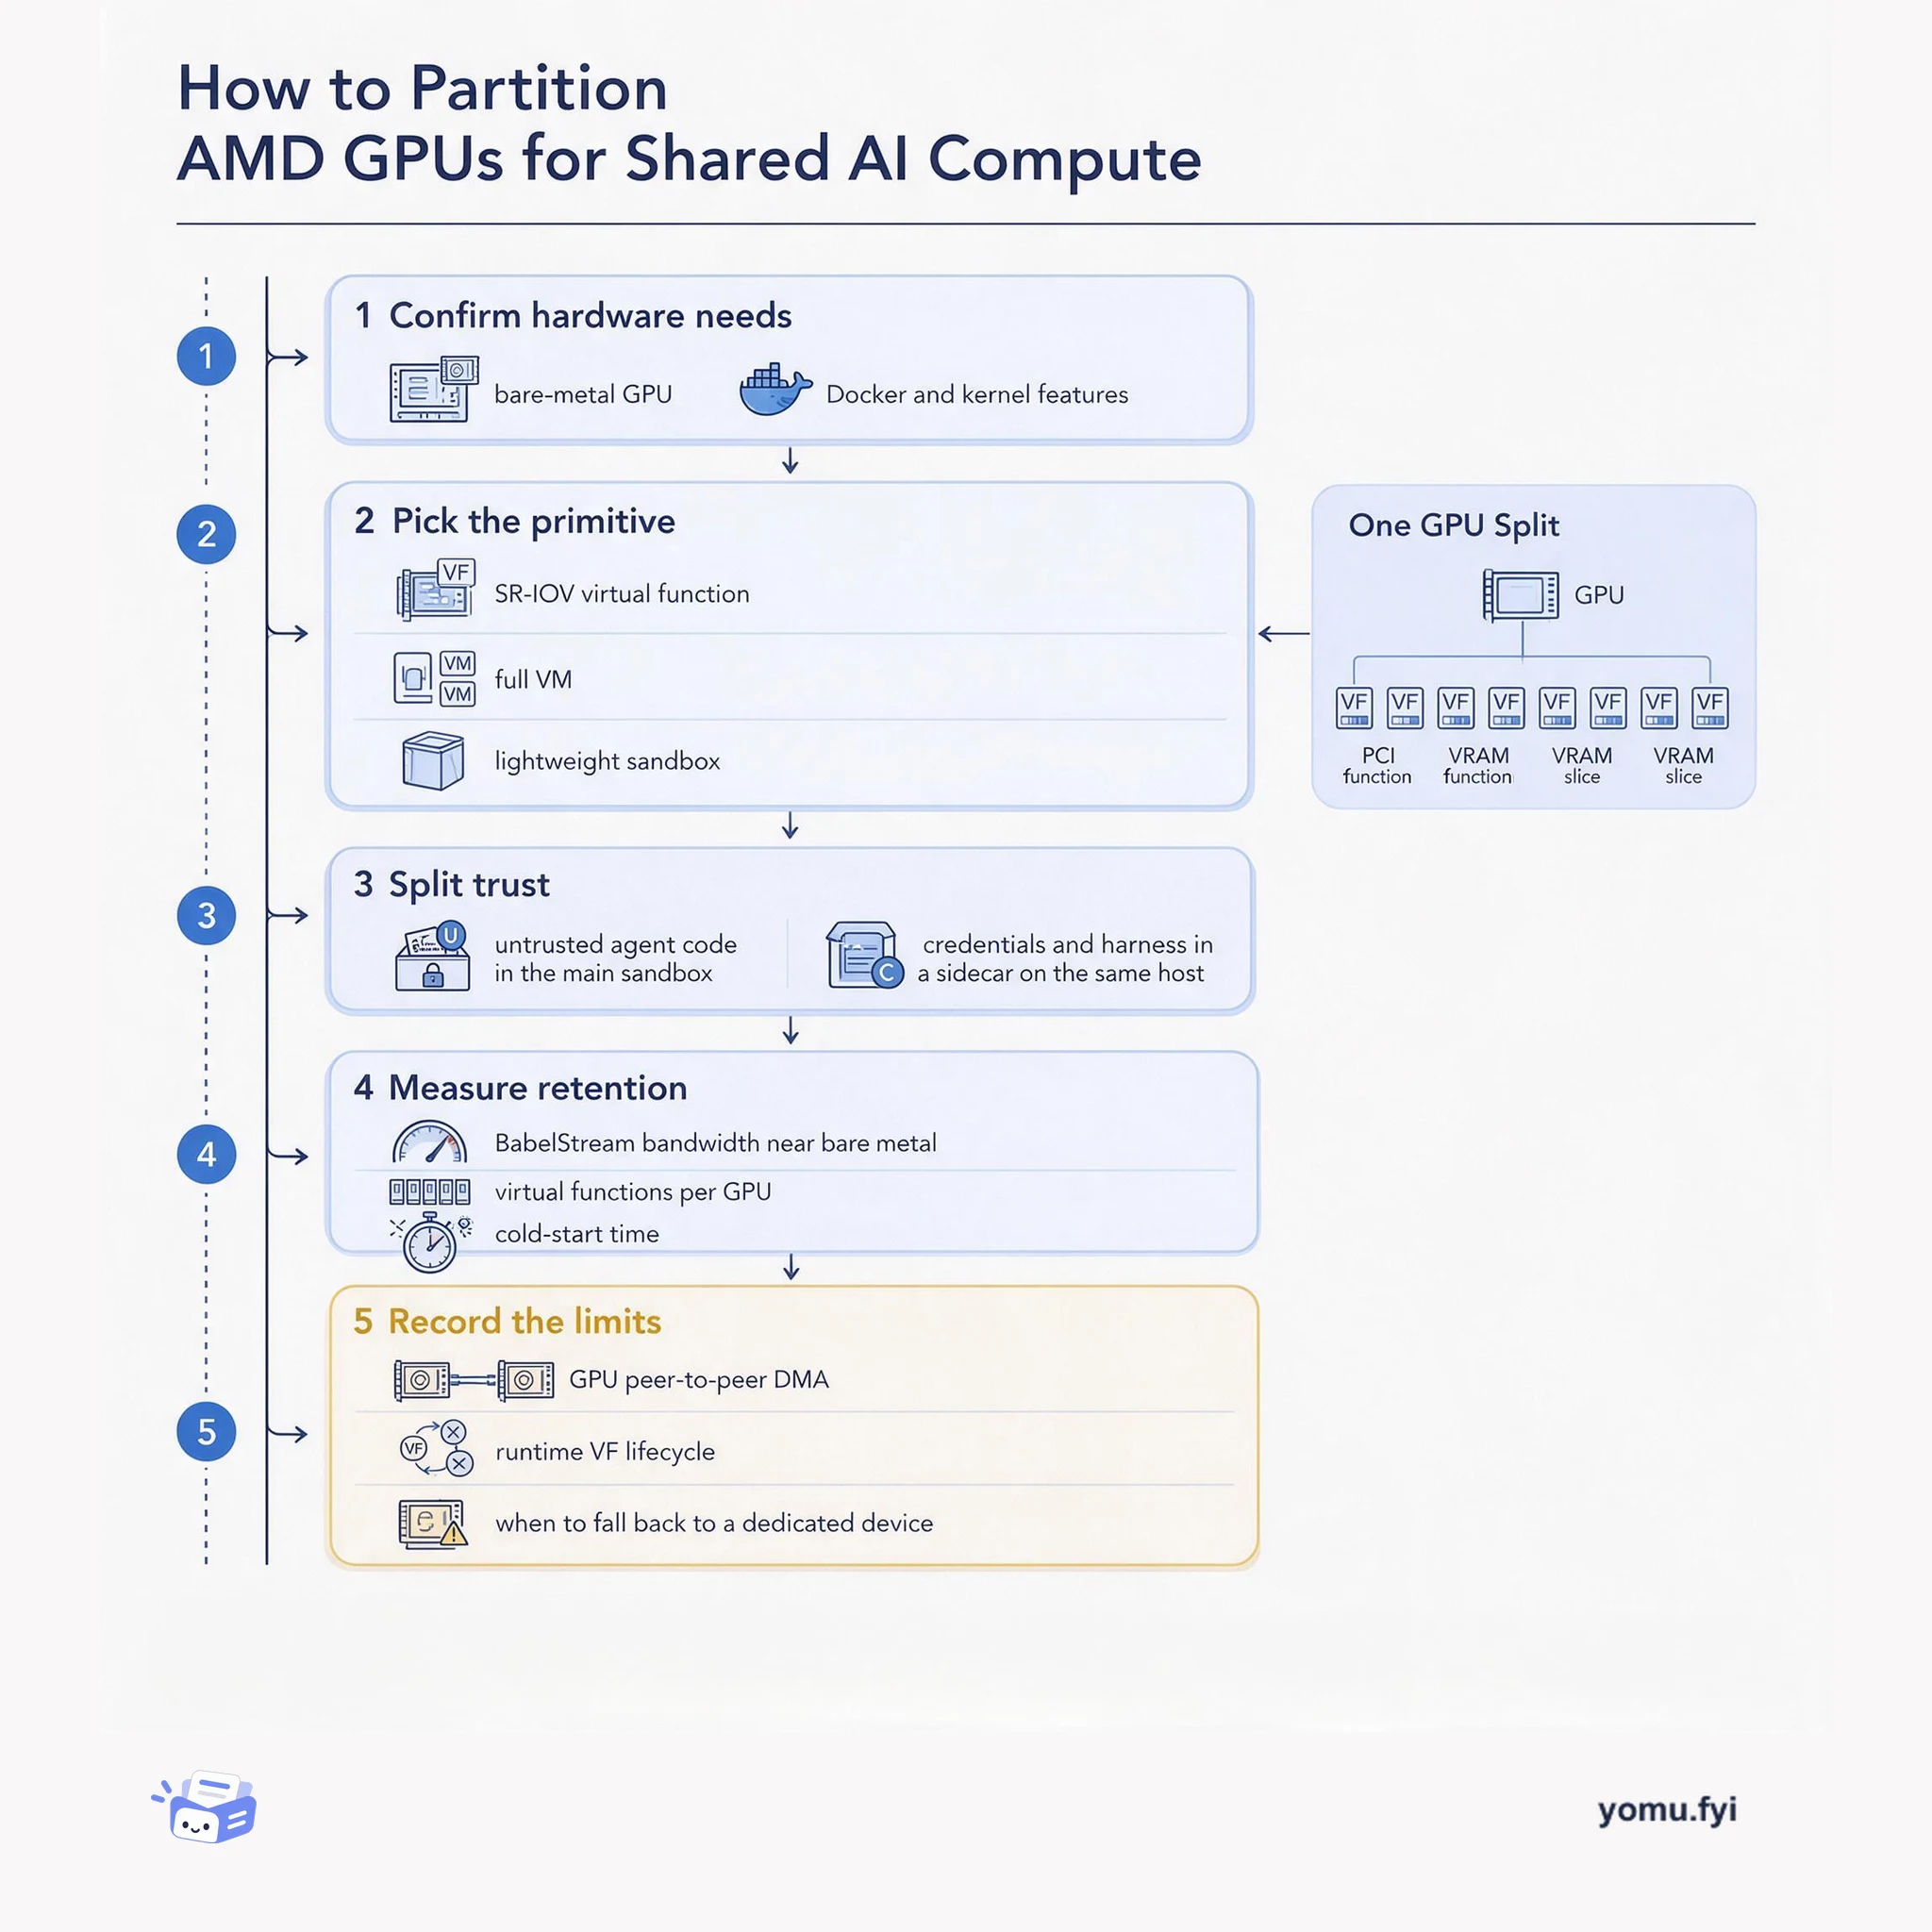
A five-step how-to for deciding when an AMD Instinct GPU should stay dedicated and when SR-IOV virtual functions, VMs, or sidecar isolation can safely share it.
The Good Stuff
Paid picks we use ourselves. Links carry a referral code — a subscription through one earns us a commission at no extra cost to you.
Newest first
Migrating from legacy virtualization with flat VLAN-based tenant networks to Red Hat OpenShift Virtualization often requires re-architecting network topology, creating friction. Red Hat OpenShift supports localnet user-defined networks (CUDNs) to preserve existing VLAN infrastructure while modernizing. Red Hat tested localnet CUDNs at scale, successfully managing up to 3,500 localnet CUDNs hosting over 3,500 active virtual machines. OVN-Kubernetes achieved 100% SSH connectivity, near-line-speed data-path performance over 100GbE interfaces without Geneve tunnel overhead, and stable control plane resource usage. Resource peaks reached approximately 5.5 CPU cores per worker node and 10 CPU cores on control plane nodes during bulk creation, then returned to low baselines.
The tokenizers library is being reworked for version 1 with a heavy focus on performance, as tokenization can become a bottleneck that starves models of data when workloads scale. The work draws on ideas from other open-source tokenizers like gigatoken, tiktoken, and kitoken. Key optimizations include using SIMD instructions for UTF-8 text, ensuring merges never cross pre-token boundaries, and reusing scratch buffers to avoid allocations. The release candidate is implemented in the Rust pre-release on crates.io, with the crate split into tk-encode, tk-serialize, tk-convert, and tk-train. Batched model calls and faster decoding with parallel batch processing are also part of the improvements.
AIPerf is NVIDIA’s successor to GenAI-Perf, intended to benchmark large-scale LLM inference without letting the load client become the bottleneck. Its multiprocess architecture combines worker processes, separate record-processor services, and ZMQ coordination, while supporting 15+ endpoint types, public datasets, and trace-replay formats. The walkthrough serves Qwen3-0.6B through vLLM, using streaming synthetic requests with fixed 128-token inputs and outputs; AIPerf reports TTFT, ITL, request latency, output token throughput, percentile distributions, and optional GPU telemetry in CSV and JSON. A second profile uses Poisson arrivals averaging 10 requests per second, variable input and output lengths, and a fixed random seed, producing wider latency distributions than the static baseline as concurrency and workload variability increase.
Cloudflare describes how excessive memory use in pingora-ketama, the consistent-hashing component of its Pingora Backend Router, was investigated as a resource-efficiency problem at global scale. Consistent hashing maps servers and cache keys onto a circular hash space, but a single hash per server creates uneven ranges, while multiple hashes improve balance; with 160 points per server, the coefficient of variation falls to about 8% in the 100-server example. The work produced a v2 ring with compacted storage, faster sorting, and a configurable base number of hashes per node, while retaining the existing v1 ring and supporting simultaneous use during migration. After the old ring was decommissioned, measured memory usage for PBR fell by 100TB globally, and the changes are available in pingora-ketama behind an unadvertised Cargo feature.
Red Hat Developer Hub performance testing became slow and unreliable as runtime generation of large user and group catalogs stretched environment setup and introduced synchronization failures. Previously, the framework created entries through serialized Keycloak Admin REST API operations, then waited for paginated synchronization into the Developer Hub database; concurrency could not eliminate timeouts, rate limits, or incomplete catalogs. The replacement uses immutable, pre-built LDAP container images selected by an RBAC_POLICY-USER_COUNTu-GROUP_COUNTg convention, with slapadd loading seed data directly into offline LMDB files in a multi-stage build. LDAP starts with 10,000-plus indexed users, while Keycloak serves as an authentication gateway and Developer Hub waits for its initial catalog sync. Reported population time fell from 22-plus hours to 2 minutes 8 seconds for 10,000 users and 150,000 groups, while the immutable approach made tests deterministic, reduced flaky failures, stabilized baselines, and enabled larger reproducible scenarios.
Rapid changes in vLLM and the path from upstream releases to Red Hat AI Inference images can introduce performance and accuracy regressions that ordinary CI/CD tests miss. The midstream regression detector benchmarks upstream and release-candidate builds across hardware variants, using GuideLLM at multiple concurrency levels for performance and GSM8K for accuracy. It stores nightly upstream results, compares them with midstream benchmarks against threshold deltas, and feeds confirmed failures into fixes and rebuilds before release. To reduce false positives from limited samples, the workflow adds Wasserstein distance as a secondary check of whole request-response distributions rather than relying only on medians or means. The system also connects benchmark runs with prior JIRA regressions through a custom Claude skill that suggests possible fixes and assesses whether a flagged change is genuine.
cuTile Rust (cutile-rs) extends Rust’s ownership model to tile-based GPU kernels, and this post describes an agentic workflow for translating cuTile Python and Triton-TileIR implementations. Because all three front ends target CUDA Tile IR and share the tileiras compiler, the workflow compares reference and translated IR while making Python’s implicit specializations explicit through Rust const generics, fixed dtype symbols, and FFI checks. A bounded multi-agent pipeline covers analysis, device kernels, host and FFI code, correctness, and benchmarking, with machine-checkable verdicts controlling progress. It ported all 24 public TileGym operators, roughly 40 kernels, and reported 99.5% average cuTile Python performance across 347 paired configurations on NVIDIA DGX B200. The skill ships with TileGym and uses acceptance checks requiring correctness, backend execution, and a geomean speedup of at least 0.95.
AI factories are constrained by site power, making performance per watt especially important for high-interactivity inference. The NVIDIA Groq 3 LPX rack uses deterministic execution: its compiler schedules computation, data movement, and clock-cycle timing across 256 LPU chips, then derives a cycle-level current-demand curve. Preemptive Power (PEP) prepares the power-delivery network for upcoming spikes, while Clock Period Synthesis (CPS) lengthens or shortens selected cycles to reduce di/dt, voltage droop, and the voltage guardband. Internal testing reported more than 60% less voltage drop, while the source estimates a high-single-digit baseline-voltage reduction and potentially low-double-digit workload-power reduction; paired with Vera Rubin NVL72, the platform is described as delivering up to 35x higher throughput per megawatt than GB200 NVL72 for 2T+ parameter models at long context and high interactivity.
Red Hat Enterprise Linux 9.8 and 10.2 now provide a free-threaded Python 3.14 build alongside the regular interpreter, enabling developers to test parallel CPU execution with threads. The build disables the GIL, allowing Python threads to execute on multiple CPU cores in one process, while built-in dict, list, and set operations retain internal locking for individual operations. Developers install the python3.14-freethreading package from the CodeReady Linux Builder repository; it provides the separate python3.14t executable and commands to verify free-threading support and GIL status. Existing code may expose race conditions, and unsupported C-extension dependencies can re-enable the GIL, so the source recommends testing, dependency checks, explicit synchronization, and workload measurement. The build carries a stated 5%-10% single-threaded performance overhead and mainly targets CPU-bound threaded workloads.
Pinterest describes how its Manas distributed search platform is evolving embedding retrieval for a corpus growing toward tens of billions of embeddings. Traditional HNSW indexes require all data in RAM, while single-vector two-tower retrieval limits context-dependent relevance, motivating changes across quantization, SSD-based serving, and multi-embedding retrieval. Manas uses Scalar Quantization and Product Quantization across HNSW and IVF, with SQ preserving over 90% recall while reducing index size, and Linear Scaling plus SIMD cuts per-query computing resources by 10–15%. For disk-based serving, SPANN with PQ is reported as 4.5x faster than plain SPANN and over 3x DiskANN QPS, while a five-billion-embedding production evaluation saved over 40% CPU time with under 5% recall drop. The platform is also adding ColBERT-style late interaction using Sum of MaxSim, with a pilot in progress.
Lakebase Postgres uses disaggregated storage backed by object storage, so compute-side caching must deliver low latency and high throughput while avoiding inefficient memory use. Its original design paired a conservatively sized PostgreSQL shared buffer with a local file cache (LFC), but the roughly 1 GB shared-buffer cap pushed many hits to slower NVMe storage and could create double buffering. For fixed-size computes with CU >= 80, the new configuration disables the LFC and sets shared buffers to 75% of DRAM, using explicit 2 MB HugeTLB pages to control page-table and TLB overhead. Benchmark tests found huge pages reduced tail read latency by up to ~40% and CPU use by up to ~30%, while production examples reported doubled throughput, 5× fewer storage reads, or 5× lower CPU use. Work is underway to dynamically resize shared buffers and huge pages for autoscaling computes.
The benchmark compares ClickHouse Cloud with Snowflake under a continuous real-time workload, asking whether ingested data becomes query-ready quickly enough for interactive analytics. Both systems received the same 113.2-billion-row NBBO dataset at a target of 1 million rows per second, with matched sorting or clustering keys, pre-aggregations, query schedules, and approximately 16 CPUs of query-serving compute. ClickHouse used native asynchronous inserts and maintained ordering and pre-aggregation during ingestion, while Snowflake used Snowpipe Streaming and Interactive MV refresh as separately metered services. In the end-to-end CostBench comparison, ClickHouse Cloud delivered 412× better performance per dollar: Snowflake’s path cost 3.32× more and its matched queries took 124× longer in total. The comparison attributes the gap to query-readiness work, refresh lag, reconciliation, and growing drill-down latency.
Encode-prefill-decode (EPD) disaggregation separates a multimodal model’s vision encoder from LLM prefill and decode, addressing contention when image or video processing delays language-model work. Using NVIDIA Dynamo, the post compares aggregated serving with colocated encoder workers and a heterogeneous, disaggregated encoder tier, with vision embeddings transferred to PD workers through NIXL over UCX RC/TCP Ethernet. EPD is most useful for media-heavy requests, short-to-medium outputs, smaller or quantized models, and mixed text/multimodal traffic; long decode sequences or light media processing reduce its value. In the reported image-heavy test, colocated and heterogeneous EPD reduced TTFT by 58% and 50%, while the heterogeneous tier served 70% more traffic at the same under-100-ms ITL SLO. Mixed-traffic measurements also reduced mean TTFT for text requests from 92.3 to 53.3 ms.
After ReSharper’s out-of-process (OOP) architecture launched, users reported slower Windows startup, and profiling traced the delay to Microsoft Defender scanning the separate process. Defender spends only a couple of seconds on processes in write-protected paths but can add tens of seconds when ReSharper loads DLLs from a user installation directory. The investigation used Microsoft Defender ETW logs and direct CPU-time measurements, with cold-start tests repeated 10 times inside an 8-vCPU, 8-GB Hyper-V VM; JetBrains IDEs took roughly 10–40 seconds to scan, while Microsoft IDEs and other editors stayed under one second. Collaboration with Microsoft led to Defender optimizations in version 1.449.454.0, improving scanning for ReSharper OOP and Rider in write-protected directories. JetBrains also released the Defender Performance Tool for live monitoring, offline snapshots, and CSV export.
JetBrains IDEs have supported WSL through several architectures, but the 2026.2 release makes Native mode the recommended entry point for projects stored there. In Native mode, the Windows IDE delegates filesystem and process operations to the Rust-based IJent agent inside WSL, with EelApi abstracting local and remote environments for IDE and plugin code. Earlier approaches included 9P filesystem access, WSLg, and Remote Development, with problems involving symlink handling, latency, GUI limitations, installation overhead, and client–backend communication costs. Performance tests on a cold first open of spring-framework measured Native mode at 11.5 seconds to become ready versus 18.5 seconds for 9P, while project-tree scanning took 3.7 versus 8.1 seconds. Remote Development remains available, but direct project opening is now preferred in IntelliJ IDEA, WebStorm, and PhpStorm.
A benchmark of the Icon Payments Framework (IPF), trusted by Citi, NatWest, and BNP Paribas, on MongoDB Atlas demonstrated extreme performance and resilience for instant payment processing. The system sustained 6,000 end-to-end payments per second, requiring approximately 430,000 simultaneous database operations, with a mean end-to-end latency of 0.51 seconds and persistence latency below 30 milliseconds. Upgrading from MongoDB Atlas 8.0 to 8.3 reduced persistence latency by roughly 50%, from 40 to 20 milliseconds at 4,000 payments per second, and throughput scaled near-linearly across the 500 to 6,000 range while latency remained flat until peak and hot-shard CPU utilization sat at about half. During a primary failover, a new node was elected in five seconds with zero data loss and no application restart. An application node failure recovered to 3,500 transactions per second in 90 seconds with zero data loss.
Ceilometer is Uber’s adaptive benchmarking framework for qualifying new server types, cloud SKUs, kernel upgrades, configuration changes, and machine-learning frameworks before production rollout. It replaces manual, fragmented testing with standardized configurations, automated cluster bring-up and service deployment, portable containerized harnesses, and reporting that includes server specifications, reference SLAs, normalization, resource utilization, cost efficiency, and reliability signals. Its distributed architecture runs synthetic and production-like workloads across dedicated machines, processes and enriches raw results, stores them in blob storage and a centralized data warehouse, and exposes them through an analytics service. The framework covers CPU and memory benchmarks, tools such as SpecCPU2017, SPECjbb2015, NetPerf, and FIO, plus stateful, stateless, batch, and ML workloads; Uber reports uses including regression detection, database validation, and canary testing of external upgrades.
SQL data types define what values columns accept, how those values are stored, and how databases process them, making type selection central to schema design. The reference covers numeric, character, date/time, and specialized types, noting that MySQL, PostgreSQL, SQL Server, and Oracle differ in naming, precision, limits, and storage requirements. It recommends choosing the smallest type that safely accommodates expected values, checking range, precision, NULL requirements, string length, and time-zone needs before deployment. Examples contrast CHAR with VARCHAR, DECIMAL with FLOAT, DATE with TIMESTAMP, and integer sizes such as TINYINT, INT, and BIGINT; indexes and distributed engines also benefit from right-sized data. Sample data, execution-plan analysis, storage measurements, schema audits, and documentation help validate choices, identify waste or overflow risks, and preserve reasoning behind edge cases.
Cloudflare’s Automatic Key Exchange addresses extra TLS 1.3 handshake latency and the difficulty of enabling post-quantum origin connections without manual configuration. Cloudflare previously sent an X25519 keyshare as its first guess; origins preferring another group returned a HelloRetryRequest, while sending X25519MLKEM768 indiscriminately risked oversized, split ClientHello messages and legacy compatibility failures. The system reuses Automatic SSL/TLS scanning to run lightweight handshakes for each supported group, map every origin’s capabilities and preferences, and tailor the initial keyshare, preferring X25519MLKEM768 when supported. During rollout, HelloRetryRequests dropped from roughly 52% to 3.7%, cutting more than 150 ms from p90 handshake latency, while hundreds of thousands of domains gained post-quantum origin connections without configuration. Cloudflare says it plans to extend scanning to post-quantum authentication, including ML-DSA certificates and future Merkle Tree Certificates.
CostBench measures real-time performance per dollar by evaluating the full path from continuously arriving rows to query-ready data and query results. Its end-to-end workload streams more than 100 billion stock-market quotes at a target rate of 1 million rows per second while aggregate and drill-down queries run, comparing ClickHouse Cloud, Snowflake, BigQuery, and Redshift Serverless through their recommended push-based ingestion paths. The benchmark accounts for fresh-data-path work—columnar ingestion, pruning-friendly layouts, and current pre-aggregations—alongside query-serving cost and accumulated runtime. ClickHouse Cloud recorded the lowest fresh-data-path cost, query-serving cost, and accumulated runtime, while the alternatives showed 412–1,996× worse end-to-end performance per dollar; the source says it was the only tested system keeping both data representations current during ingestion. The post introduces follow-up architecture and billing analyses.
The best engineering reads, once a week.