The post examines why business intelligence (BI) dashboards lose user trust, even when data is accurate, focusing on how inconsistent metric definitions and opaque data sources cause users to doubt results. Richard Tomlinson argues that AI tools accelerate chart creation but also amplify trust debt if underlying data governance and semantics are weak, since AI can generate many inconsistent charts quickly. He recommends governing data and meaning, preserving provenance, and designing for inspection so visualizations invite investigation rather than presenting unexplained answers. Tomlinson stresses that dashboards should be self-explanatory, traceable, interactive, and context-aware, and that the critical metric for modern BI is ‘time to trust’ not just time to answer. Self-service fails when verifying an AI-generated answer takes longer than asking an analyst, so good visualization must enable inspection and challenge.
Context
Richard Tomlinson, a BI and product leader, explains why dashboards fail due to trust issues stemming from inconsistent metrics and opaque data sources, and discusses how AI tools both accelerate analytics and risk deepening trust debt without proper governance.
Takeaways
1
BI dashboards fail not because they are ugly but because users encounter numbers they cannot reconcile with other reports, leading to trust erosion.
2
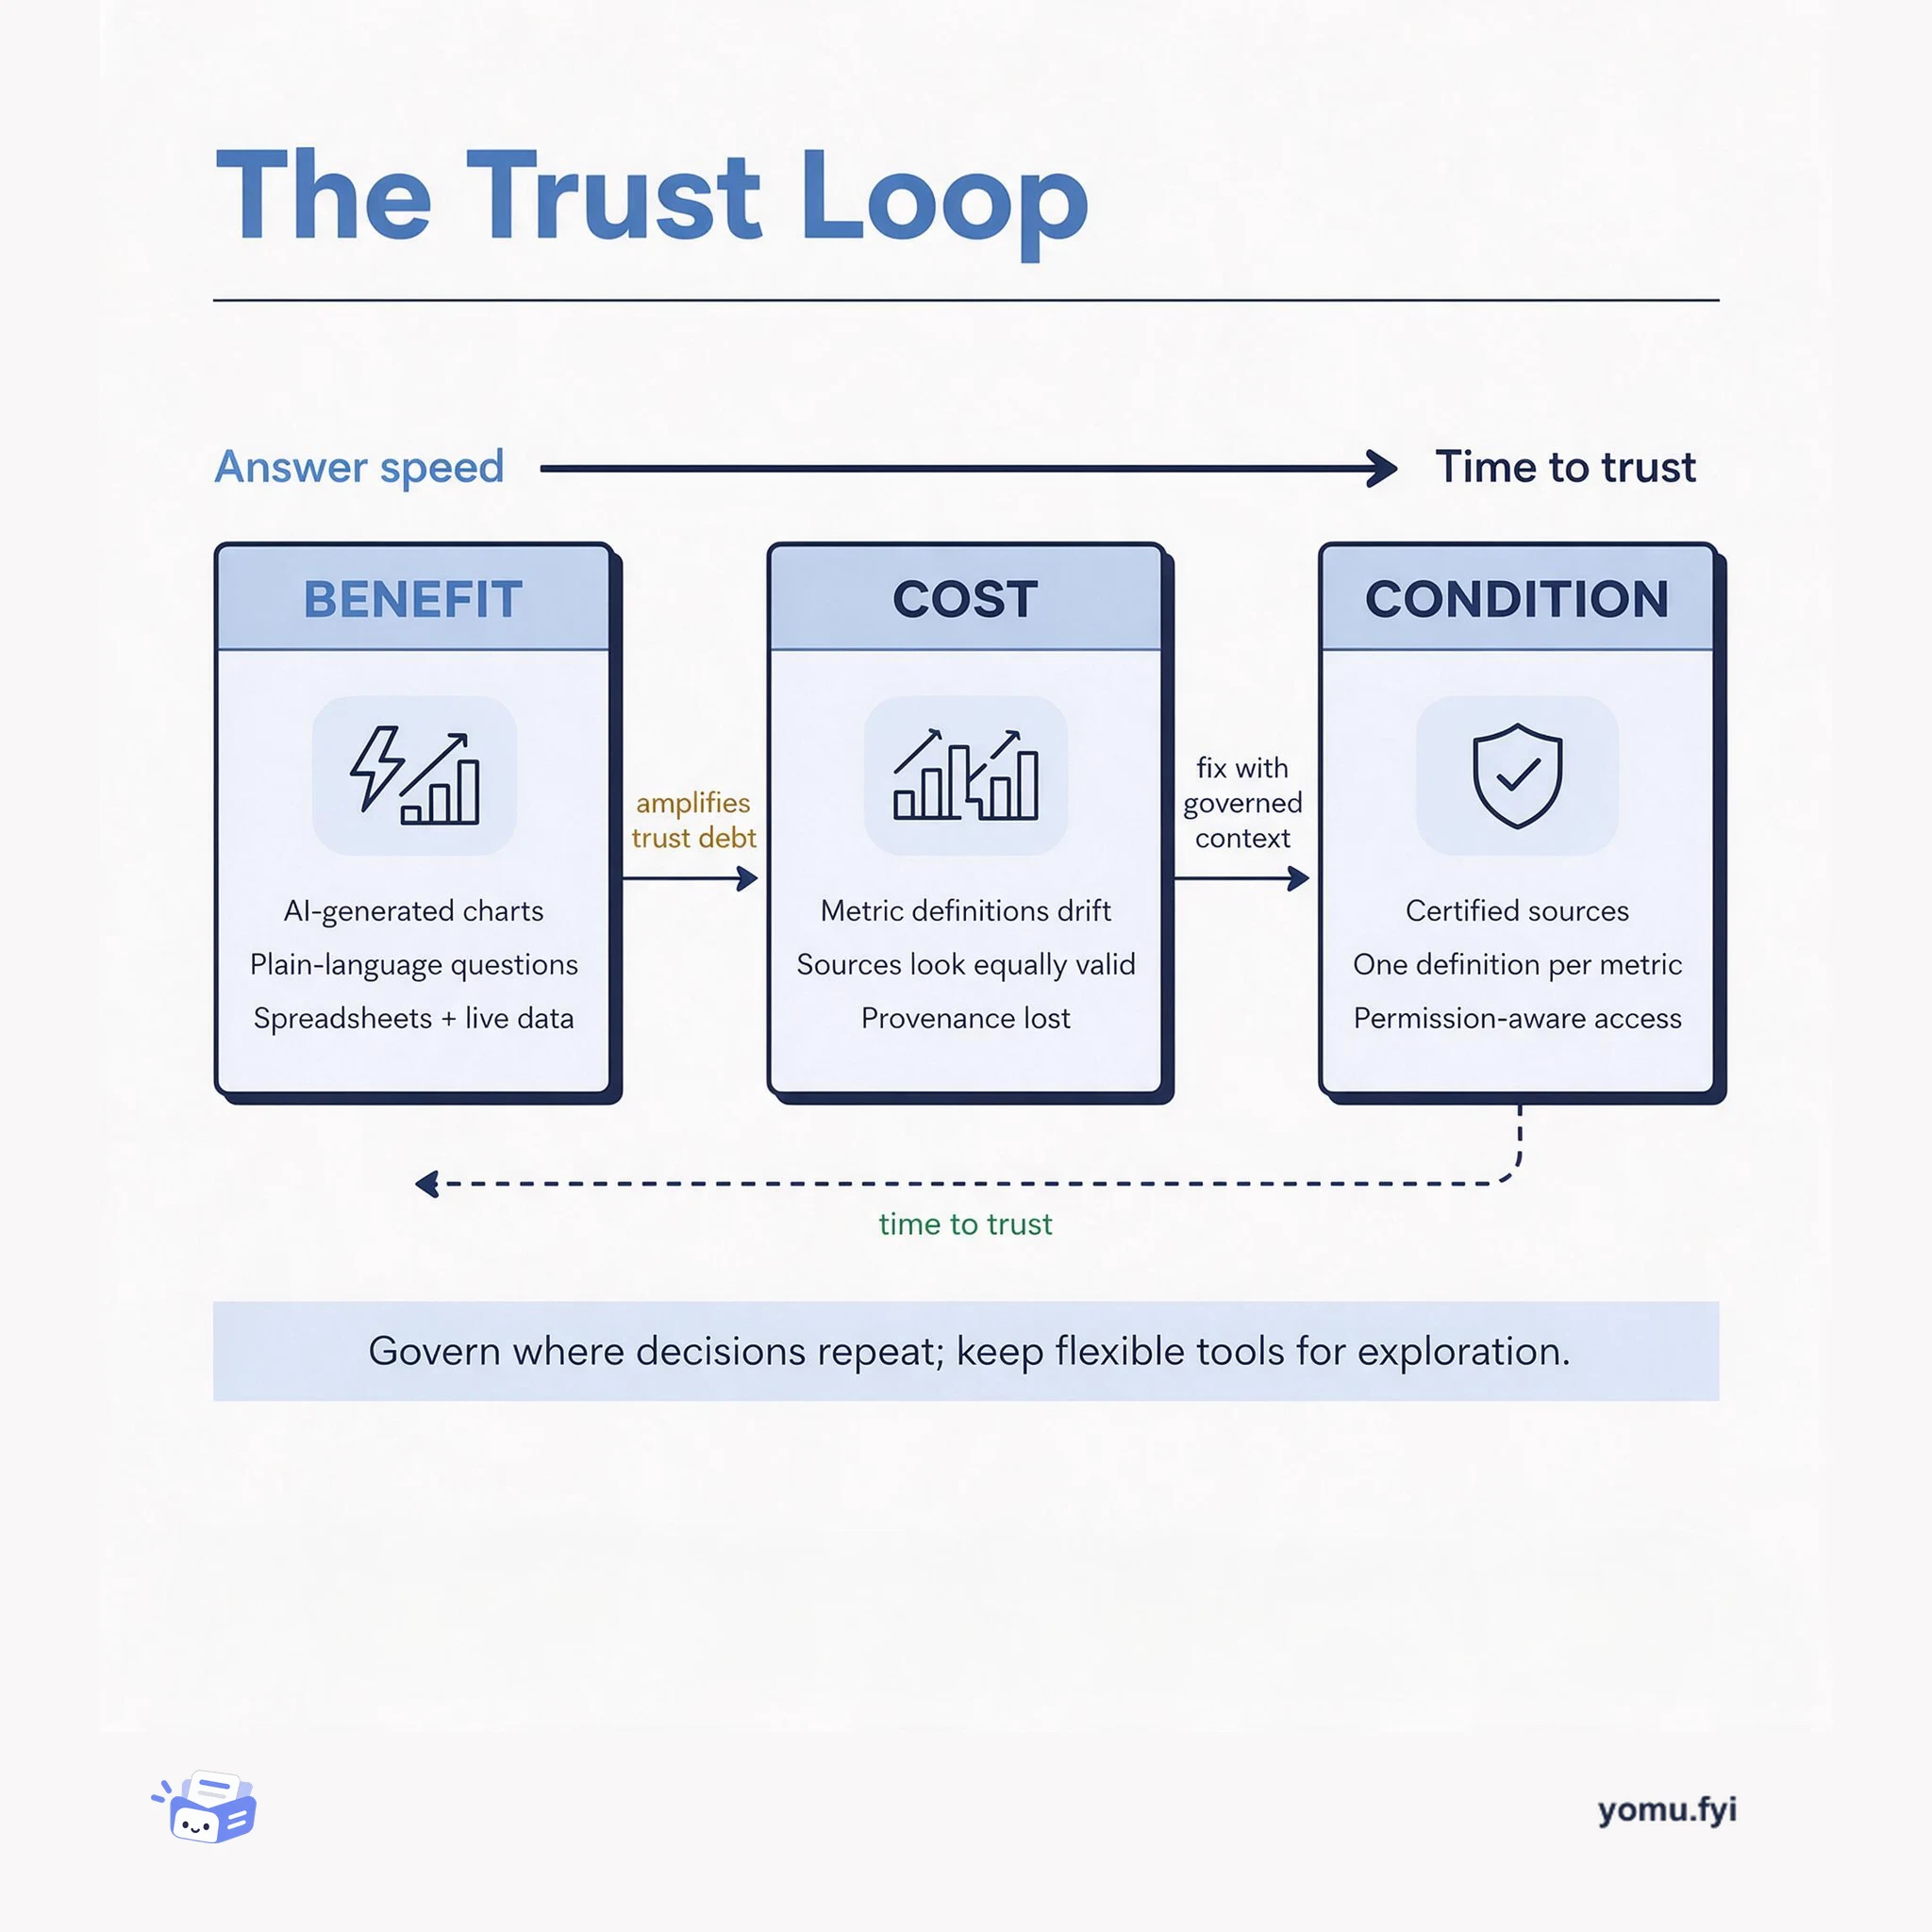
AI accelerates chart creation but amplifies trust debt if underlying data, semantics, and governance are inconsistent.
3
Good visualization should be self-explanatory, traceable, interactive, and context-aware, enabling users to inspect and challenge AI-generated results.
FAQ
Why do people stop using BI dashboards?
Dashboards fail when users see a number they cannot reconcile with other reports, often due to inconsistent definitions or sources. They stop trusting the system and quietly go back to spreadsheets or analysts.
What should leaders prioritize when adopting AI dashboard tools?
Leaders should prioritize governing data and meaning, preserving provenance, and designing for inspection so AI-generated charts are traceable and invite investigation rather than presenting unexplained answers.
Where do AI-generated charts break down?
AI struggles with purpose and context. It can plot data correctly but cannot determine who will use the visualization, what decision is being made, or what might be misinterpreted. Human judgment remains essential.
Business Intelligence turns operational data into decisions, but every speed-up trades against trust. This diagram maps the benefit, cost, and condition behind governed metrics, shared context, and provenance.
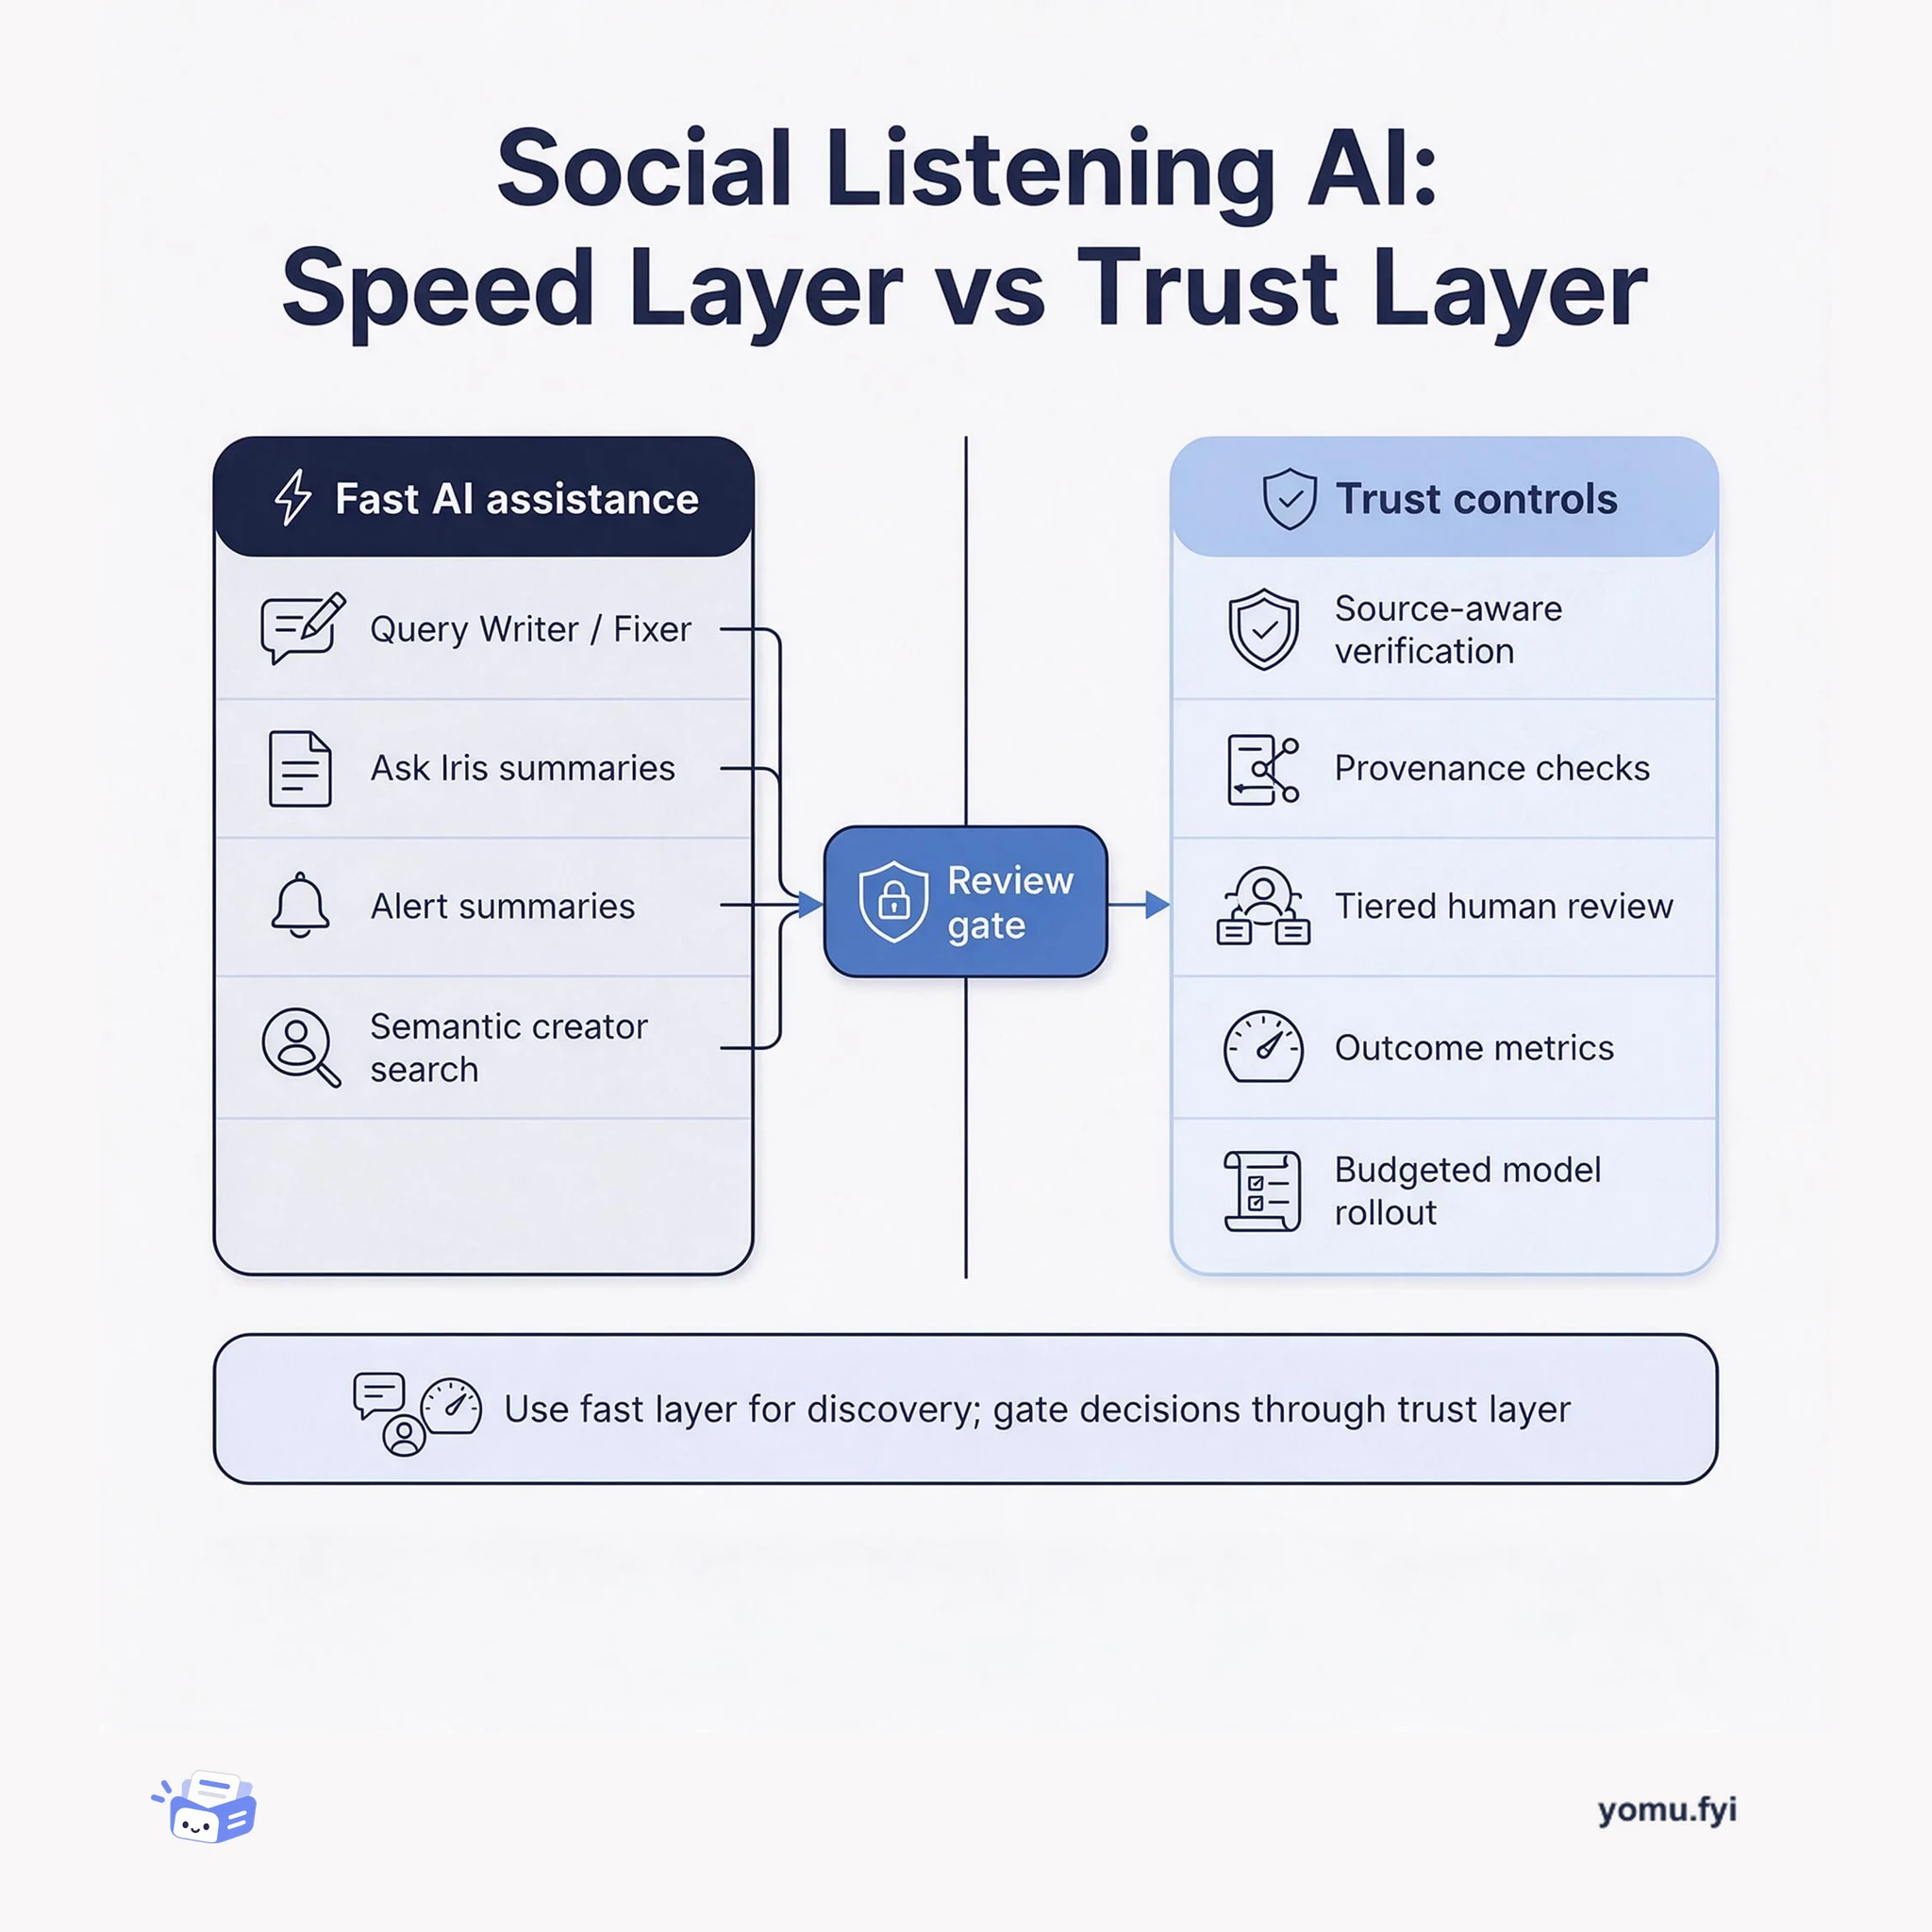
Compare Brandwatch's AI speed features—Ask Iris, Query Writer, and AI summaries—with the governed checks that make social insights trustworthy before teams act.
Keep reading
Related reading
The Good Stuff
Paid picks we use ourselves. Links carry a referral code — a subscription through one earns us a commission at no extra cost to you.