Anomaly Detection: From Baseline to Action
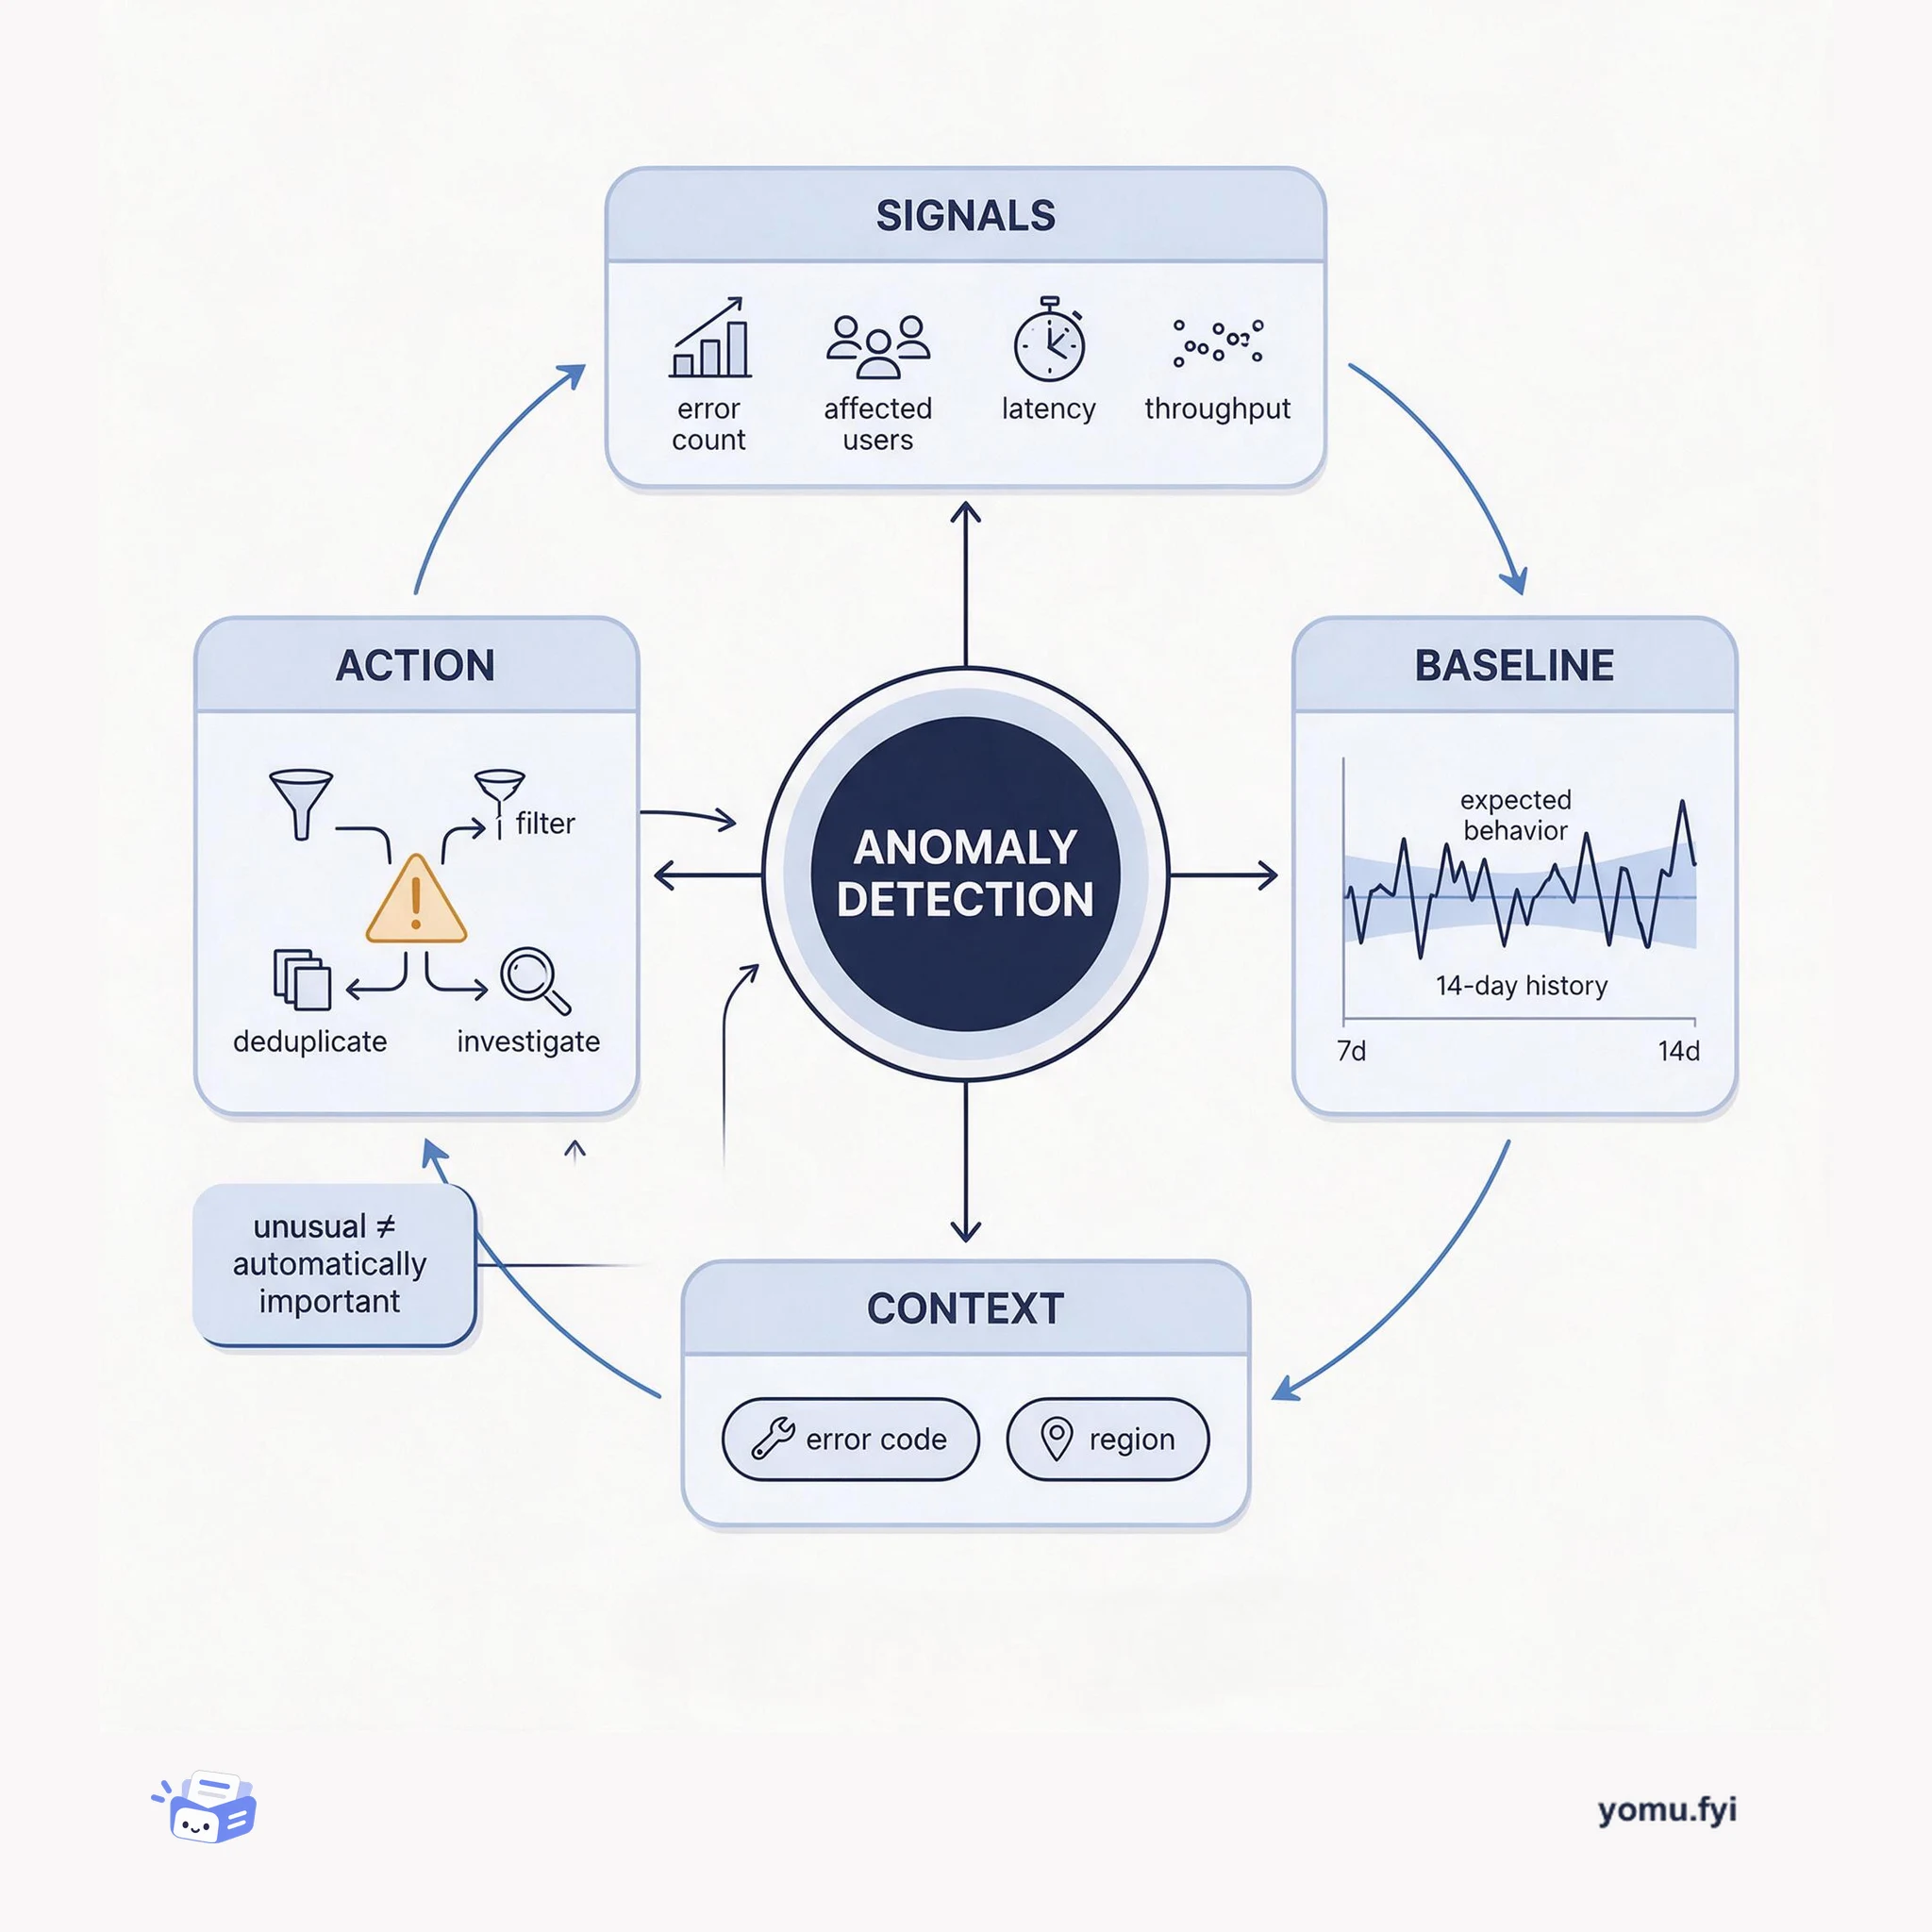
Anomaly detection identifies meaningful departures from expected behavior. This explainer shows how signals, baselines, context, and alert routing turn unusual measurements into engineer-ready findings.
Loading…
Topic
196 posts about Monitoring. Every summary links to the original.
See the idea
Anomaly detection identifies meaningful departures from expected behavior. This explainer shows how signals, baselines, context, and alert routing turn unusual measurements into engineer-ready findings.
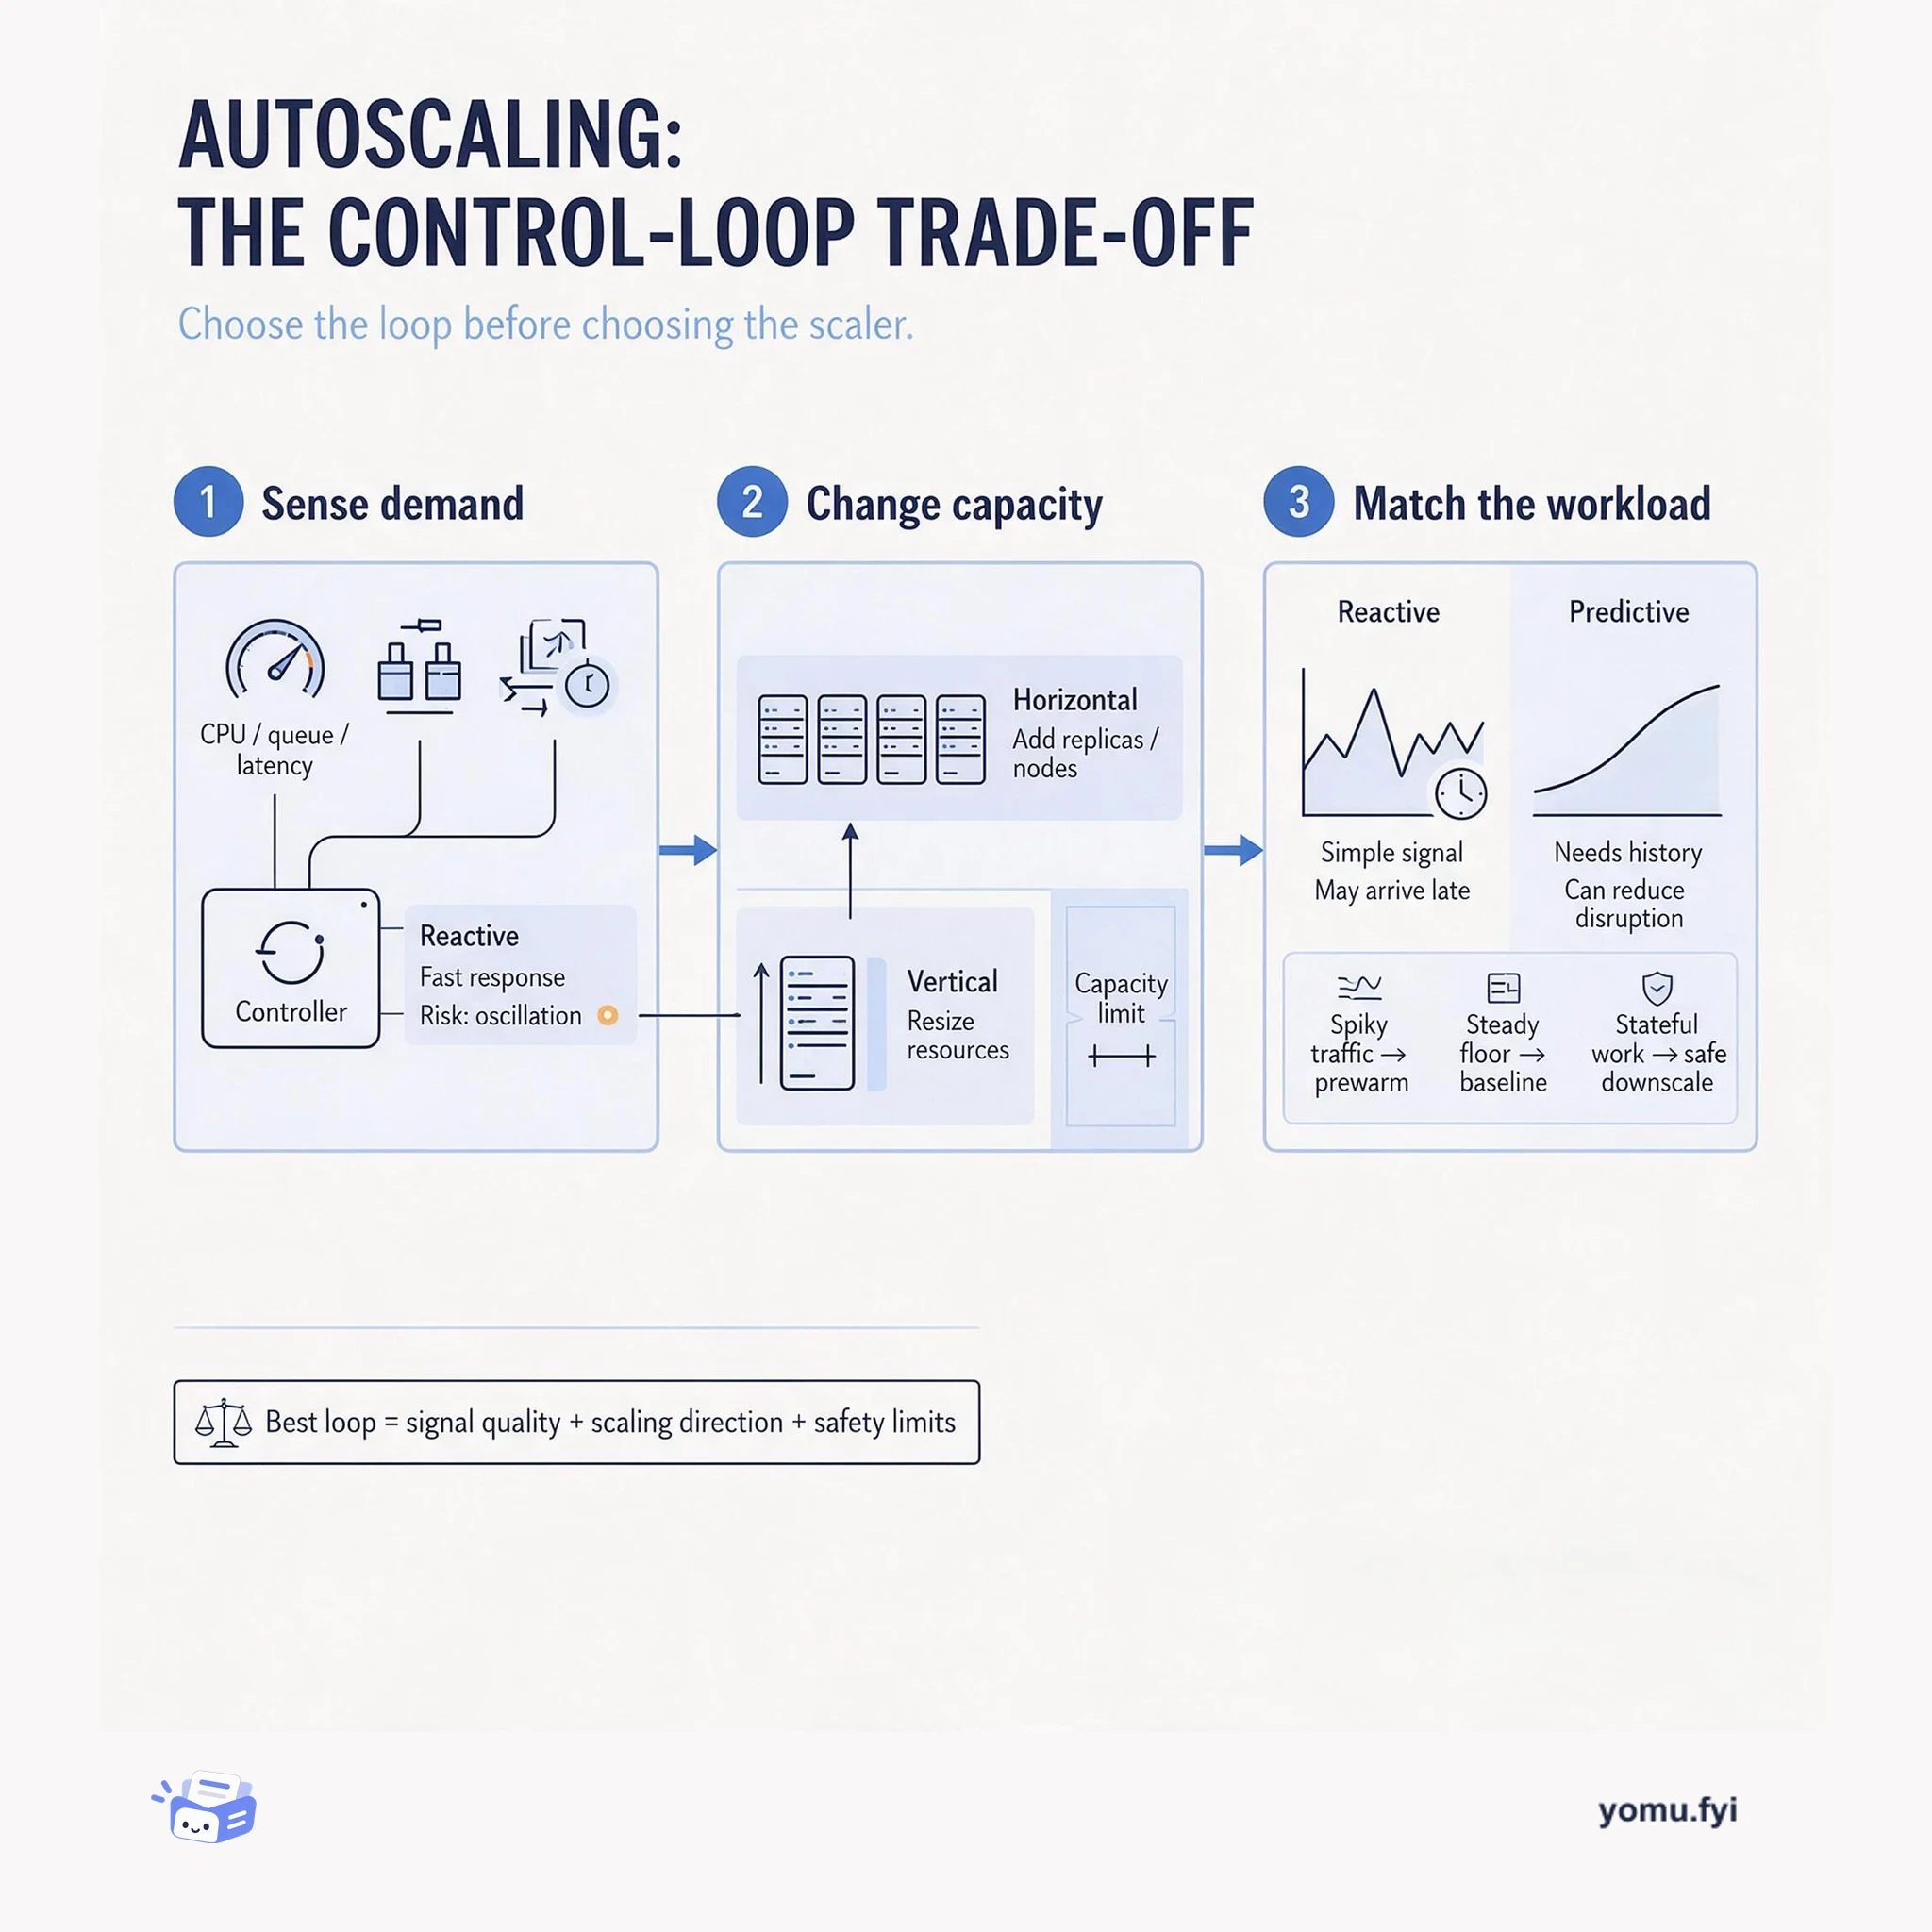
Autoscaling trades responsiveness, stability, and cost: this explainer shows how signal choice, scaling direction, and capacity limits shape the right control loop for a workload.
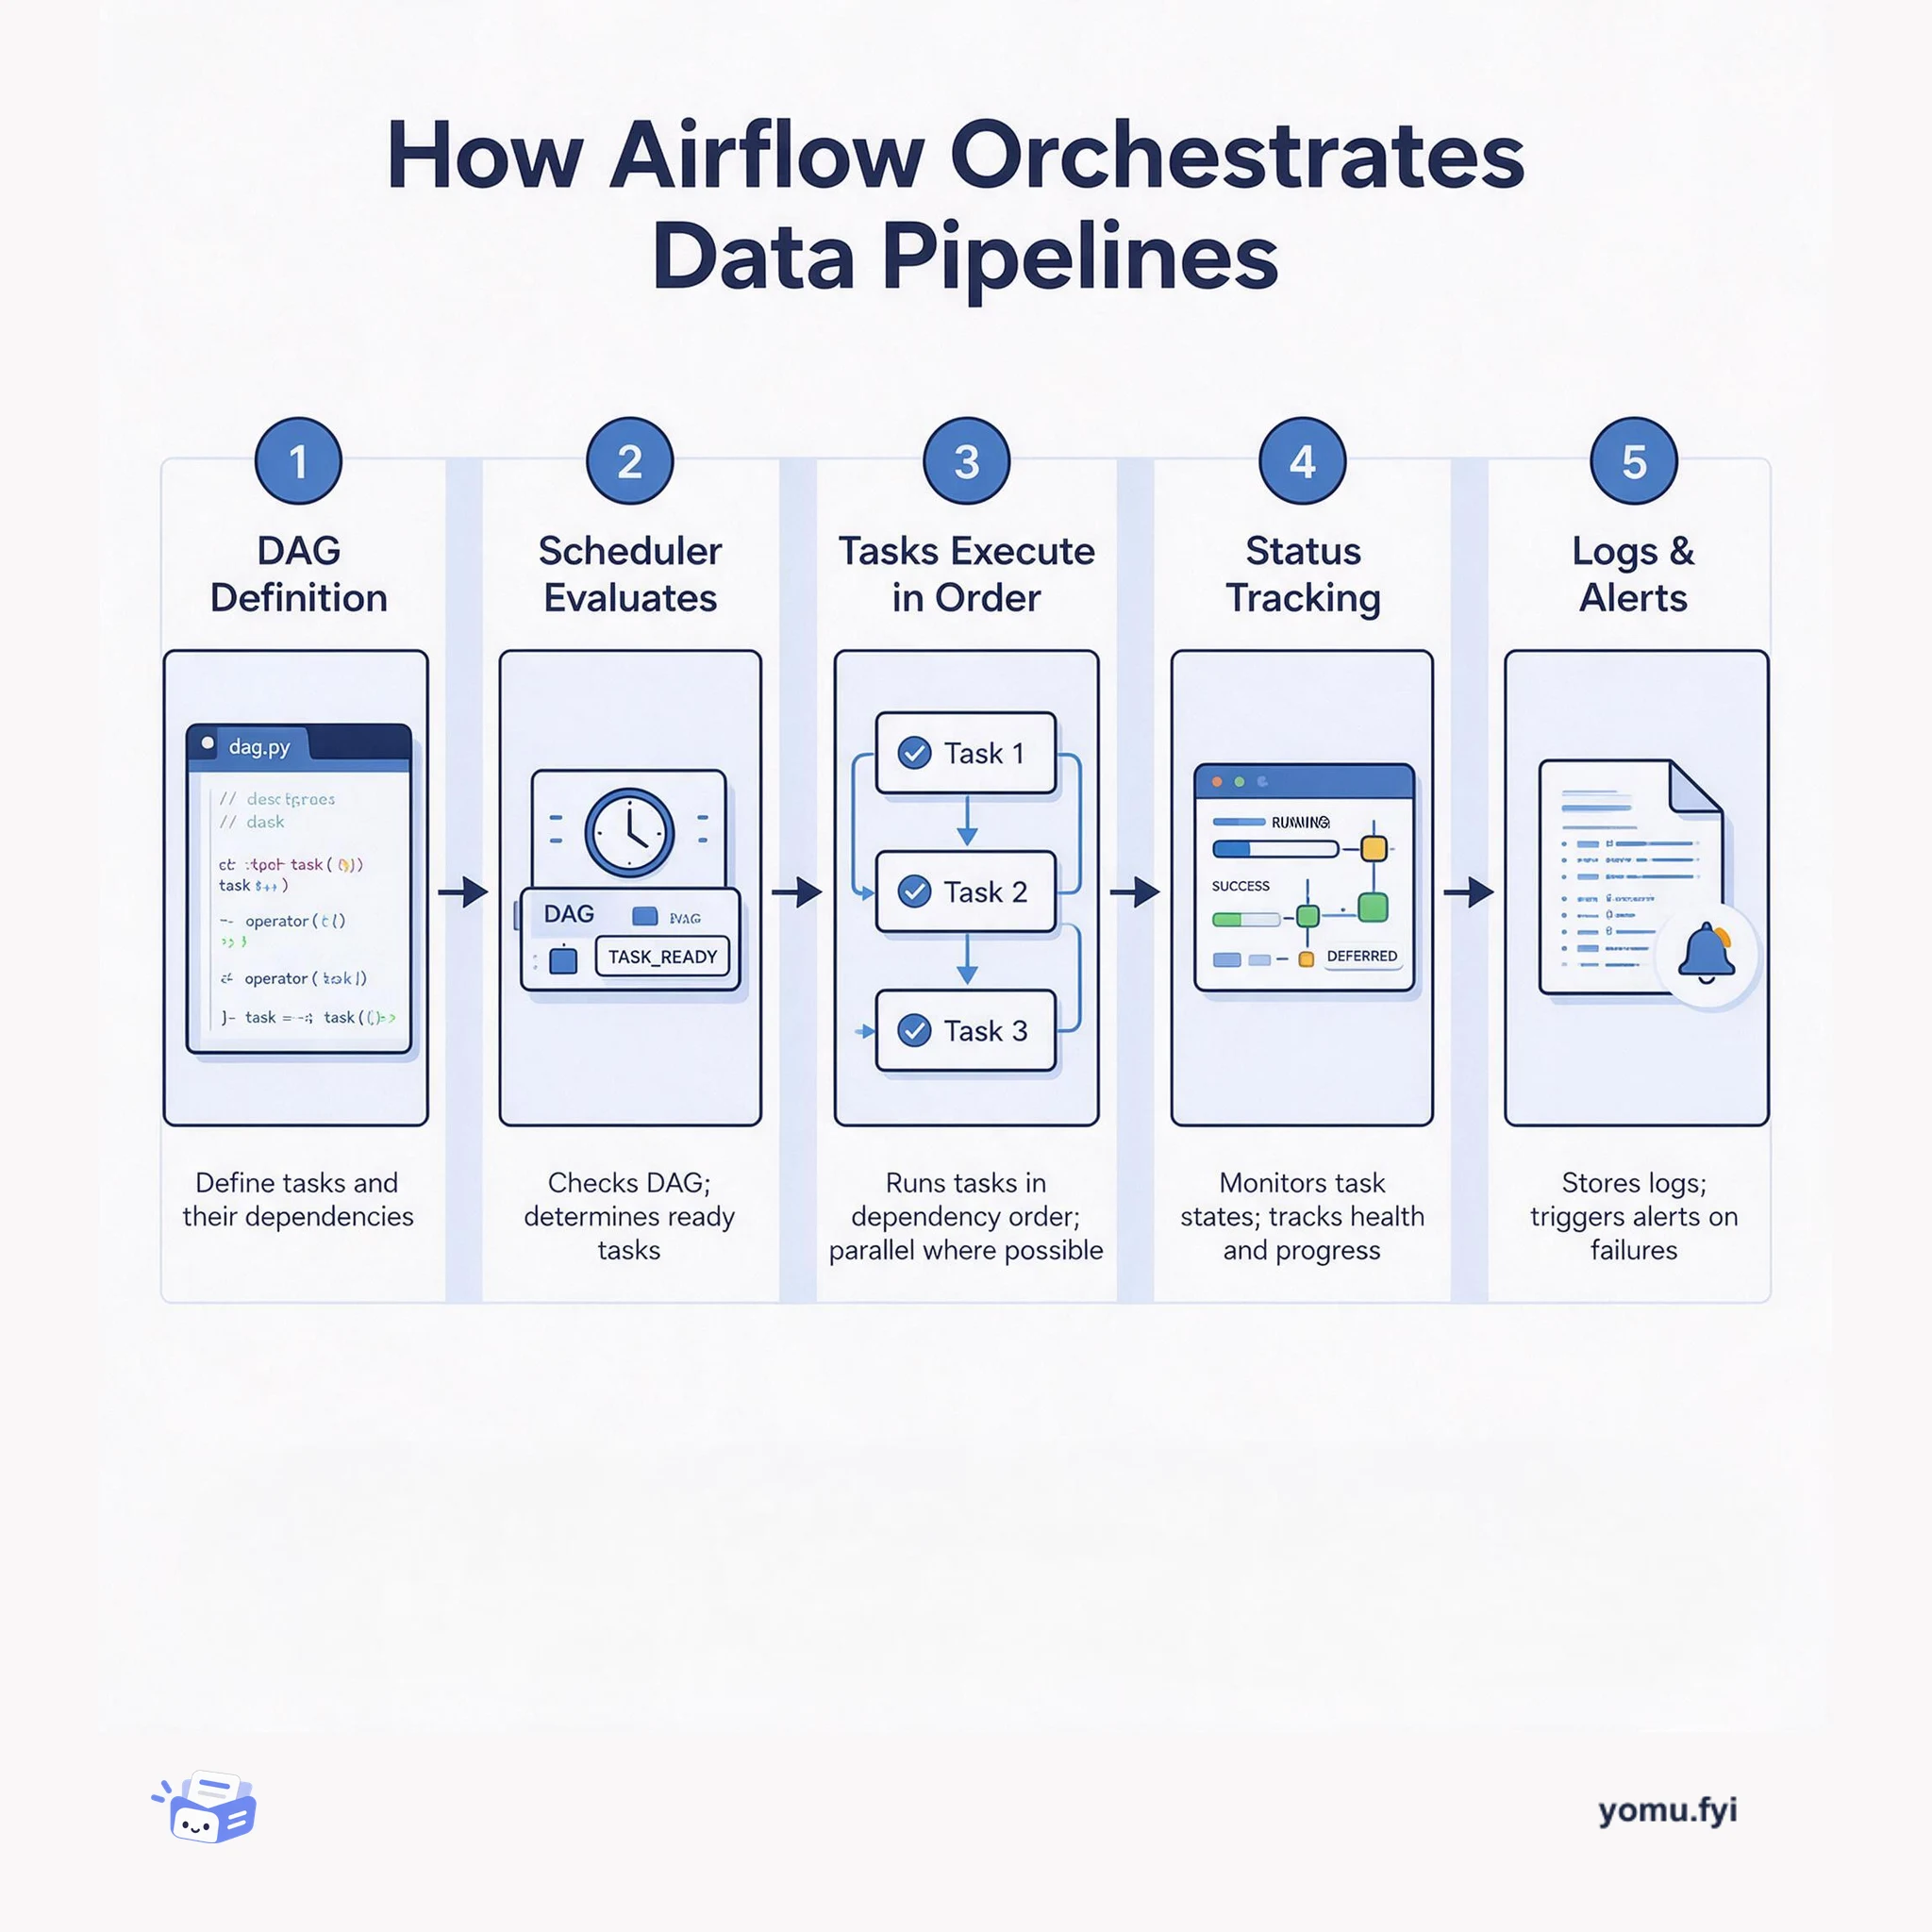
Airflow is a workflow orchestration platform that schedules, monitors, and manages data pipelines by defining tasks as code, executing them in dependency order, and tracking their success or failure.
The Good Stuff
Paid picks we use ourselves. Links carry a referral code — a subscription through one earns us a commission at no extra cost to you.
Newest first
Shopify Engineering treats context—the why, what, and how behind development philosophies, approaches, and choices—as essential to company, team, and individual growth. It describes the Development Handbook, which evolved from a 2015 Google Doc into a searchable internal website in 2018, with hundreds of developer-contributed topics maintained through GitHub pull requests, reviews, and Markdown. Dev Talks began as a weekly open stage and became an on-demand recording program after the 2020 shift to Digital by Design, with most presentations lasting 15 to 20 minutes. The Technical Leadership Team’s Shift podcast provides monthly, in-depth discussions of technical decisions, distributed in audio and video with transcripts. The programs continue to evolve while facing content-maintenance and participation challenges.
The guide presents dashboards as automatically updated collections of visualisations or metrics for monitoring business questions and argues they should be built with a product-thinking approach. It first recommends deciding whether a dashboard is appropriate, then defining one clear goal, a specific audience, and metrics that reflect their needs before sketching the layout with stakeholders. Implementation guidance covers readable and efficient queries, version control, peer review, visual hierarchy, restrained content, business and data context, refresh frequency, technical reviews, and user sign-off. After launch, teams should market the dashboard, make it discoverable, monitor usage and outcomes, iterate when it falls short, and assign ownership for maintenance. The intended outcome is a dashboard that stays useful and delivers business impact by keeping users front and centre.
Adding features to the Supabase single-page application dashboard risked performance regressions due to increasing JavaScript bundle sizes. To establish a baseline, the engineering team introduced next-bundle-analyzer and tracked Real User Monitoring alongside Core Web Vitals using Sentry. Optimization efforts focused on pruning dependencies, which included swapping Moment.js for day-js, replacing Joi with ajv, reverting crypto-js to version 3.3.0, and moving the 388 KB zxcvbn password module to a backend API. The team also implemented Next.js dynamic imports for heavy components like spreadsheet parsing, removed legacy server-side props to unlock Automatic Static Optimization, and configured long cache headers on assets. These architectural adjustments brought Core Web Vitals within recommended thresholds and lowered client-side page transition payloads below 200 KB of JavaScript.
After nine months of development, Supabase introduced several platform updates as it progressed closer to its beta release. The dashboard now supports manual user creation alongside administrative actions such as deleting users and sending password reset emails or magic links. Database management gained direct browser support through a full Monaco SQL editor and new foreign key controls within the table editor. Platform reliability and security were addressed through a DigitalXRAID audit, default email confirmations on signups, and a dedicated status page tracking uptime and latency. Additional progress included community integration work with Vercel, Stripe, and Redwood, as well as an updated benchmarking suite for realistic server workloads.
Amid a constant stream of frameworks, languages, and platforms, the post argues that learning enduring principles is more useful than trying to absorb every new tool. It presents mental models as a checklist for prioritizing concepts, recording what matters, and making more informed decisions across engineering and management. Engineering examples include alerting on silent failures, queuing background jobs for faster responses and retries, using caching and denormalization for read-heavy workloads, and sharding or deliberate design choices for write-heavy systems. The post also recommends horizontal scaling for long-term growth, then turns to practices such as aligning incentives, clarifying product purpose, building rapport before feedback, and operating a few months ahead. The stated aim is to use these models to make more informed decisions rather than chase an ever-expanding list of new technologies.
Performance regressions can accumulate in a large monolithic Rails application, making it difficult to identify offending changes among thousands of daily commits. The post presents profiling and benchmarking as complementary practices: profiling locates runtime bottlenecks, while benchmarking compares code paths and validates fixes. It covers elapsed time, CPU versus wall time, object allocations, TracePoint and ObjectSpace, plus rbspy, stackprof, rack-mini-profiler, and App Profiler, which supports on-demand remote production profiling at Shopify. A flamegraph example showed garbage collection consuming about 35% of CPU time in a slow request, and the team inferred excessive Ruby object allocation; a Rails benchmark showed roughly 50x improvement from caching an order’s total price calculation. The discussion cautions against micro-optimizations whose gains do not justify code changes and recommends addressing larger performance issues first.
Kit began as a heuristic, rules-based virtual employee that simplified Facebook advertising for Shopify merchants by selecting products and budgets while defaulting other settings to best practices. The post describes its evolution into an artificially intelligent assistant that uses merchant spending behavior and store signals such as traffic and sales to recommend marketing actions. Kit's machine-learning design combines regression to predict likely spending with classification to estimate whether a budget and store state are likely to generate sales; training uses feature engineering, Apache Spark, Google Cloud ML Engine, and monitored model metrics. For real-time predictions, Bigtable stores engineered features, while a Tornado web container delegates model computation to TensorFlow Serving. The resulting system powered one third of Kit's marketing campaigns.
Shopify describes the challenge of scaling mobile development without slowing feature delivery as teams and projects adopt divergent tools, making knowledge sharing, cross-project contribution, and incident response harder. It extends ServicesDB, previously used to track production services, to treat mobile apps as services with owners and explicit expectations encoded in configuration files. Automatic checks cover ownership, contact information, CI and Shipit Mobile deployment configuration, internal-tool versioning, and production error and crash monitoring. Failed checks generate GitHub issues with remediation instructions, while the contract helps the Mobile Tooling team identify compatible projects and helps developers understand why tooling may not work. The implementation currently has basic checks, with planned work including mobile-app service-level objectives, easier project creation, and shorter build times.
Shopify describes how it versions APIs and manages breaking changes for an ecosystem of tens of thousands of partners. It releases date-based API versions every three months, with changes introduced in an unstable version and represented in the monolith through frozen records and a change file. Teams classify changes by whether third-party developers must migrate, use impact analysis and forward-compatibility testing, and protect uncertain changes with beta flags. For necessary breaking changes, tooling marks breaking or possibly breaking request paths, sends metadata through Monorail to a data warehouse, and produces reports on affected calls. Runtime conditionals then help teams manage old and new behavior, measure adoption, identify remaining risk, and communicate with developers.
Sam Saffron discusses Discourse’s approach to Ruby performance and monitoring, arguing that production memory constraints matter more than isolated microbenchmarks for many deployments. He favors clear code and selective optimization, sometimes bypassing ActiveRecord with MiniSql on performance-sensitive paths rather than broadly sacrificing Ruby’s readability. Discourse keeps performance under continuous observation, and Saffron describes budgets for dependencies, boot time, and high-profile pages, including alerts for query-count regressions. He identifies memory leaks as especially difficult to diagnose, describes bisecting an application to isolate a V8-Ruby interop leak, and says MRI remains the only feasible runtime for Discourse while memory profiling and analysis tooling remain substantially behind Java and .NET.
Grab needed a scalable logging platform to replace slow, fragmented systems that hindered debugging across their growing service fleet. Generating 25TB of daily logs, the team built a horizontally scalable Elasticsearch cluster configured via Ansible and monitored with Datadog. Although the initial proof of concept assigned all node roles (ingest, coordinator, master, and data) to every machine, operating at scale introduced major challenges with JVM heap exhaustion and cluster stability. The team resolved memory pressure and performance bottlenecks by tuning circuit breakers, lowering field data cache limits, adjusting shard allocations based on segment memory, and disabling translog compression during shard transfers.
As Grab migrated from a monolith to microservices, maintaining consistency, coordination, and code quality across rapidly expanding teams became a major engineering challenge. To address this, the Developer Experience team built Grab-Kit, a Go framework that automates service scaffolding, code generation, and distributed system design patterns. The framework uses Protocol Buffer definition files as a single source of truth to generate data transfer objects, communication bindings, and standardized middleware for logging and profiling. Grab-Kit also features declarative metrics definitions that synchronize with the DataDog API to build and update service dashboards automatically. Adopting the framework reduced development time for creating new services by up to 70% in teams such as GrabFood while improving overall system stability.
Grab experienced intermittent HTTP 5XX alerts when its Gothena service sent driver location updates to the Astrolabe service through an AWS Elastic Load Balancer (ELB). CloudWatch metrics revealed that requests were failing to reach healthy backend instances because of an uneven load distribution favoring a single ELB node in one Availability Zone. The team verified that Route 53 was properly using Alias records and ruled out OS-level DNS caching since Linux does not cache DNS queries by default. Connection inspection with netstat across multiple Go services confirmed a heavily skewed distribution of connections toward specific ELB IP addresses. Comparative tests with cURL, tcpdump, Go, Python, and Ruby in an isolated environment demonstrated that Go reused connections across requests while other runtimes opened new connections per request.
Grab describes how its service-oriented architecture makes cross-team production debugging difficult because engineers may lack familiarity with other teams’ code and architecture. Post-mortem reports are presented as the glue for shared understanding, but a sample incident entry lacks service context, bug detail, impact, chronology, and investigation steps. The proposed standard has four requirements—Chronology, Context, Empowerment, and Solutions—covering timelines, service internals, blameless educational diagnosis, and remedies across People, Product, and Process. A template includes initial symptoms, a timestamped timeline, log-based investigation with code evidence, temporary and permanent fixes, and improvement actions, while peer review by another team is required before finalization.
Datadog dashboards for the grab_attention cluster displayed periodic 1.5X step increases in Elastic Load Balancer (ELB) health check requests and ElastiCache Redis connections, creating the illusion of an untracked instance running outside Auto Scaling Group records. Inspecting instance hostname tags revealed that the existing two instances were simply receiving elevated ping counts from the load balancers. AWS Support clarified that ELB scaling events provision new nodes while keeping old nodes running for roughly 90 minutes to handle cached DNS clients. Investigation also revealed that two separate ELBs were attached to the cluster, altering expected request baselines. Furthermore, the application's health check endpoint initiated a non-pooled Redis connection on every request, directly translating load balancer pings into database connection spikes.
Instruments is a Go library for collecting application metrics over discrete time intervals, including request rates, latencies, data-structure sizes, and event durations. It supplies Counter, Rate, Reservoir, Gauge, Derive, and Timer instruments; values represent only the latest time-window and are read through a single-reader Snapshot operation. Composition is central: instruments implement either Discrete, returning one int64, or Sample, returning a slice, so custom instruments can wrap existing ones; the example embeds a Reservoir in an http.Handler to record upload request sizes. Derived instruments build on this model, with Derive using Rate and Timer using Reservoir, while Quantile, Mean, and reporting utilities process snapshots. An optional registry and logfmt reporter support periodic output, but applications can also send selected values to systems such as Graphite or use them for control signals.
The best engineering reads, once a week.