Anomaly Detection: From Baseline to Action
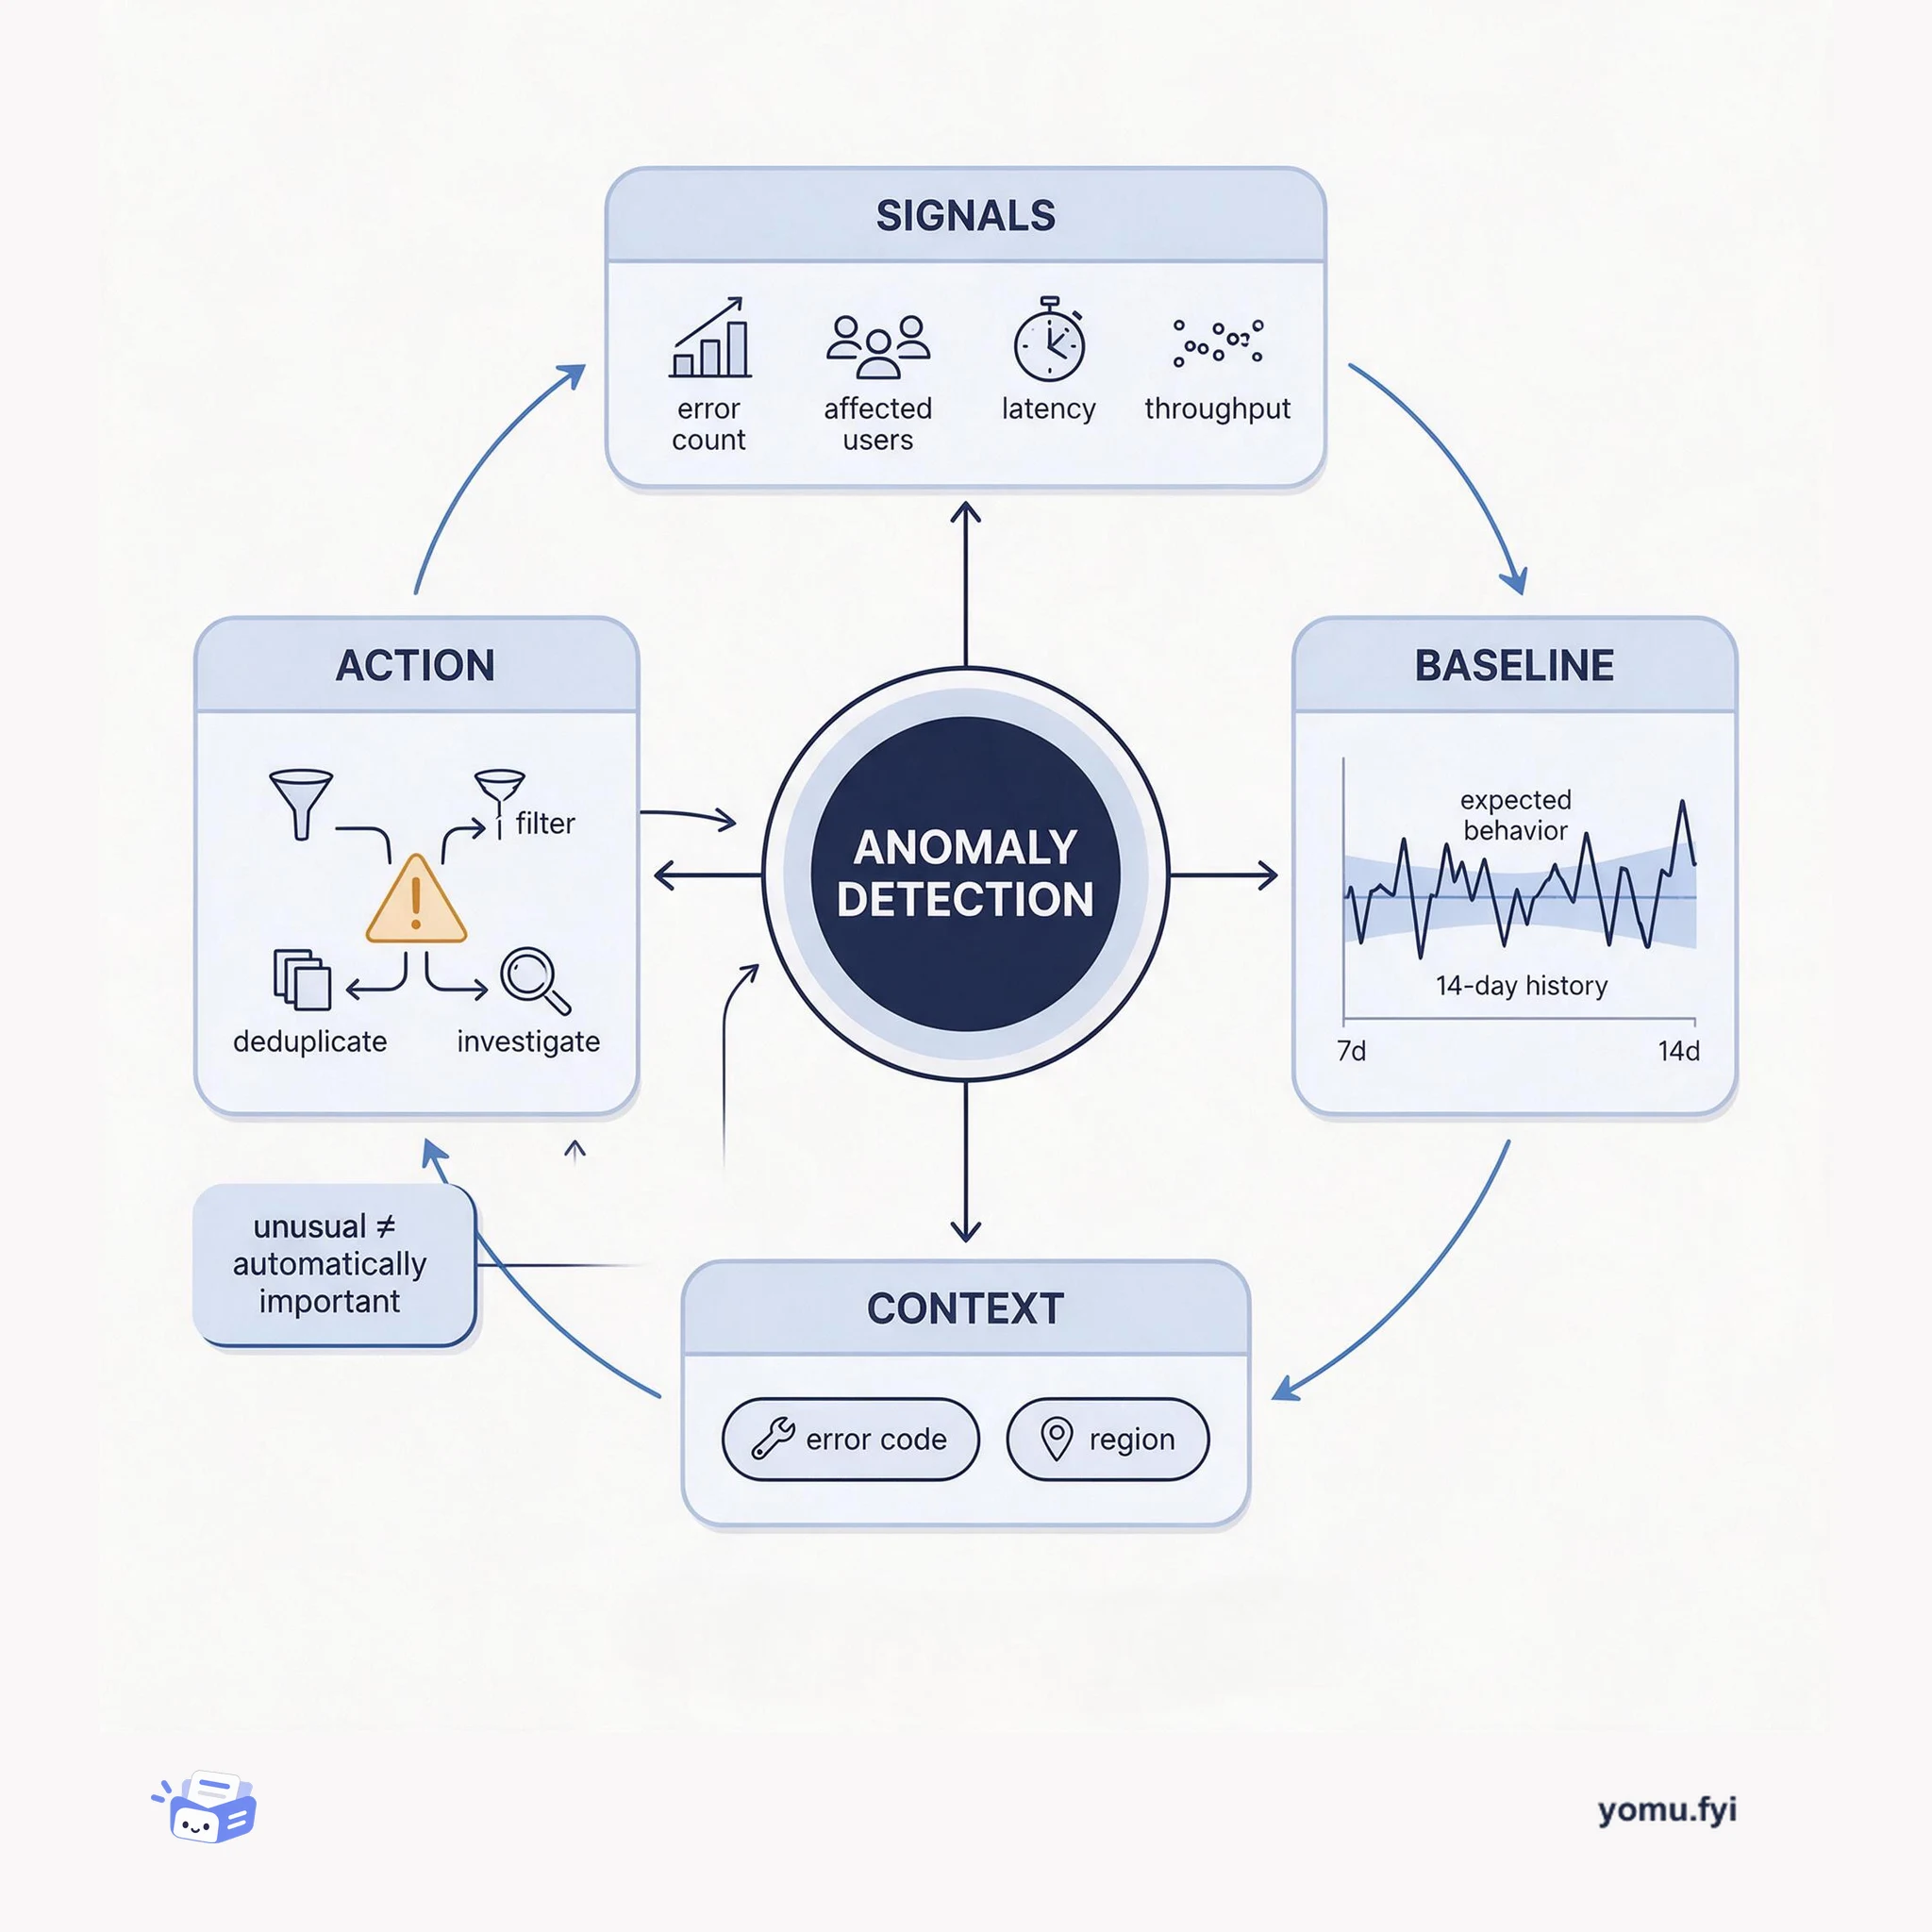
Anomaly detection identifies meaningful departures from expected behavior. This explainer shows how signals, baselines, context, and alert routing turn unusual measurements into engineer-ready findings.
Loading…
Topic
198 posts about Monitoring. Every summary links to the original.
See the idea
Anomaly detection identifies meaningful departures from expected behavior. This explainer shows how signals, baselines, context, and alert routing turn unusual measurements into engineer-ready findings.
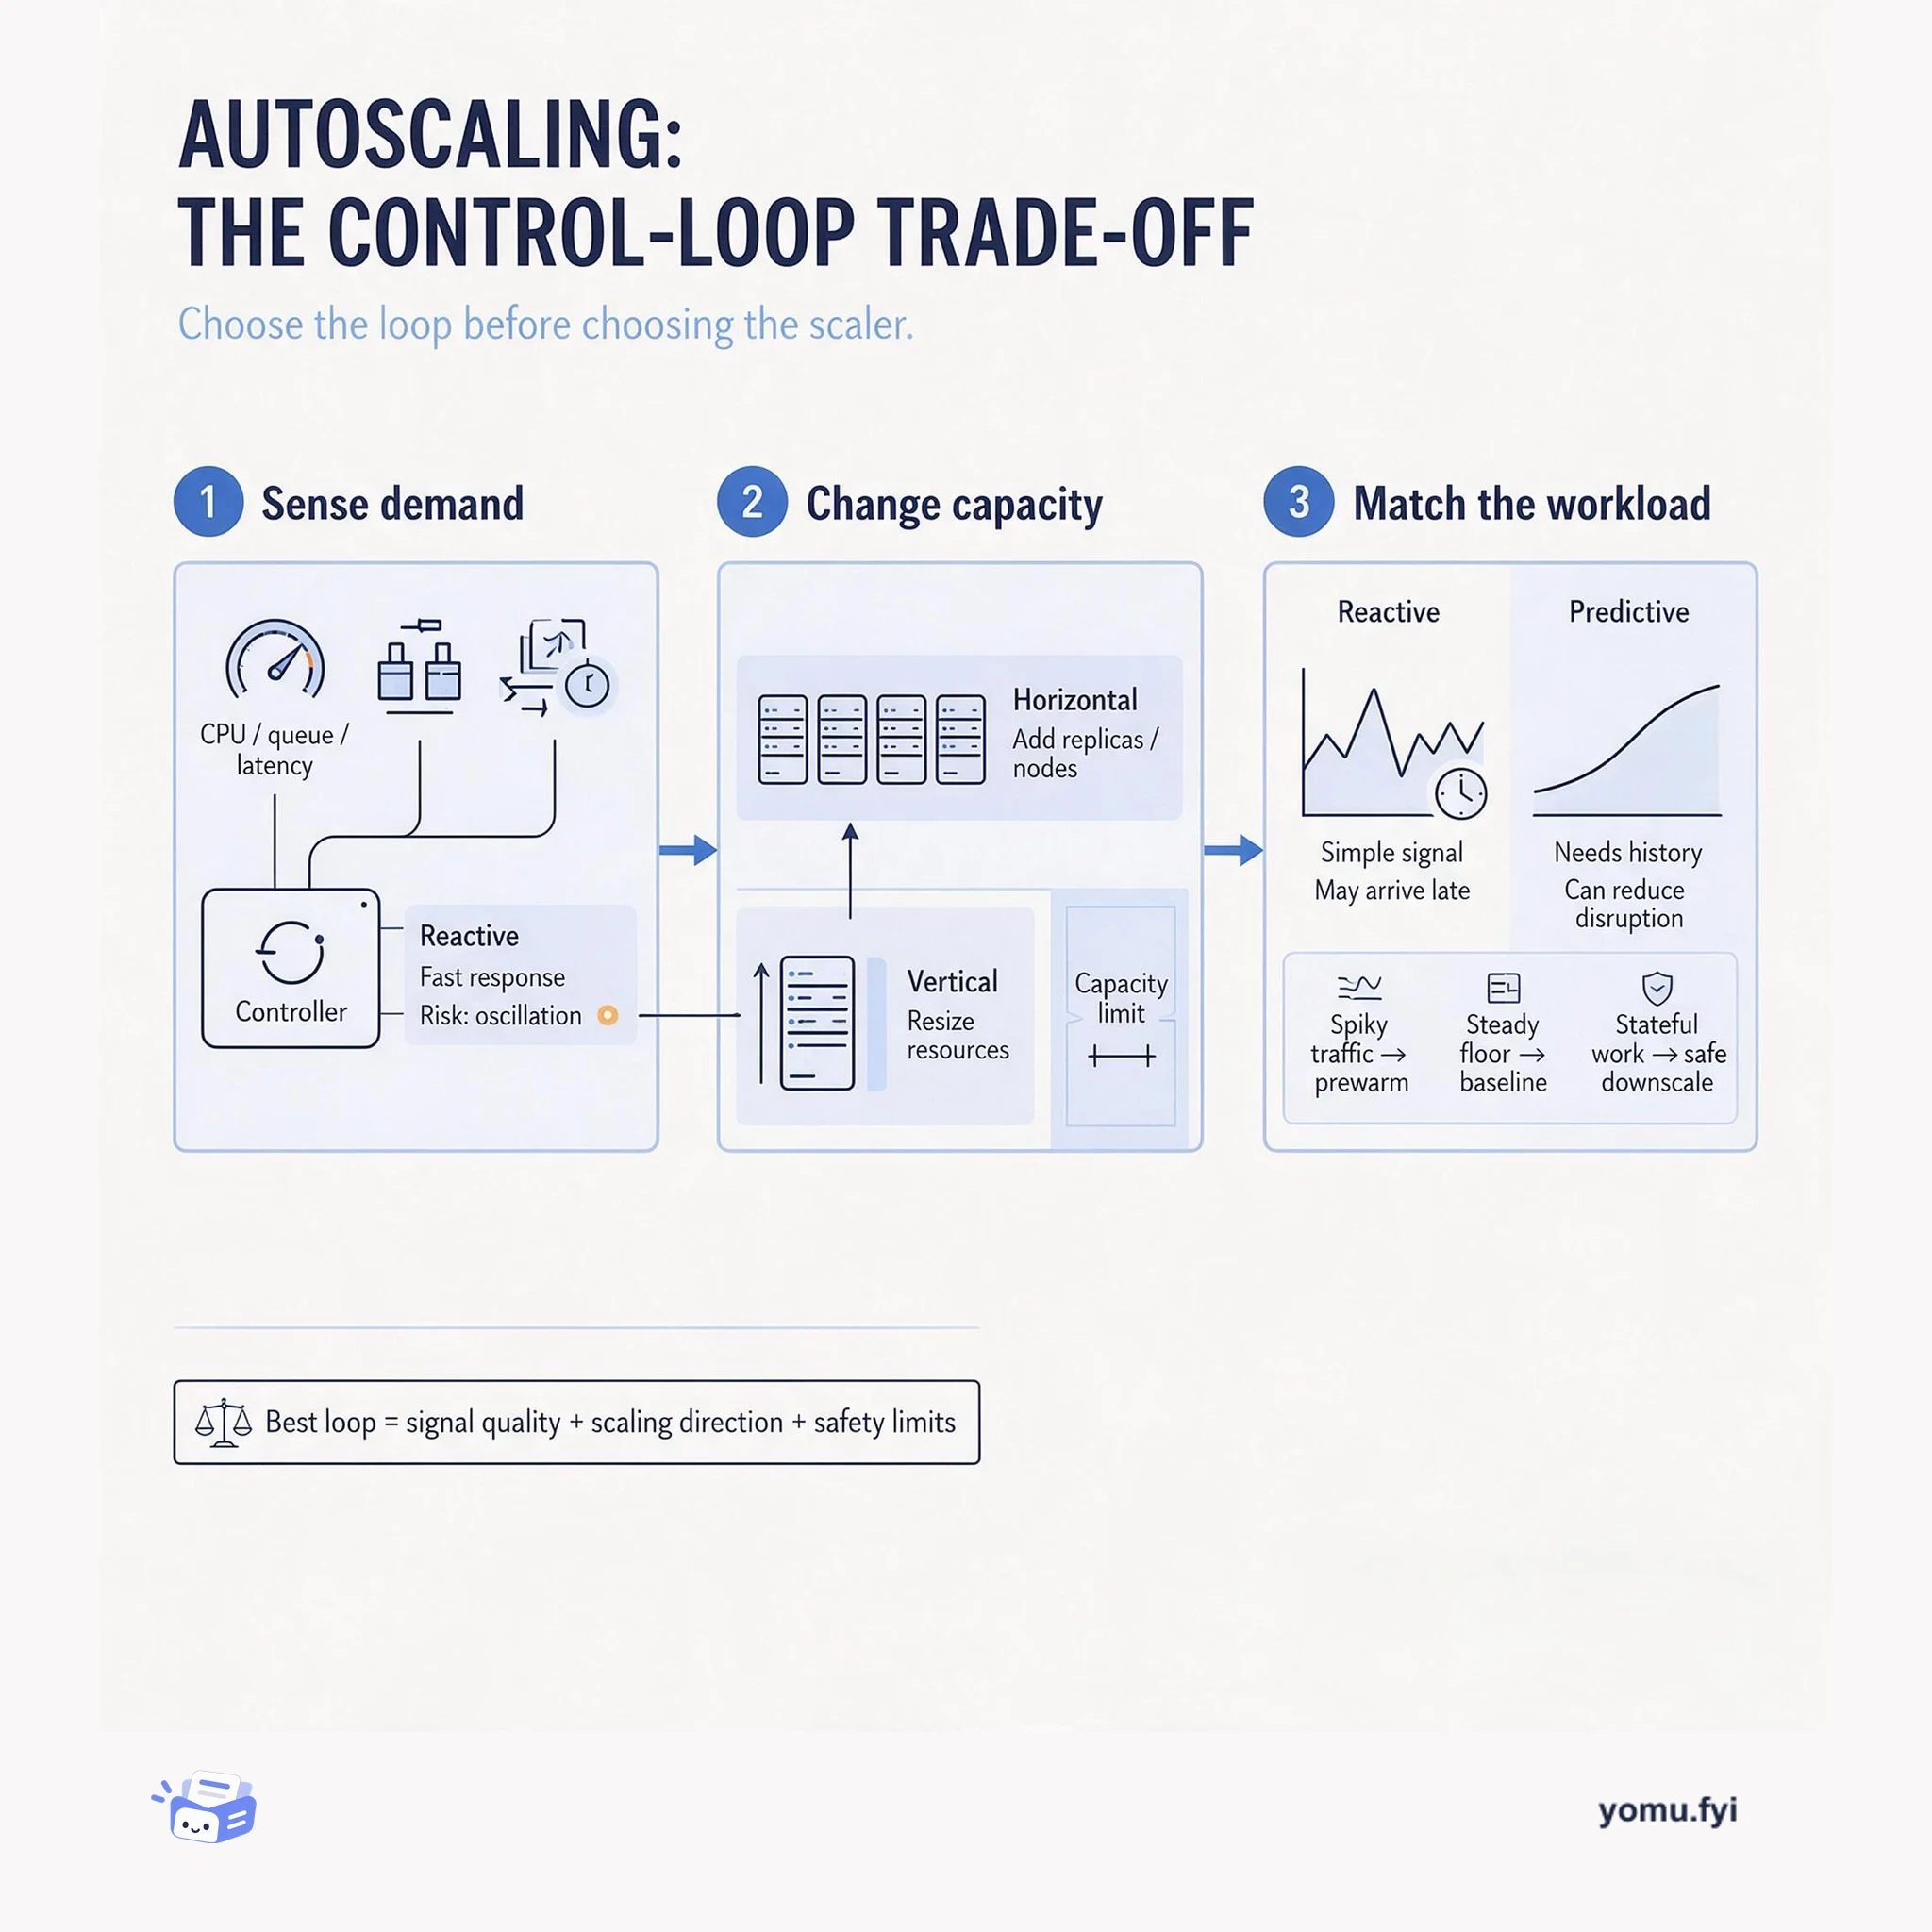
Autoscaling trades responsiveness, stability, and cost: this explainer shows how signal choice, scaling direction, and capacity limits shape the right control loop for a workload.
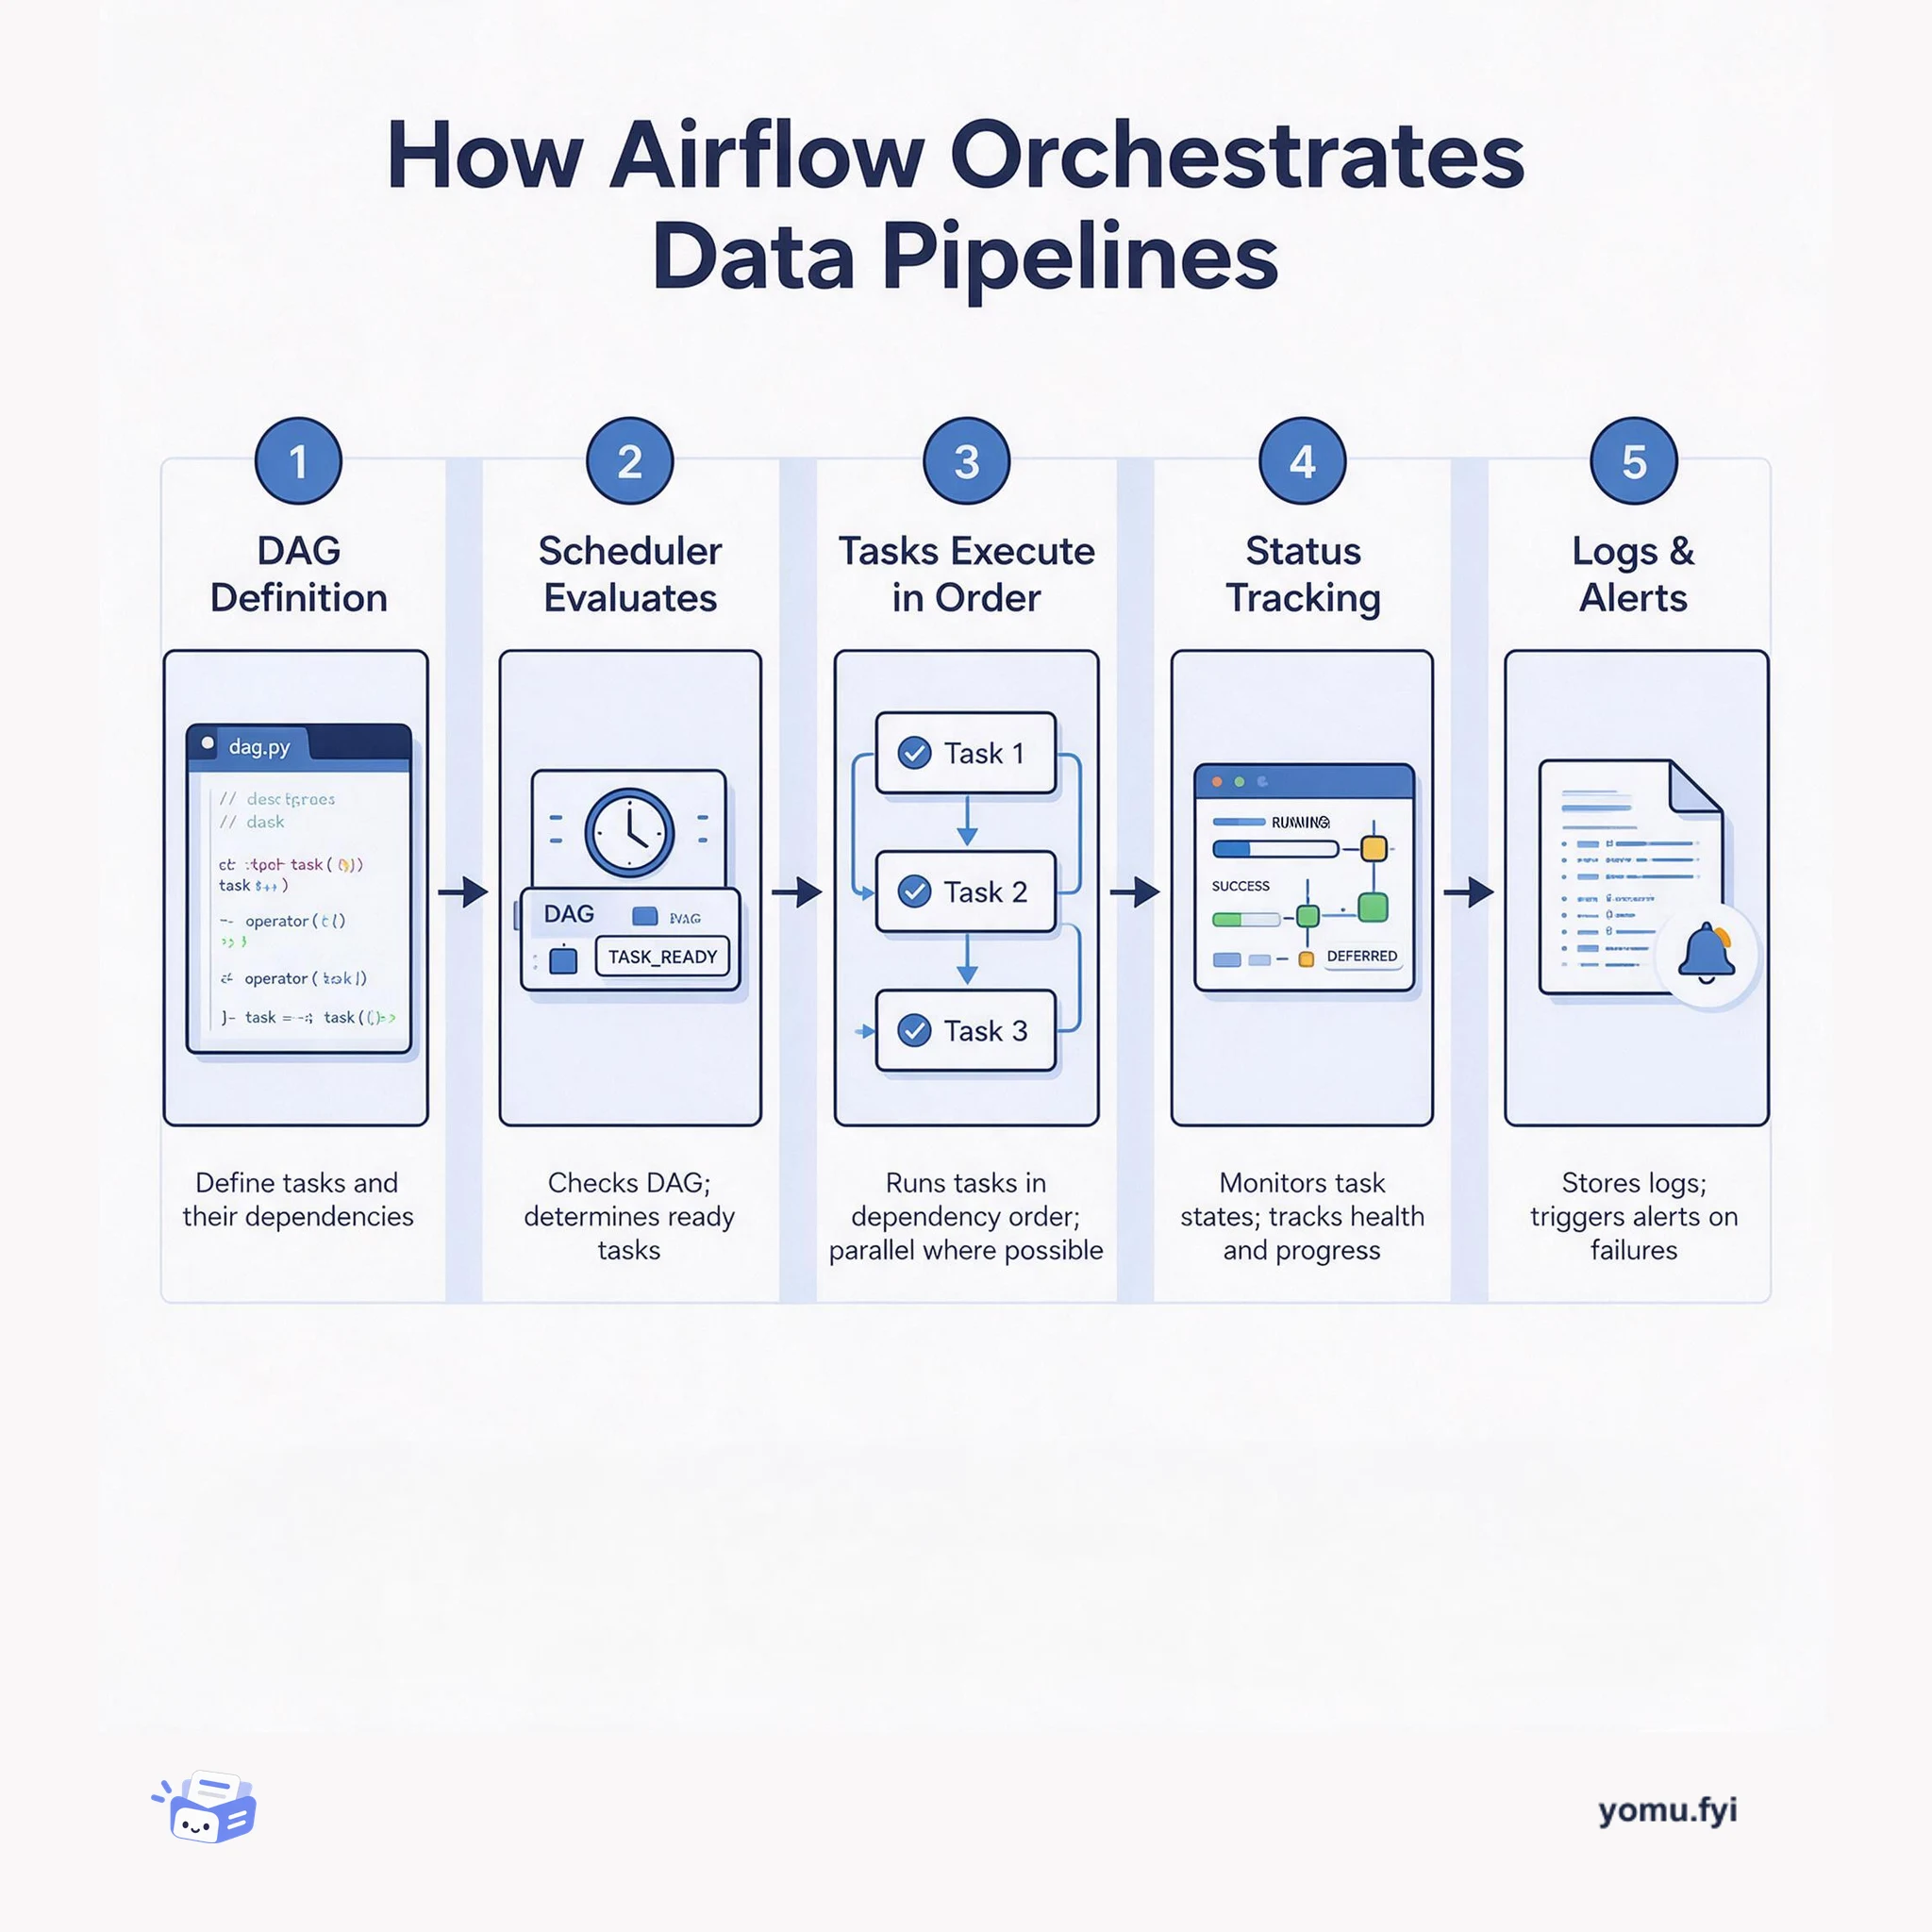
Airflow is a workflow orchestration platform that schedules, monitors, and manages data pipelines by defining tasks as code, executing them in dependency order, and tracking their success or failure.
The Good Stuff
Paid picks we use ourselves. Links carry a referral code — a subscription through one earns us a commission at no extra cost to you.
Newest first
Shopify needed a reliable way to measure React Native rendering times and verify that mobile apps remained as fast as native while adopting React Native. The open-source @shopify/react-native-performance library measures app startup, navigation, and screen re-render times by timing from native startup, a user action, or a UI event until a screen is fully rendered and interactive. It uses an invisible marker view with a native counterpart to capture end-to-end timing, including React Native-to-native bridge communication, and models incremental rendering as interactive or non-interactive render passes in a state machine. Reports can be sent through onReportPrepared to analytics tools such as Amplitude, where percentile TTI dashboards compare screens over time, expose bottlenecks, and help catch regressions; Shopify also uses screen-level Apdex internally.
Dedicated vehicular inertial measurement units are prohibitively expensive to install across large fleets, while customer feedback lacks the coverage required to assess driving safety comprehensively. To monitor driver behavior at scale, Grab processes smartphone sensor data collected via a mobile telematics SDK at high sampling frequencies. A custom orientation algorithm calculates Euler roll and pitch angles from gravity and resolves yaw through principal component analysis to align phone measurements with vehicle axes. The pipeline applies low-pass or Kalman filtering to handle varying noise levels, followed by threshold peak-finding algorithms to detect harsh acceleration, braking, and cornering. Speeding events are identified by comparing GPS speeds against known map limits or aggregated speed profiles derived from free-flowing traffic.
Shopify’s Trust team faced rising complexity in securing a distributed device fleet, including many tools, provisioning and patching work, varied networks, and the loss of in-person remediation. Hubble was built as a unified layer over mobile device management and other security systems, ingesting and standardizing their data while sending commands back with granular access controls and centralized auditing. IT staff use it for inventory, device management, and security, while employees can view device health and compliance, receive remediation guidance, and manage test-device or beta participation. The platform also serves as a standardized source for automation, and the post presents encapsulation and cross-team investment as ways to reduce administrative overhead, support proactive security, and limit risk.
Supabase reports achieving SOC2 Type 1 compliance and later updates the announcement to say it is SOC2 Type 2 compliant. The post explains SOC2’s five Trust Services Criteria and distinguishes Type 1’s point-in-time audit from Type 2’s observation period, while framing customer expectations and data stewardship as the main reasons for pursuing certification. Supabase used Vanta to monitor controls and collect evidence, selected an auditor familiar with SaaS companies and Vanta, and formalized practices covering device security, access control, policies, logging, monitoring, vendor reviews, and repository protection. The process still required substantial manual evidence, and the company found that audit scope and auditor expectations mattered more than achieving a perfect automated-tool score. Supabase also launched a security center and identified HIPAA certification as a next step.
The post distills lessons from five years working on Shopify’s payment infrastructure into guidance for building systems that tolerate failure and large-scale traffic. It frames the advice partly around onboarding developers who were new to payments or Shopify’s scale, and notes that load testing for BFCM 2021 began in July with globally distributed load generation. It recommends low timeouts across HTTP clients and data stores, circuit breakers such as Semian, and capacity reasoning with Little’s Law, rate limiting, and load shedding. Monitoring should cover latency, traffic, errors, and saturation, while structured, machine-readable logs make centralized records searchable; load tests use benchmark gateways that mimic production partner latency and capacity. For incidents, Shopify uses defined roles, Slack-based coordination, and retrospectives that turn incorrect assumptions into safeguards and training material.
Machine learning leaders in financial institutions face significant operational hurdles when integrating automated models into production environments. Practitioners must navigate complex legacy architectures, strict regulatory oversight, and privacy mandates tied to personally identifiable financial records. Integrating models often fails when organizations lack clear communication buffers, deploy models using improper prediction windows, or treat systems as opaque black boxes without verifying underlying mechanics. Despite these challenges, financial applications increasingly rely on machine learning for anti-money laundering compliance, automated fraud screening, and loan underwriting. Success in this regulated sector demands comprehensive evaluation across representative input spaces, robust ongoing model monitoring, and explainable decision outputs.
Supabase announced several platform updates and performance improvements across its database, hosting, and developer tooling ecosystem for May 2022. Developers managing preview deployments on Jamstack platforms like Vercel and Netlify can now configure wildcard redirect domains such as *.mydomain.com/welcome. For serverless workflows, Edge Functions support a -no-verify-jwt CLI deployment flag to facilitate direct invocation via external webhooks without mandatory token validation. In addition, Supabase exposed a Prometheus-compatible metrics endpoint to all users for real-time project monitoring and alerting. Database security policies also gained a dedicated Target roles configuration, replacing older role check expressions and cutting query execution time from 46 seconds to 7 milliseconds in one customer deployment.
Supabase announced the launch of its Enterprise Plan alongside new features integrated across existing tiers. The Pro Plan now merges pay-as-you-go billing with a default twenty-five dollar monthly spend cap, and users gain access to self-serve database add-ons for on-demand scaling. A new Log Explorer powered by the Logflare acquisition allows querying logs directly with SQL, providing ninety days of retention on the Enterprise tier. Dedicated enterprise capabilities include Point-in-Time Recovery powered by the open-source tool WAL-G, custom Prometheus scraping endpoints for observability, and guaranteed support service level agreements. Additionally, Supabase achieved SOC2 Type 1 compliance and introduced Elixir Livebooks to monitor PgBouncer connection pools.
The guide addresses the problem of turning product success after launch into concrete metrics that reflect user impact rather than model or pipeline performance. It recommends starting with end-user goals, defining a main product goal and subgoals, translating them into primary questions, and selecting metrics before building a measurement plan. In Shopify’s example, the contextual analytics experience surfaces inventory data, with adoption measured through shops interacting with its navigation bar and product goals progressing from data-aware to data-savvy merchants. Metrics should be simple, precise, feasible, sensitive, and directional, while tripwires or anti-success metrics identify unwanted outcomes alongside desired gains. The plan pairs metrics with comparison measures and benchmarks, supports segmentation by merchant characteristics, and separates short-term, mid-term, and long-term measurement periods so results can be interpreted after release.
Shopify’s Application Security team reports on its 2021 bug bounty results and announces program changes for 2022. Effective immediately, the maximum bounty for a CVSS 10.0 issue doubles from $50,000 to $100,000, with higher High and Critical brackets, while Shopify Plus, Shop, and Shop Pay services move into the Core asset category; mobile-client-specific issues remain Non-Core. The program received more than 3,000 reports, paid over $1 million in bounties and bonuses, and saw approximately 23% of reports judged valid, up from 19% in 2020. After its first full year using CVSS-based scoring, Shopify reports more consistent decisions and a reduction in average time to bounty from 249 hours to 137, while adding a CVSS guide, more resources, and further open-source support.
On September 30th, 2021, Shopify nearly suffered a platform-wide outage after Let’s Encrypt’s old root certificate expired, exposing stale certificate data in internal clients rather than at the public edge. At 10:15 a.m., monitoring detected certificate errors after deployment-related connection changes, and investigation traced them to Ruby services that depended directly or indirectly on httpclient, whose embedded cacert.pem was six years old and did not trust the applicable certificate chain. Shopify forked the library, replaced cacert.pem with a current root certificate bundle, deployed it to canaries, and automated pull requests for affected repositories. The temporary fix restored the monolith, while systems were added to track root-certificate changes and update the fork automatically. Deployment locking kept most monolith pods from cycling, limiting the incident to canaries and causing secondary effects including delayed order confirmations, throttled marketing campaigns, and missing product recommendations.
Supabase announced the acquisition of Logflare, a realtime log ingestion and analytics platform. Modern database architectures encompass APIs, authentication, storage, and CDNs, requiring unified observability to diagnose slow queries and trace user requests effectively. Built with Elixir—the same language powering Supabase's Realtime Engine—Logflare automates schema adaptation for streaming inserts and enables developers to construct APIs from SQL queries via Logflare Endpoints. The integration roadmap includes embedding log querying with SQL directly into the Supabase Dashboard, maintaining existing integrations for Vercel and Cloudflare, and transitioning Logflare toward a fully open-source implementation with multiple backend storage engines. Over the coming months, existing Logflare users will be migrated to the Supabase platform under matching pricing tiers.
Core Web Vitals were introduced by Google in 2020 as unified guidance for web UX, and their loading, interactivity, and visual stability metrics became one factor in ranking systems after rollout from mid-June through the end of August 2021. The article explains LCP, FID, and CLS, including how LCP identifies the largest visible element, FID measures delay before the browser responds to a first interaction, and CLS sums unexpected layout shifts. It gives good and poor thresholds of 2.5 seconds and 4 seconds for LCP, 100 milliseconds and 300 milliseconds for FID, and 0.1 and 0.25 for CLS, with intermediate scores needing improvement. Recommended improvements include updating dependencies and tree-shaking unused library code, preloading critical assets, improving server response time, lazy-loading below-the-fold content, compressing images, and reserving image space to prevent shifts.
KateSQL, Shopify’s Database-as-a-Service platform on GKE, investigated why otherwise comparable MySQL Pods took between 10 and 30 minutes to be created during instance replacement. Measurements found extreme differences for Pods with identical resources and datasets: one required 2,120 seconds for initialization and 1,104 seconds for startup, while another took 74 and 17 seconds, respectively; affected Pods also accumulated more slow queries involving temporary memory tables. Profiling showed InnoDB’s single-threaded buffer pool initialization spending substantial time in mmap calls and the Linux memory cgroup function mem_cgroup_commit_charge, while affected nodes had roughly 50,000 memory cgroups. The team linked the slowdown to a Linux kernel cgroup memory leak and slab reparenting behavior, then improved performance through node replacement, memory.force_empty testing, and GKE 1.18 upgrades with relevant fixes.
YJIT’s benchmarking site combines open-source benchmark runners with Jekyll, GitHub Pages, and GitHub Actions to publish frequently refreshed results. The author wanted to compare Ruby configurations, expand reporting beyond console output, and avoid recurring operational work. Benchmarks run on an AWS instance rather than in GitHub Actions, while Actions schedules jobs, uses repository secrets for SSH, and commits generated data back to the repository; Jekyll builds the Pages site from that data. Reports include D3.js and Ruby-generated SVG graphs, tables, textual summaries, and JSON tripwire data that can trigger an issue when performance drops too far. The reported results show YJIT 20.6% faster than interpreted CRuby and 17.4% faster than MJIT, with Railsbench gains of 18.5% and 21.0% respectively.
Supabase announced the winners and runners-up for its inaugural open-source hackathon after concluding deliberations across a larger-than-expected pool of entries. Top entries included Work From, an employee schedule tracking application, and Fireplace, a video streaming platform that leverages Supabase Storage to synchronize playback events across multiple viewers. Additional recognized projects encompassed Feature.so for modular application component management, Flutter Add-ons for telemetry and crash reporting, and Peckish Peach, which uses machine learning to generate recipes from input ingredients. All submitted projects remain fully open source for community inspection, contribution, and forking. Gold and silver prize winners receive custom limited-edition Supabase apparel, while every hackathon participant receives a participation prize.
Supabase introduced a dedicated Reports section and updated project home pages to deliver observability across hosted Postgres projects and complementary services. Because developers can run unconstrained database queries and custom workloads, monitoring both project-level service usage and underlying infrastructure metrics is essential. The new dashboard displays one month of historical data, including CPU and memory usage alongside request volumes for Database, Auth, and Storage APIs. To collect metrics across hundreds of thousands of targets without high latency, Supabase implemented a federated monitoring architecture running regional Prometheus instances that scrape local exporters and aggregate subsets into a central VictoriaMetrics instance. All project databases now also launch with the pg_stat_statements extension enabled for future query statistics.
Shopify’s Trino-based interactive query infrastructure faced inconsistent latency and operational failures as workloads grew to 15 Gbps and more than 300 million rows per second. The team analyzed query volumes, resource-heavy datasets, CPU wall time, and failure scenarios, then used a Trino Query Replicator to reproduce historical degradation and isolate issues involving compressed Kafka JSON, shared cluster classes, resource allocation, JVM settings, and dataset statistics. They added workload-specific and ephemeral clusters, reduced concurrent queries, applied recommended JVM recompilation settings, and limited task drivers to 16; they also scaled worker pods to 61 cores and 220 GB memory, although scaling alone was unstable. The infrastructure changes produced a stable environment and reduced P95 execution time to below 30 seconds, moving more queries into the zero-to-five-second range, while the five-second target remained a future goal.
Monitoring Elixir applications on Fly.io, the post presents a way to add production visibility without administering a Prometheus instance. Fly.io’s managed service scrapes an application’s metrics endpoint at a configured interval, with fly.toml specifying the port and path; Prometheus stores the resulting time-series snapshots and Grafana queries them with PromQL. PromEx supplies Elixir instrumentation through plugins for components such as the application, BEAM, Phoenix, Ecto, and Phoenix LiveView, while optionally uploading dashboards and annotating application lifecycle events through Grafana’s HTTP API. The example enables Fly.io metrics on port 4000 at /metrics and configures PromEx dashboards for a Todo List application. The stated result is an instrumented application with dashboards and annotations in minutes, while monitoring can also support rollback decisions, stress-test analysis, prioritization, and capacity planning.
After completing ten online experiments over the past year, the author describes recurring statistical and implementation traps that can distort experiment results. The discussion stresses choosing independent randomization units, examining whether the analysis unit matches the randomization unit, and using simulations to test suspected false-positive effects before changing an experiment plan. It also shows how request-level traffic analysis and close collaboration with engineering can avoid unnecessary implementation work, while generous logging, A/A tests, and investigation of sample ratio mismatches can expose redirect failures or qualification bugs. The author reports that switching one experiment’s analysis unit from session to user changed its result from negative to positive, and argues for monitoring results without stopping early, investigating anomalies, and slicing averages across important user segments.
The best engineering reads, once a week.