Anomaly Detection: From Baseline to Action
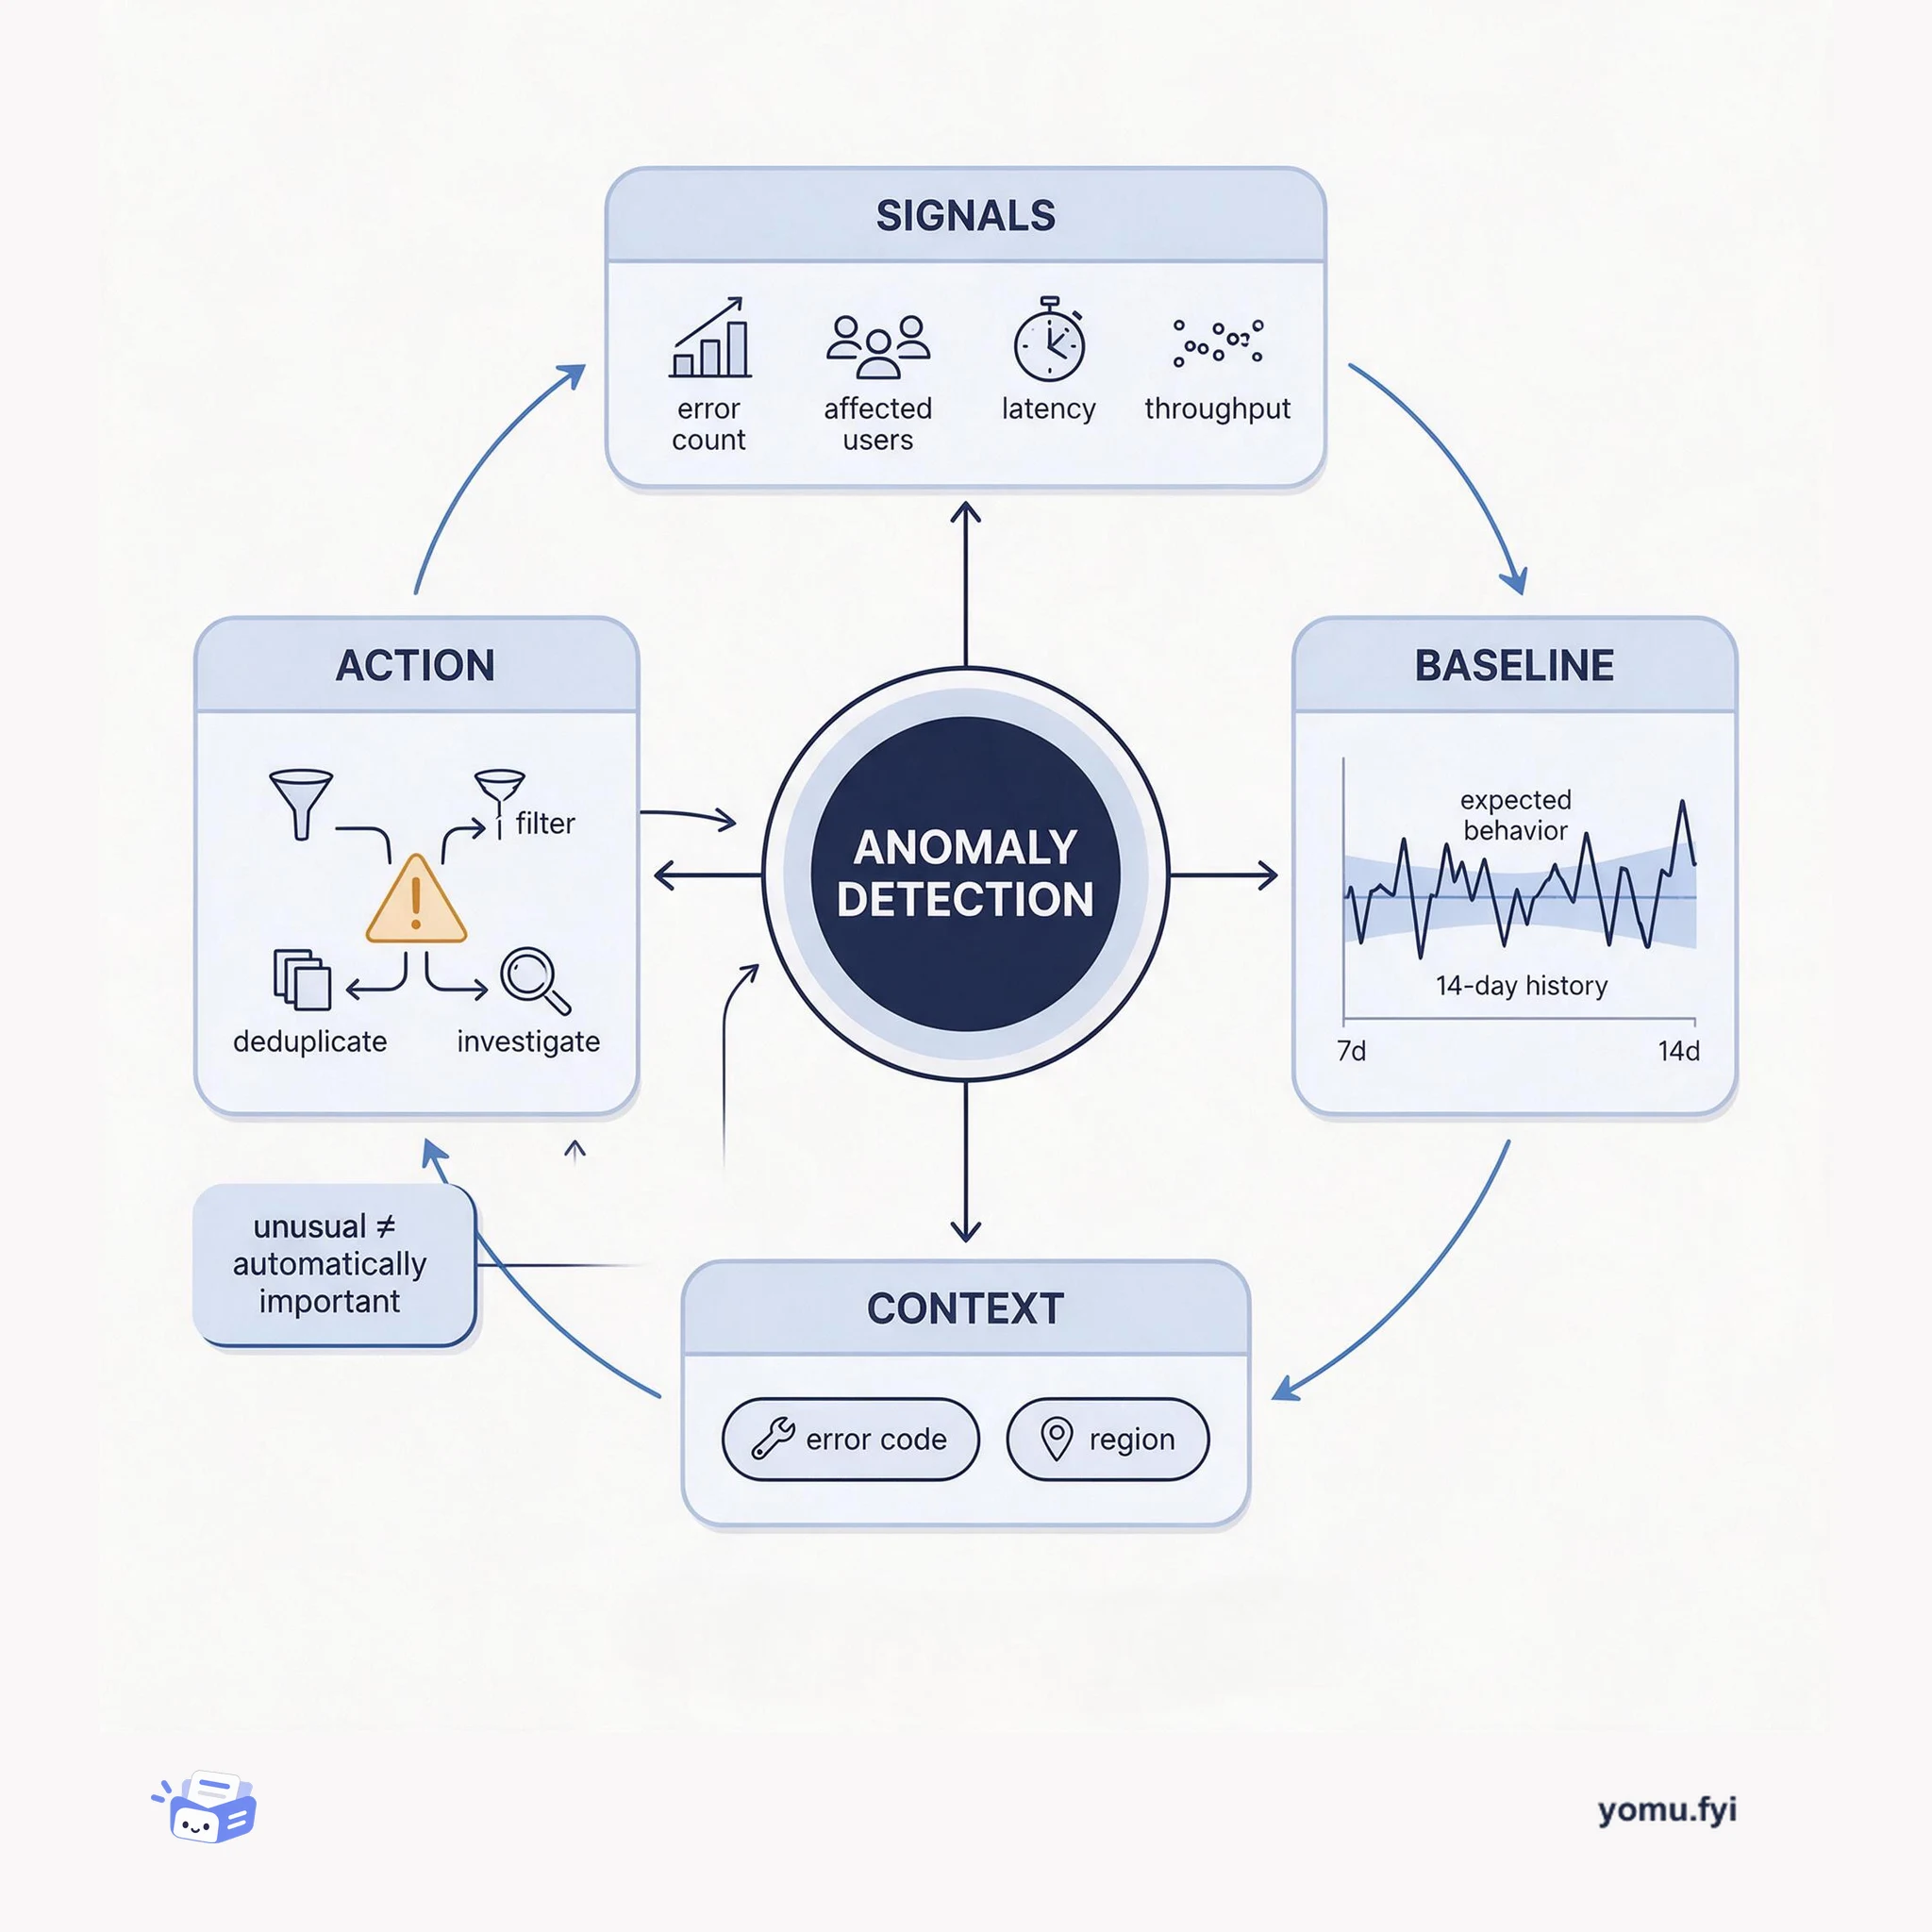
Anomaly detection identifies meaningful departures from expected behavior. This explainer shows how signals, baselines, context, and alert routing turn unusual measurements into engineer-ready findings.
Loading…
Topic
196 posts about Monitoring. Every summary links to the original.
See the idea
Anomaly detection identifies meaningful departures from expected behavior. This explainer shows how signals, baselines, context, and alert routing turn unusual measurements into engineer-ready findings.
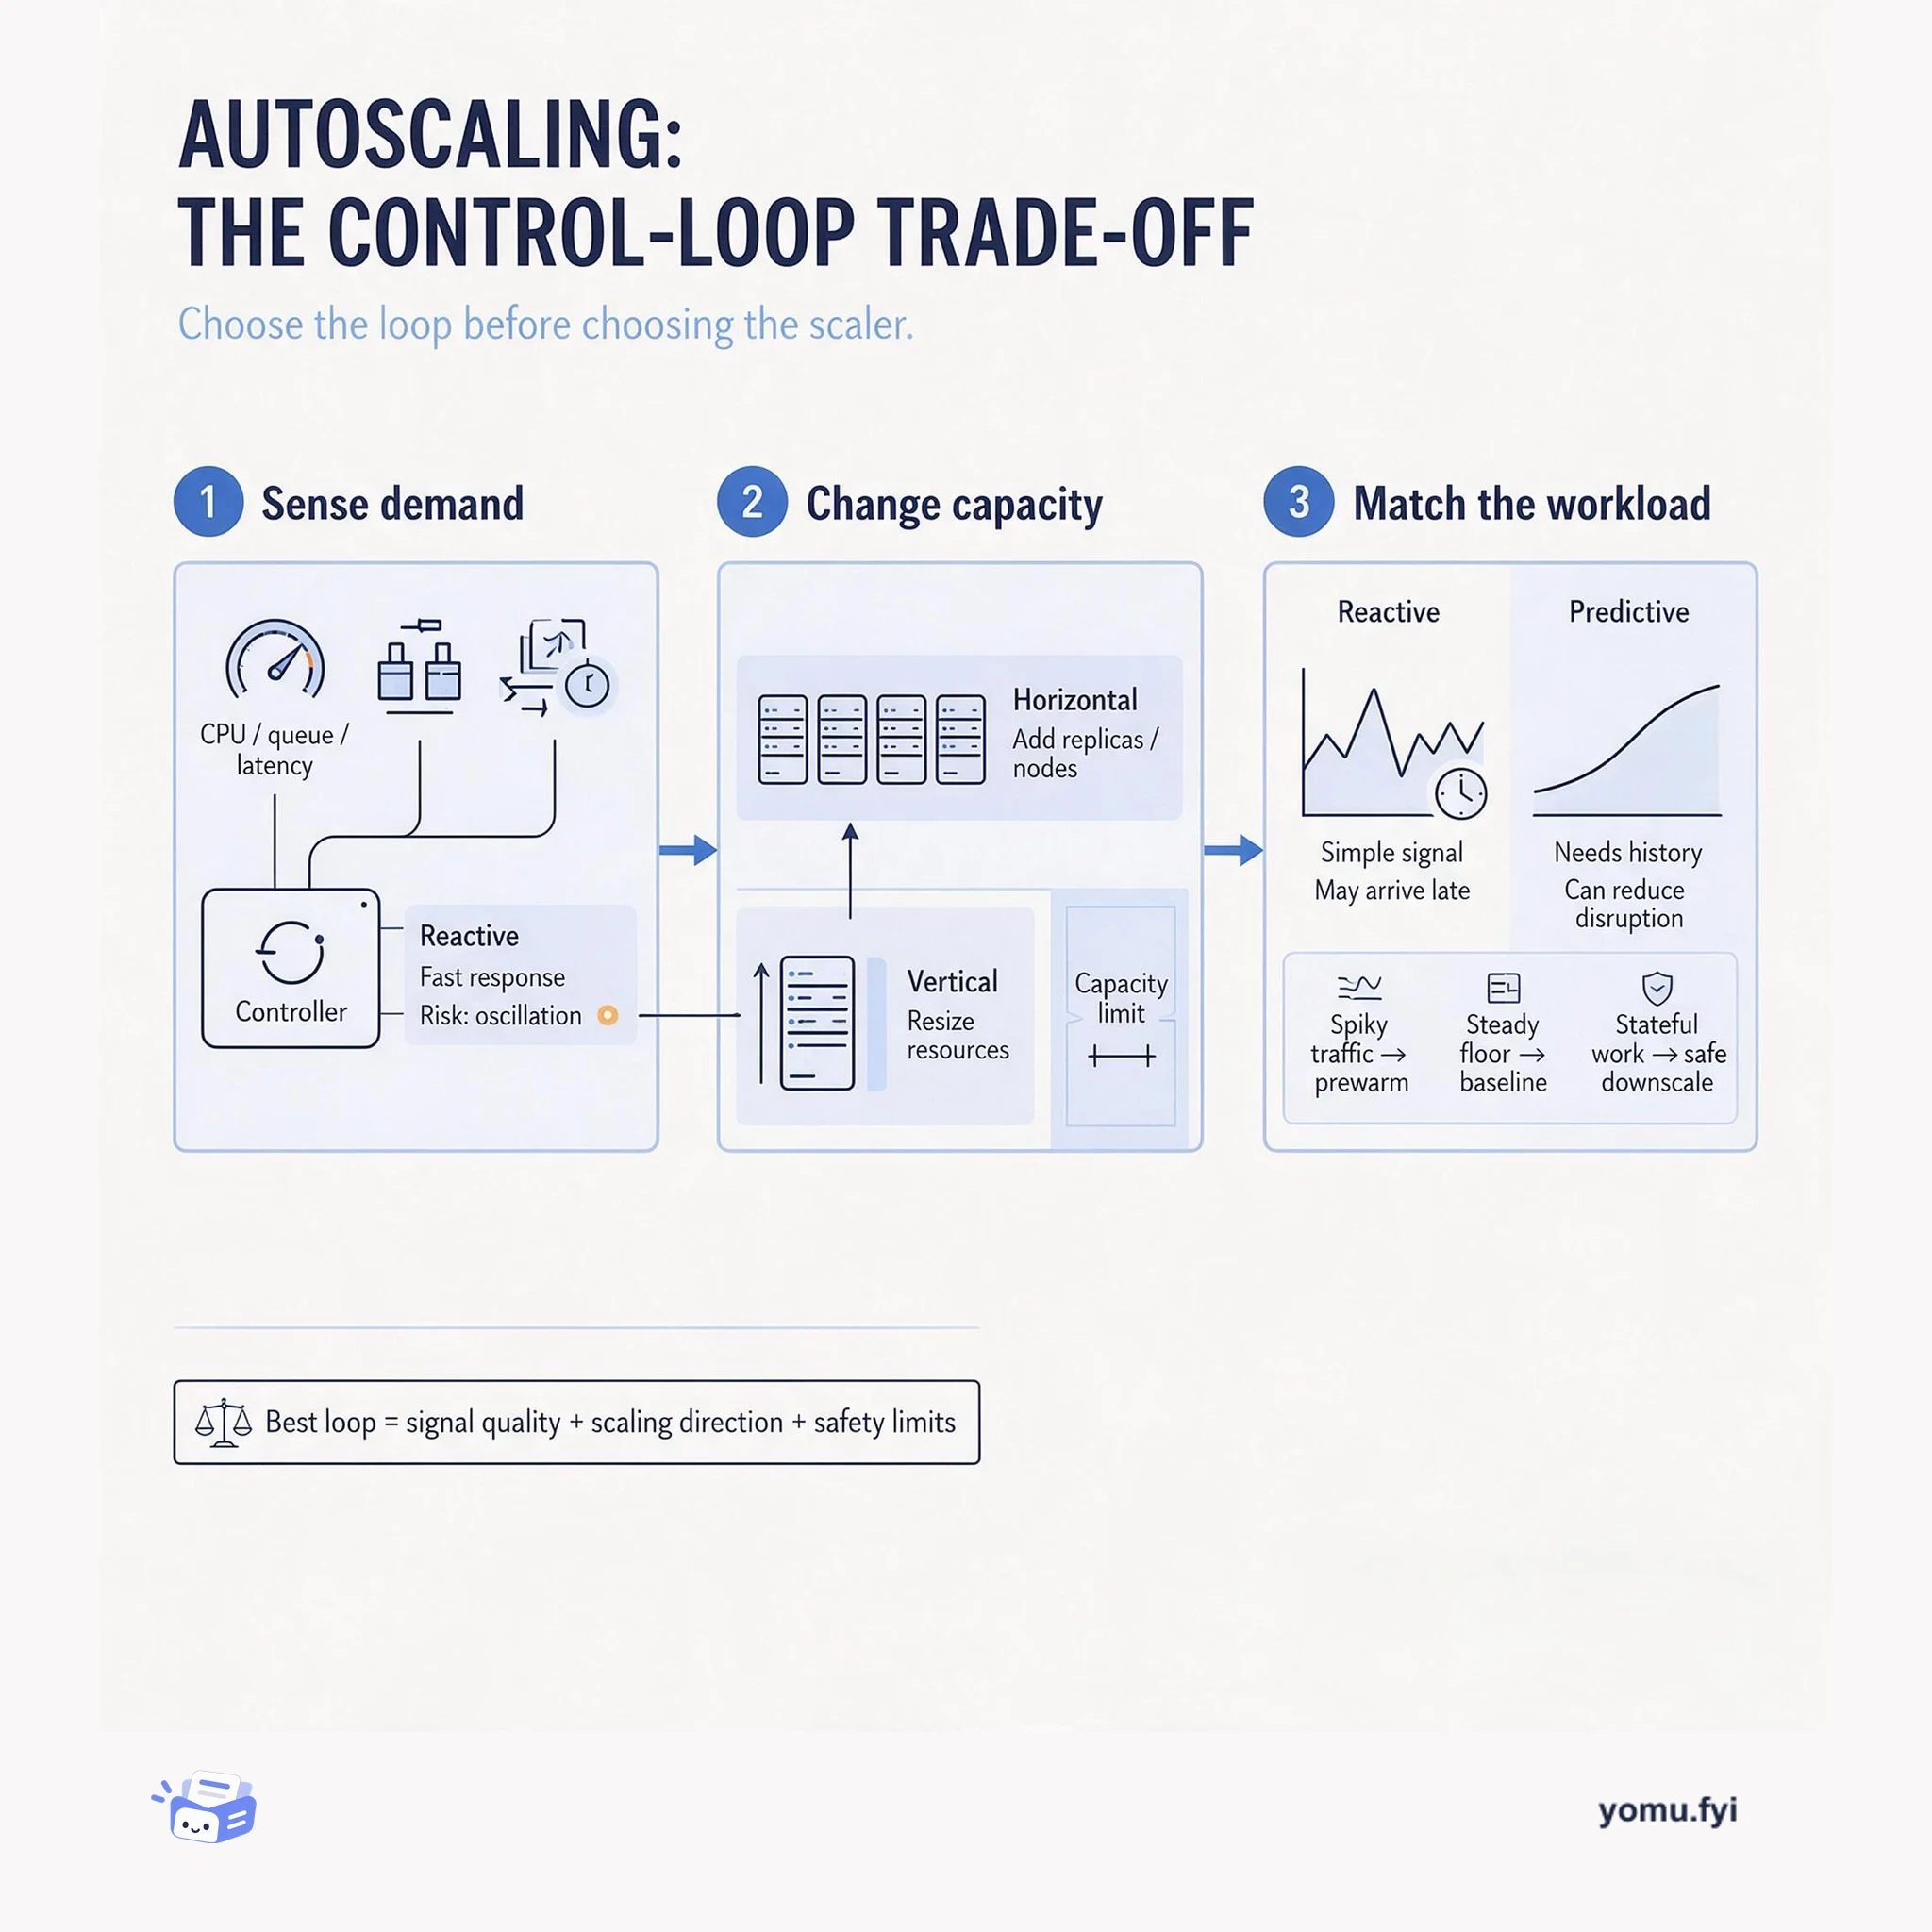
Autoscaling trades responsiveness, stability, and cost: this explainer shows how signal choice, scaling direction, and capacity limits shape the right control loop for a workload.
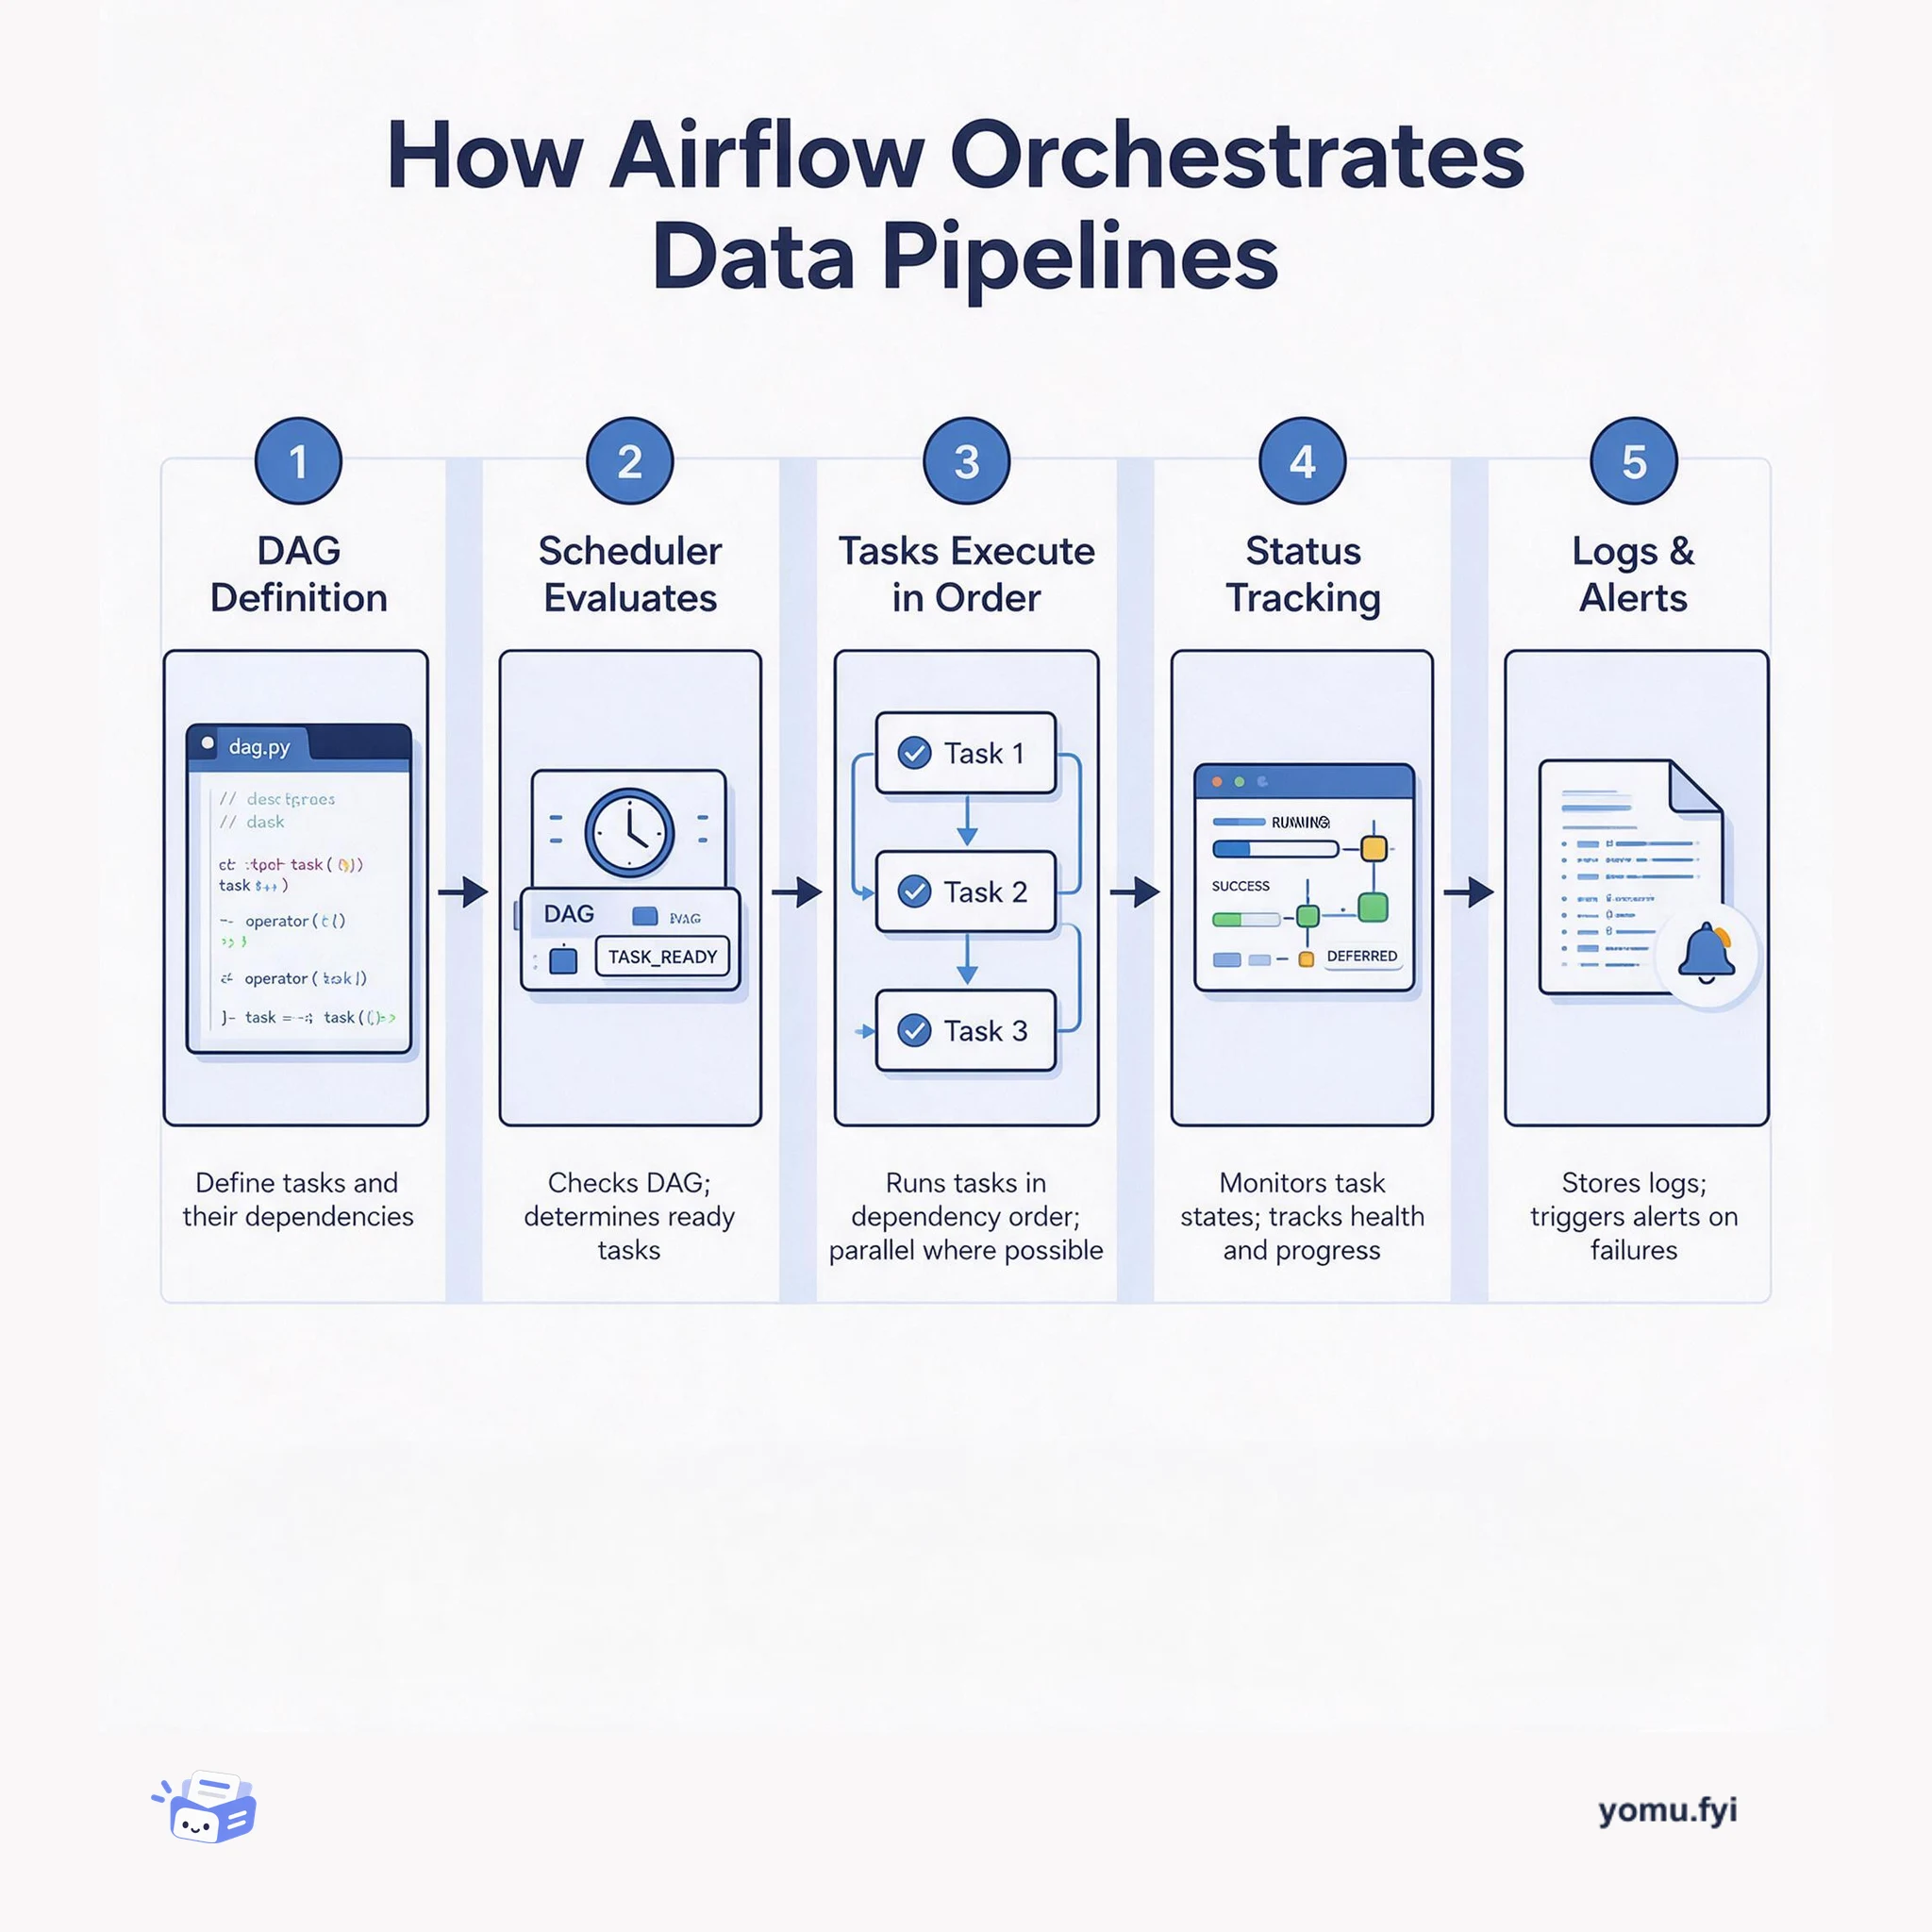
Airflow is a workflow orchestration platform that schedules, monitors, and manages data pipelines by defining tasks as code, executing them in dependency order, and tracking their success or failure.
The Good Stuff
Paid picks we use ourselves. Links carry a referral code — a subscription through one earns us a commission at no extra cost to you.
Newest first
Enterprise data governance tools address fragmented data estates in which teams struggle to locate assets, identify ownership, protect sensitive information, and maintain consistent quality across warehouses, lakes, SaaS applications, and spreadsheets. Positioned above storage and compute, these tools read metadata, schemas, and query logs to provide a shared governance layer for cataloging, lineage, classification, policy enforcement, quality monitoring, and audit reporting. The guide distinguishes standalone catalogs, point solutions, enterprise suites, platform-native tools, and open-source options while treating AI and agent governance as an increasingly important capability for models, prompts, and autonomous agents. It recommends evaluating candidates against seven criteria, comparing total cost of ownership, and planning a phased rollout that starts with highest-risk domains; a lakehouse-native approach can reduce synchronization between separate governance systems.
PostgreSQL 19 introduces the top-level SQL command WAIT FOR, addressing stale reads that can occur when an application writes to a primary and immediately reads from an asynchronously replicated standby. After the write, the client or pooler obtains an LSN with pg_current_wal_insert_lsn() and sends it to the reading session, where WAIT FOR blocks until the requested WAL position reaches the selected stage. The default standby_replay mode makes the change visible, while standby_write, standby_flush, primary_flush, TIMEOUT, and NO_THROW provide other durability and error-handling choices. The command waits without holding a snapshot, avoiding a replay self-deadlock, and exposes related wait events in pg_stat_activity. The feature preserves asynchronous writes by making only reads that require read-your-writes consistency wait, though timeline changes after promotion require caution.
Power-constrained AI factories measure efficiency by AI output per watt, because facility overhead, rack losses, and operational inefficiency reduce the power available to compute. In an illustrative 100 MW budget, 60% reaches AI load, while static rack provisioning can strand headroom that another rack could use. NVIDIA DSX MaxLPS addresses this with dynamic power allocation, workload-profile power optimization, and 45° C thermal and site design, including warm-water liquid cooling. Its Dynamic Power Software, currently in Developer Preview, models topology from utility to GPUs and reallocates unused capacity within policy-defined budgets, with optional DSX Exchange integration. For Vera Rubin NVL72, NVIDIA projects up to 40% more Rubin GPU capacity within the same power budget, while validation compares unmanaged and managed runs using throughput, latency, errors, power, utilization, and compliance.
The Postgres VM described here runs PgBouncer instances, a backup agent, metrics exporters, a local Prometheus, a log collector, and watchdog timers alongside the database. Those processes share machine-wide resources outside Postgres’s huge-page-backed shared_buffers, so leaks, CPU saturation, or disk exhaustion can threaten database availability. ClickHouse Managed Postgres places supporting services in a cgroup v2 slice and combines Go runtime GOMEMLIMIT targets with systemd memory.high and memory.max enforcement. GOMEMLIMIT encourages earlier garbage collection, memory.high applies reclaim and throttling, and memory.max provides a hard ceiling whose OOM scope excludes Postgres because it uses a separate cgroup. CPU weights, bounded buffers, log and metric controls, disk thresholds, and exemptions for replication and monitoring sessions extend isolation across other failure modes; these controls are enabled by default.
Airbnb's forecasting team outlines their framework for managing production models that experience drift or external shocks. Rather than treating model updates as a generic retraining task, they distinguish between refitting with new data, respecifying the underlying model structure, and intentionally holding without changes. This discipline prevents teams from chasing temporary noise, carrying obsolete crisis assumptions, or over-engineering solutions during disruptions.
Generic agents may select the first relevant-looking revenue table rather than the finance-maintained source because they lack business context. Genie Agents address this by using a single prompt to assemble a domain-specific agent from governed Unity Catalog context, including structured data, documents, and files. The prompt identifies the desired outcome and relevant sources, while the agent can retrieve content from PDFs, Word documents, presentations, images, and tables under the requesting user’s permissions. The recommended process is to begin with one focused, repetitive job, test it against known questions or incidents, and expand only after measuring performance. Built-in benchmarks provide accuracy scores, while monitoring surfaces user questions and feedback that can reveal gaps in the curated context.
Border Gateway Protocol route leaks occur when routing announcements propagate beyond their intended customer-provider or peer relationships, causing traffic misdirection and performance degradation. RFC 9234 embeds relationship awareness directly into BGP by establishing negotiated BGP Roles and attaching an Only to Customer (OTC) transitive path attribute to prevent unauthorized route propagation. To assess real-world adoption, Cloudflare monitored OTC attribute transmission across peer networks and discovered that 33.1 percent of IPv4 and 17 percent of IPv6 paths were missing the OTC attribute. Investigation revealed that Tier-1 transit providers AS1299 and AS3257 were stripping the attribute due to legacy defensive BGP error-handling configurations. Following direct engagement, AS1299 updated its configurations to preserve OTC propagation, whereas AS3257 continued stripping it, highlighting the necessity of broader vendor and carrier support across the Internet.
supabase-js now supports W3C Trace Context propagation so a client trace can share its trace_id with Supabase API Gateway and Edge Function logs. Previously, browser and server records had no shared identifier, making cross-boundary debugging depend on manually aligning timestamps. When tracePropagation is enabled, the SDK attaches traceparent, tracestate, and baggage to requests for Supabase domains; Supabase preserves the trace_id in generated logs, and W3C-compliant tracers such as OpenTelemetry, Sentry, Datadog, Honeycomb, or Grafana can continue the trace server-side. The setup requires a separately configured tracer, the tracing entry-point import, an active span, and a registered TracerProvider; propagation is sampling-aware by default, adds no OpenTelemetry code to the main bundle, and is available in supabase-js 2.112.0 or later, with CDN/UMD builds excluded.
MongoDB Atlas introduces OpenTelemetry Metrics Sink, a push-based stream that delivers high-fidelity Atlas metrics to OpenTelemetry-compatible platforms, enabling database telemetry to flow alongside application and infrastructure metrics. This closes the gap where database telemetry was often disconnected from application and infrastructure monitoring, forcing operators to jump between dashboards. The push-based delivery eliminates the complexity of pull-based collection, custom exporters, and polling infrastructure, reducing operational overhead and avoiding API rate limits. It supports configuration via the Atlas UI or Terraform, works with custom OTel endpoints, Dynatrace, and New Relic, and is available for dedicated M10+ clusters; a test metric is emitted on creation or update to verify it is working. Combined with Atlas Log Integration and upcoming Events Integration, teams gain unified visibility into database health alongside other signals, accelerating incident response and root cause analysis.
Scottish Water’s Capital Investment teams had project data, reports, and metrics available, but non-technical users often struggled to find answers, creating duplicated reporting and delays. SPARK addresses this access problem through a natural-language interface in Microsoft Teams: Copilot routes questions via a supervisor agent and MCP to the Databricks Genie Agent, which queries governed Unity Catalog data. The implementation curates use-case data in a gold layer, adds metric views as a semantic layer, and configures business rules, examples, benchmarking, feedback, and monitoring for accuracy and performance. Environment-parameterised Databricks Asset Bundles, separate environments, Azure DevOps approvals, Entra ID, and Key Vault support repeatable deployment. The post reports lookup journeys shrinking from around eight clicks or four to five search steps to a direct question, with an estimated 520 to 1,300 hours saved annually under a stated usage scenario.
On August 12, a total solar eclipse crossed the North Atlantic and Europe, passing directly over Iceland, northern Spain, and Portugal. Cloudflare Radar analyzed HTTP request volumes in five-minute intervals across affected countries, comparing the data against a baseline derived from the previous three Wednesdays. Traffic reductions aligned closely with peak solar obscuration, with totality regions recording drops between 15% and 30% and specific areas shifting by up to -46.7%. Once the sun reappeared, request volumes rebounded to normal levels within minutes as users resumed device activity. The observed traffic declines were driven by aggregate human behavior rather than network failures.
AI hallucinations are coherent, confident outputs that are factually wrong, fabricated, or unsupported, appearing in chatbots, image generators, and multimodal systems. Generative models predict likely continuations rather than retrieve guaranteed facts, while training incentives, limited or flawed data, generation settings, and error compounding in reasoning models can increase the risk. Examples include Google Bard’s incorrect JWST claim, Air Canada’s nonexistent bereavement policy, Microsoft Sydney’s erratic responses, and fabricated legal citations that led to sanctions. Hallucinations create enterprise risks involving safety, liability, compliance, security, reputation, and trust; recommended controls include guardrails, source verification, adversarial testing, monitoring, human review, retrieval-augmented generation, governed data, and evaluation throughout development and deployment.
Cursor announced that the Firetiger team is joining the company, bringing together coding agents with agents focused on software after it reaches production. Founded in 2024 by Rustam Lalkaka and Achille Roussel, Firetiger builds agents that monitor rollouts, catch regressions, investigate incidents, and pass findings back to coding agents. The stated motivation is to reduce operational toil and connect code generation with production feedback, so an agent can ship a change, observe its behavior, and respond when something goes wrong. Firetiger’s work is expected to appear across Cursor as the companies develop long-running, autonomous, context-aware agents for teams, alongside Cursor Origin and the forthcoming Change Monitors, which will watch deployed changes and flag problems as they appear.
Fin’s new Evals and Releases provide an evaluation and rollout system for testing changes before launch, controlling deployment, and assessing live conversations, alongside Monitors. Evals group multi-turn Simulations built from real conversations around a theme, then score them pass/fail using deterministic checks and an LLM judge against criteria such as required responses, Procedures, or data connector calls. Releases let teams edit content, Procedures, and Guidance away from live Fin, run Evals on proposed changes, collaborate, and publish to everyone, ramp traffic, A/B test, or roll back. Monitors evaluates every live conversation and can turn failures into new Simulations for subsequent testing. The combined workflow addresses probabilistic behavior, regression risk, and drift as support content and policies change, while Operator can draft changes, tests, and Releases for review and approval.
ClickHouse’s Grafana plugin has shipped a set of changes aimed at making common observability tasks—finding log lines, narrowing to services, and detecting deployments—faster without requiring SQL. Version 4.20 adds single-table configuration and compact query mode, where users search logs, apply type-aware filters, review query history, and see or edit generated ClickHouse SQL. Investigation can proceed by clicking through collapsible OpenTelemetry Resource, Scope, and Log attributes, filtering values or selected message text, while dashboards can discover Map keys and values across tables. The release also includes interactive Logs Explorer, Traces Explorer, and per-service OpenTelemetry dashboards, plus guided variable and annotation editors that generate editable SQL for distinct values and change markers such as deployments and rollbacks. Additional changes cover schema-introspection caching, trace-ID lookup, Grafana 13 compatibility, SQL validation, backend OpenTelemetry instrumentation, and forwarding Grafana identity to ClickHouse; compact mode initially remains limited to single-table data sources.
Cloudflare announced the general availability of Certificate Transparency Monitoring alongside a filtering mechanism to eliminate noisy alert emails. Previously, the monitoring system alerted domain owners for all Certificate Transparency log entries, including routine, automated renewals for Universal SSL, Advanced Certificate Manager, and backup certificates. Because the alerting flow and certificate ordering service operated independently, existing identifiers like TBSCertificate hashes arrived too late to verify pre-certificates. To resolve this race condition, the ordering service now computes an SHA-256 hash of the DER-encoded SubjectPublicKeyInfo structure at key generation. When the alerting service discovers a log entry, it recomputes this hash to verify ownership against the ordering database, suppressing alerts for Cloudflare-managed certificates while preserving alerts for external or unexpected issuances.
ClickHouse and Hud announce an integration that combines ClickStack’s service-level observability with Hud’s function-level runtime forensics for AI-assisted software development. As coding agents generate more code, the post identifies the central challenge as assessing production risk, detecting regressions, and giving engineers enough context to fix them. Teams connect the ClickStack and Hud MCP servers to a single coding agent, while shared trace IDs correlate OpenTelemetry traces and logs with Hud’s function-level metrics and forensic data; Hud’s Runtime Code Sensor requires no manual instrumentation and runs with low overhead in production. The resulting workflows support pre-deployment risk assessment against production behavior, release monitoring, auto-triage and auto-fix, and rollback or code-level remediation when issues arise.
Evaluating Sentry's AI agent Seer previously required manually querying evaluation data and parsing raw JSON traces to find tool failures, latency spikes, and hallucinations. To automate this triage, the team deployed a daily Claude Routine connected to Sentry using a Model Context Protocol server. Each morning, the routine analyzes hundreds of overnight agent conversations, reviews aggregate error metrics, samples failed and successful conversation spans, and inspects the agent codebase for context. Claude evaluates whether final decisions match underlying reasoning and creates Linear tickets for newly discovered issues. This daily automated analysis accelerated the feedback loop, allowing engineers to identify efficiency issues like repeated malformed repository queries and deploy same-day fixes.
Adobe Firefly powers generative creative features using a large-scale GPU training infrastructure hosted on Amazon Elastic Kubernetes Service. As workloads scaled to thousands of nodes and GPUs, Adobe's self-managed Prometheus setup struggled with query latency across high-cardinality telemetry data. To resolve these performance bottlenecks, the team moved two million critical time series metrics to Amazon Managed Service for Prometheus while using managed scrapers alongside their existing infrastructure. This setup accelerated query response times by more than 28x over 24-hour windows, reducing query execution times to approximately ten seconds. Additionally, the migration expanded practical monitoring windows from six hours to 24 hours, giving teams reliable visibility across long-running distributed training jobs.
AI infrastructure spans compute, networking, storage, orchestration, and applications, so a symptom at one layer may originate elsewhere. The post proposes selecting observability tools by failure domain, mapping components to telemetry sources, and reducing signals to a top-k alert set in a unified Prometheus/Grafana triage dashboard. For a DGX cluster using InfiniBand, BCM, and Slurm, it recommends Redfish/IPMI, DCGM, NVSM, UFM, and BCM, while deferring NetQ, NMX, Run:ai, and NIM until their corresponding capabilities are needed. The framework emphasizes DCGM for GPU metrics, NVSM for DGX system health, UFM for InfiniBand, and BCM for cluster and job aggregation, with specialized tools retaining low-level telemetry. An elevated InfiniBand bit error rate illustrates how retransmissions can slow one rank during NCCL all-reduce, causing synchronized training throughput to follow the slowest rank; alerts should connect concise signals to owners and remediation actions.
The best engineering reads, once a week.