Anomaly Detection: From Baseline to Action
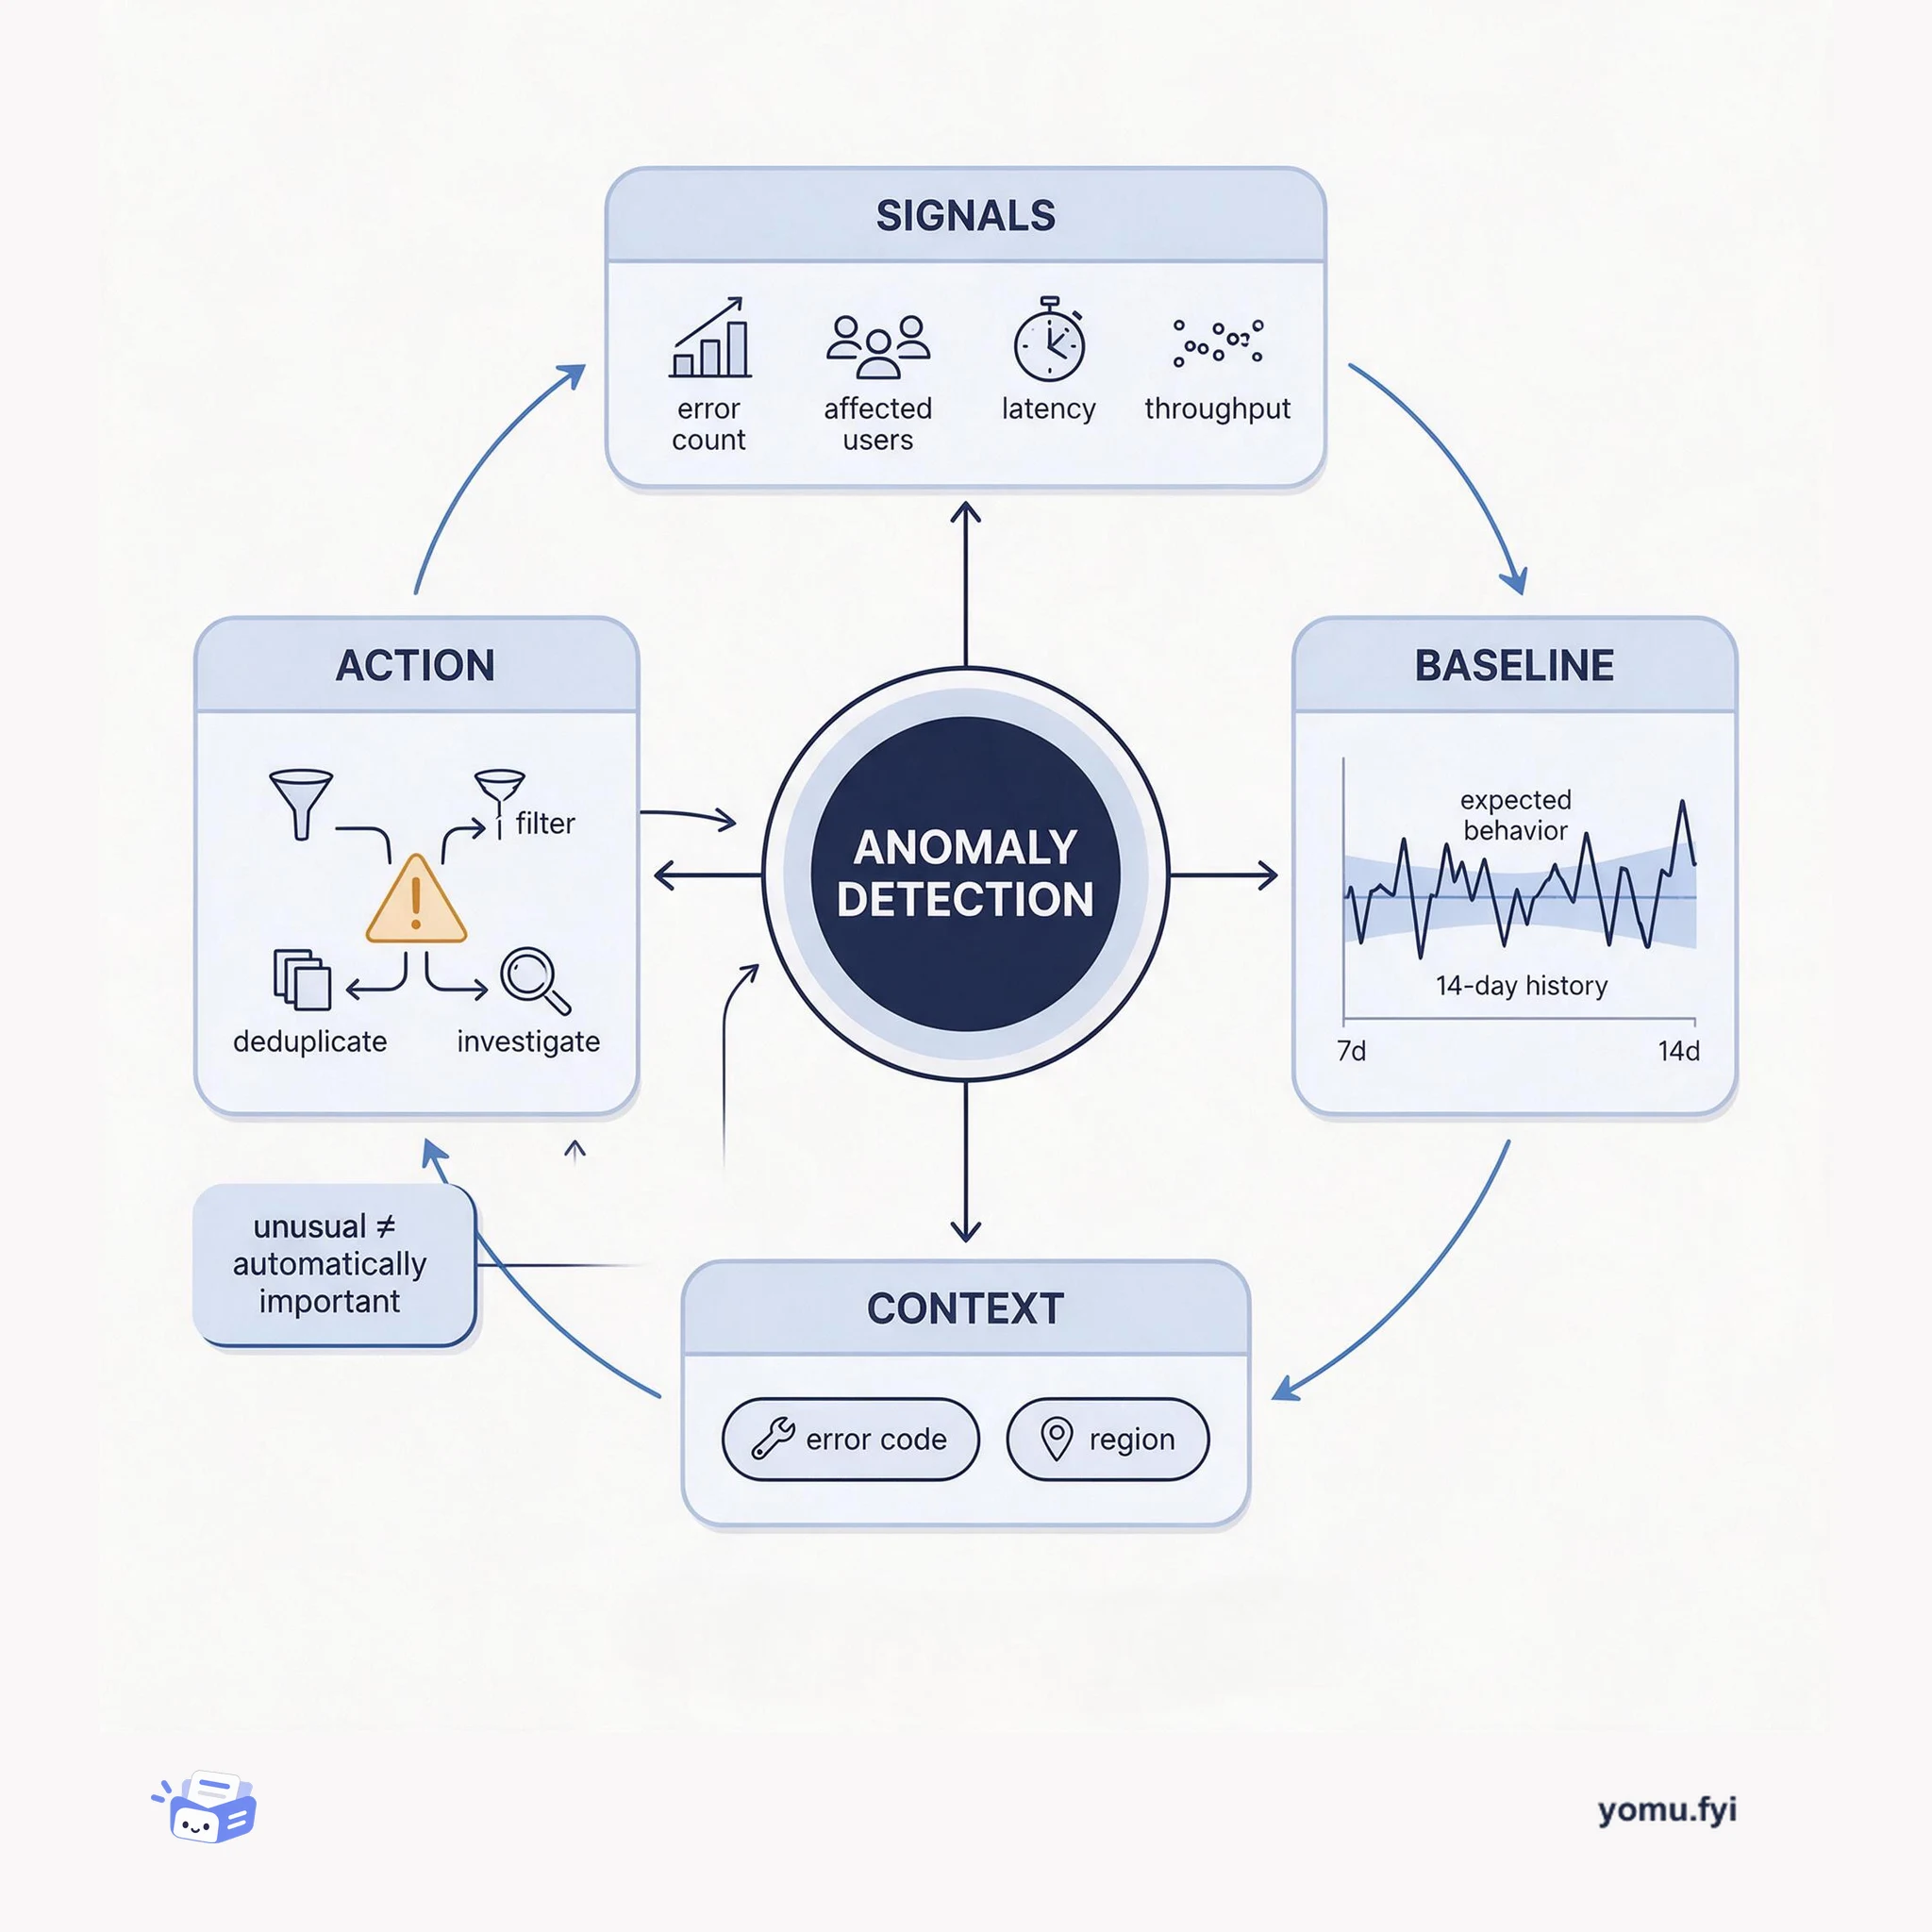
Anomaly detection identifies meaningful departures from expected behavior. This explainer shows how signals, baselines, context, and alert routing turn unusual measurements into engineer-ready findings.
Loading…
Topic
196 posts about Monitoring. Every summary links to the original.
See the idea
Anomaly detection identifies meaningful departures from expected behavior. This explainer shows how signals, baselines, context, and alert routing turn unusual measurements into engineer-ready findings.
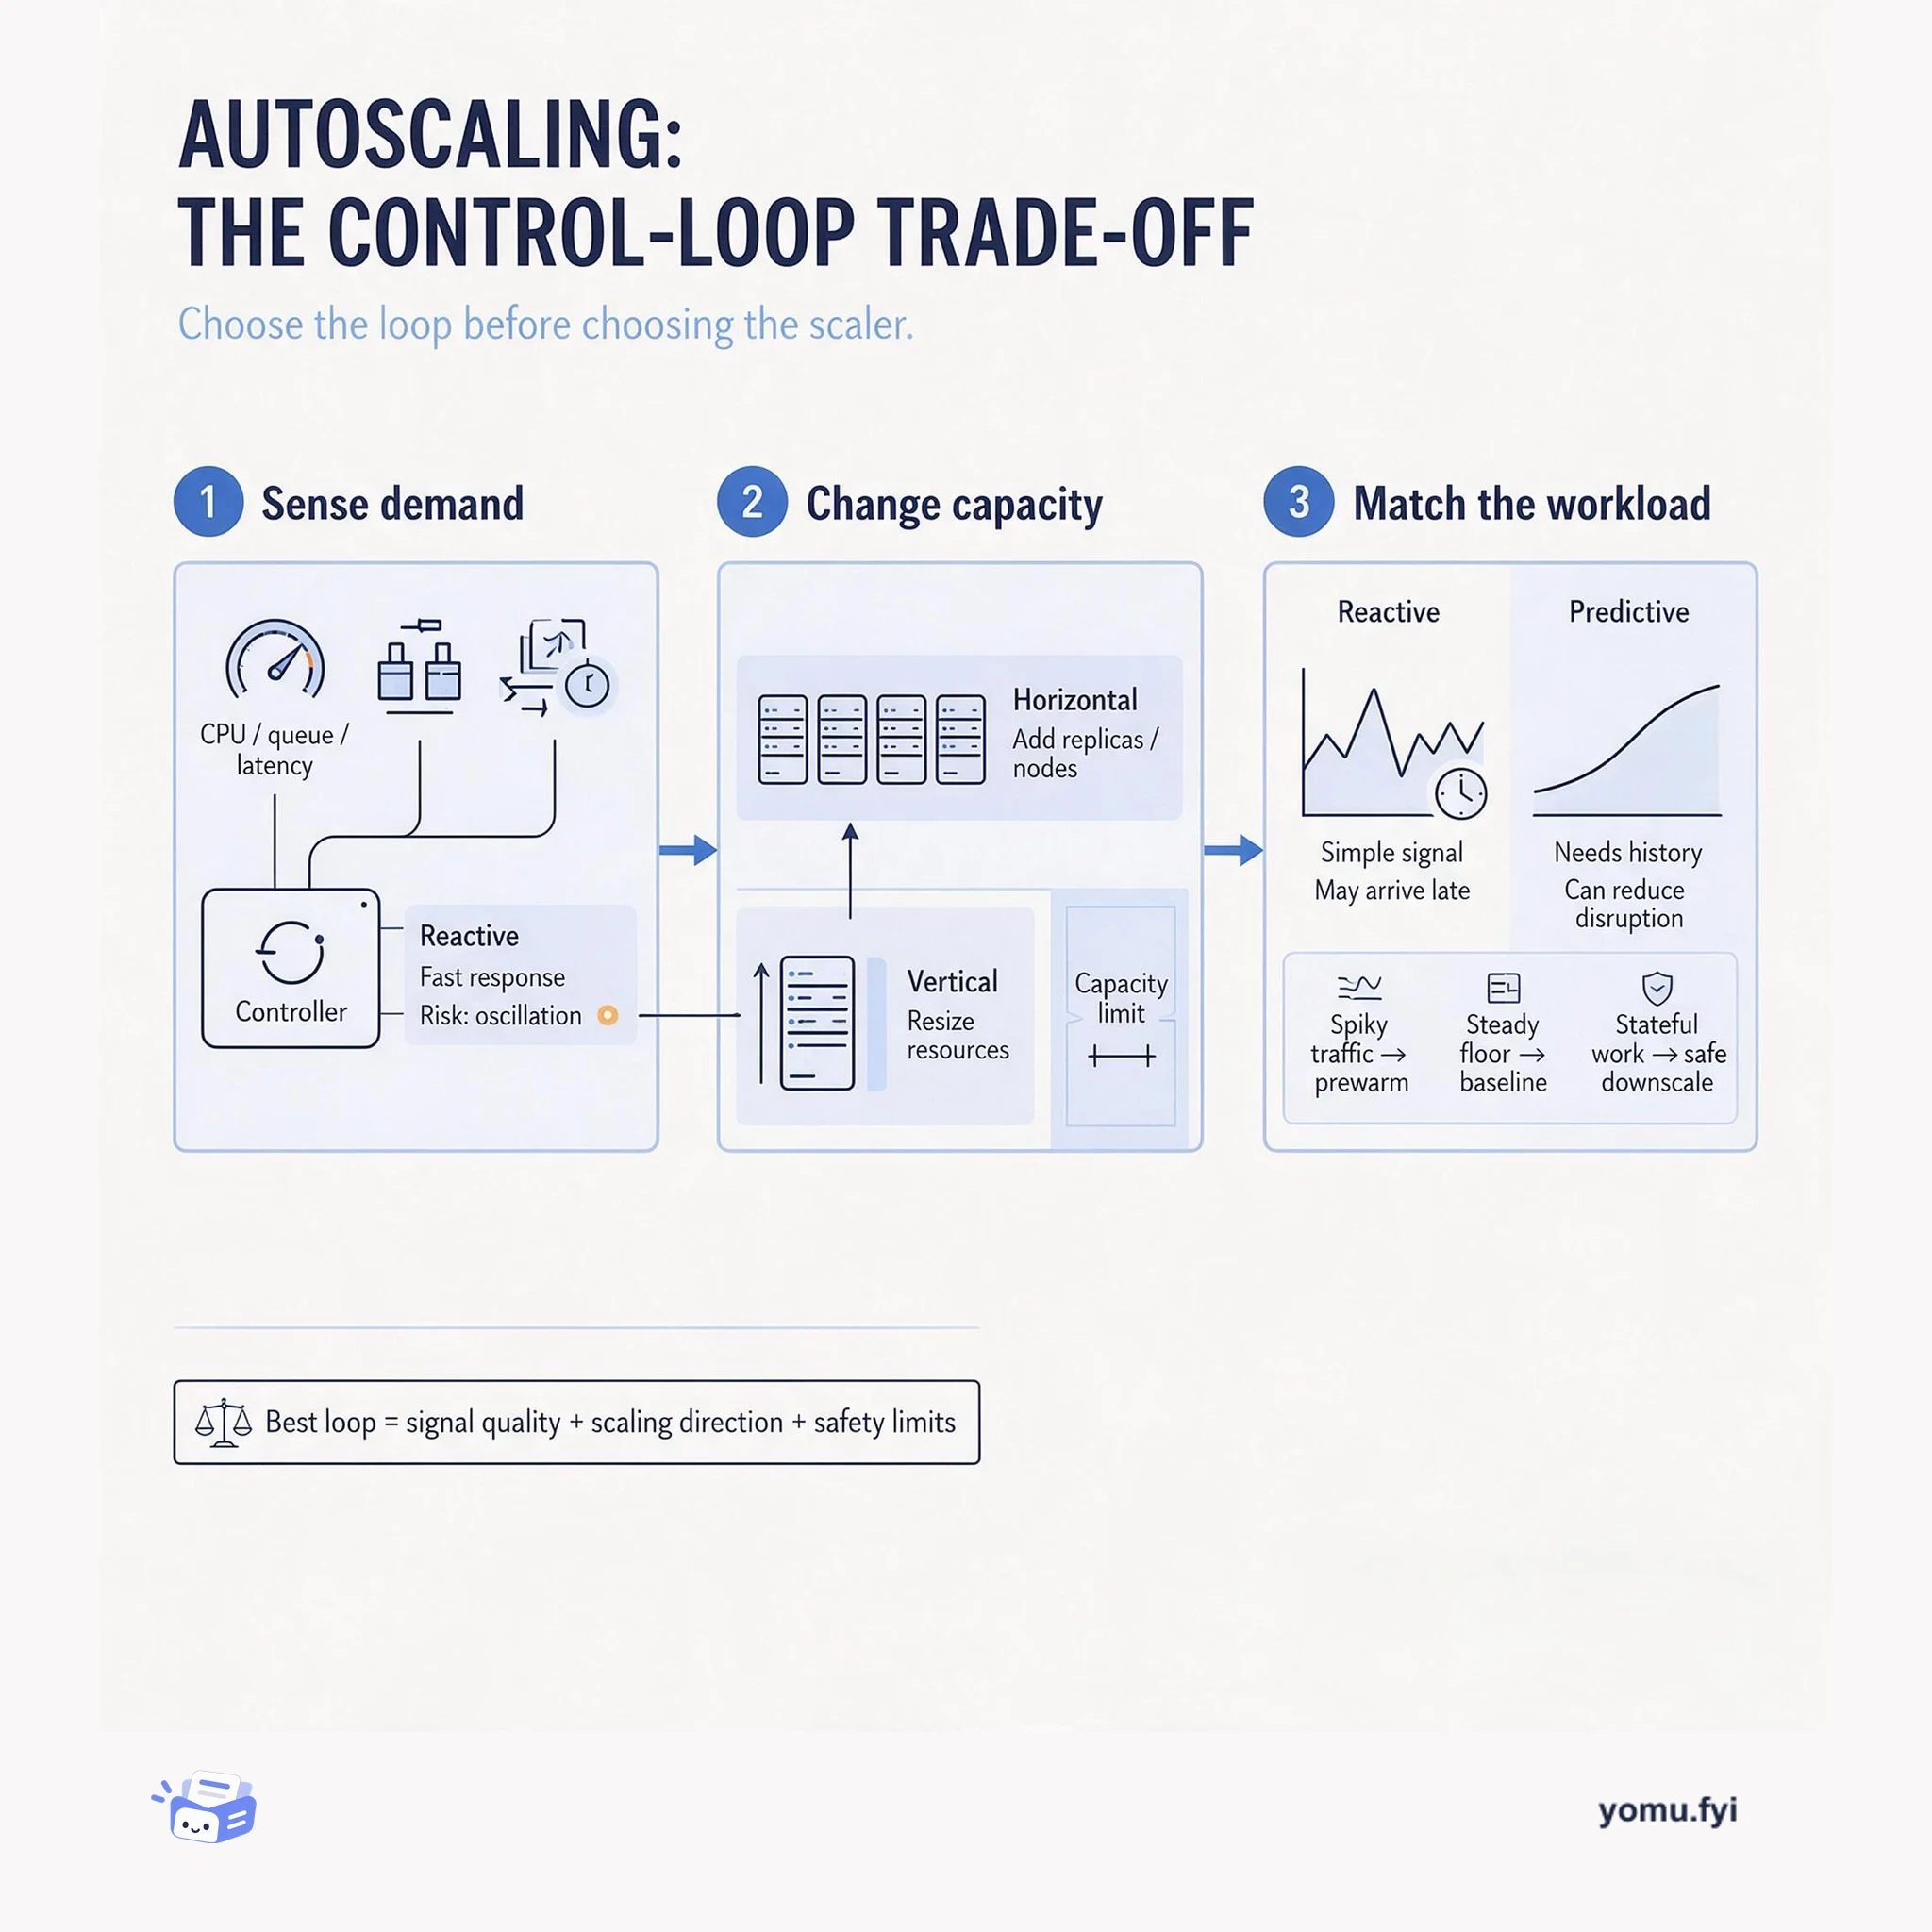
Autoscaling trades responsiveness, stability, and cost: this explainer shows how signal choice, scaling direction, and capacity limits shape the right control loop for a workload.
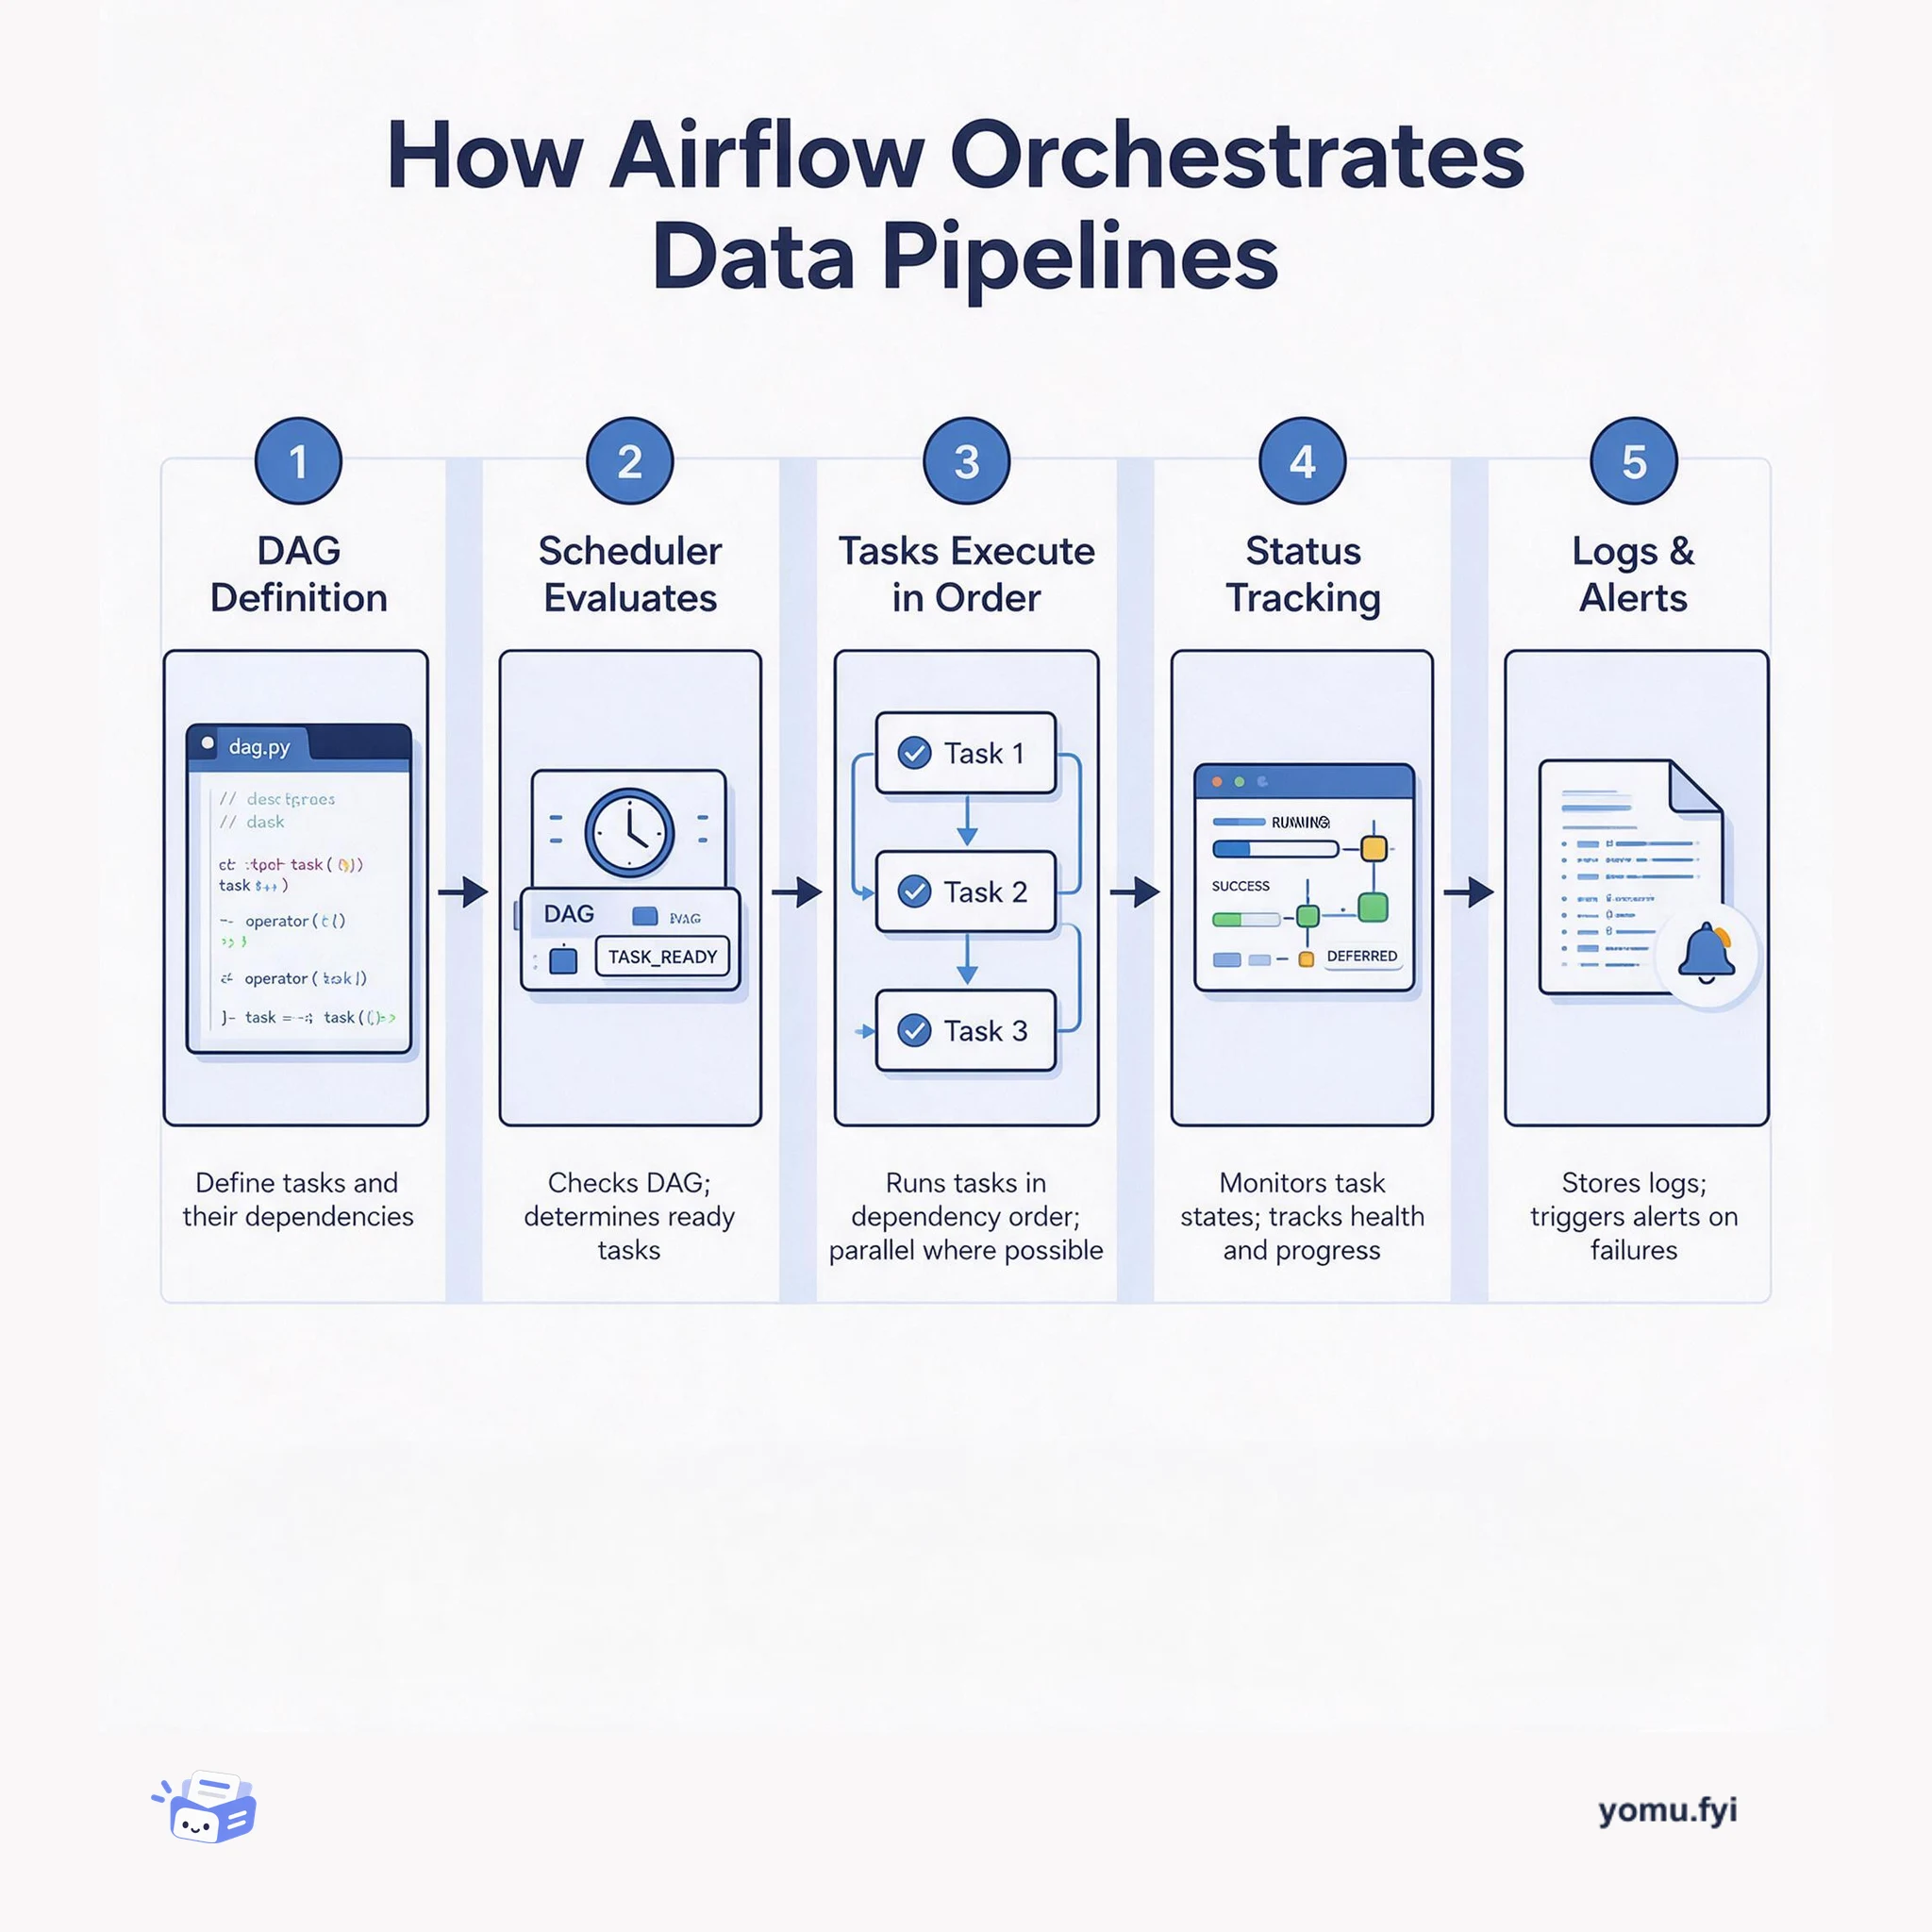
Airflow is a workflow orchestration platform that schedules, monitors, and manages data pipelines by defining tasks as code, executing them in dependency order, and tracking their success or failure.
The Good Stuff
Paid picks we use ourselves. Links carry a referral code — a subscription through one earns us a commission at no extra cost to you.
Newest first
Stripe events notify account owners about changes such as successful charges, failed invoice payments, and available reconciliation reports. Because Stripe retains events for 13 months but exposes older events than 30 days only as summaries, Amazon EventBridge can route them into an AWS account and Amazon CloudWatch Log Groups can provide longer-term monitoring and analysis. The setup uses CloudWatch metric filters to match event types such as invoice.payment_failed, convert matches into custom metrics, and support alarms, Amazon SNS notifications, dashboards, and Logs Insights queries. For example, a failed-invoice alarm can use a five-minute observation period, Sum statistics, and a threshold based on expected failure volume or anomaly detection. The resulting setup supports near-real-time visibility into successful charges and failed payments, historical trend analysis, troubleshooting, and responses to unusual activity.
The guide explains how developers can use Stripe for UAE-based e-commerce businesses, following its public debut in the country in April 2021. It covers Stripe Billing for recurring billing, Stripe Connect for marketplaces, Stripe Radar's machine-learning fraud protection, and the platform's support for Apple Pay, Google Pay, and more than 135 currencies including AED, BHD, and KWD. Account setup requires business details, KYC documentation based on entity type, and a linked bank account, with sole proprietors and free zone establishments allowed to use personal accounts under the stated conditions. The Dashboard supports payout and transaction tracking, customer and product management, real-time updates, data exports, tax configuration, and Payment Links, while UAE payouts are described as arriving in AED or USD on a T+5 business-day schedule.
Stripe integrations can appear healthy while API and webhook failures accumulate unnoticed when applications lack robust logging and alerting. The post demonstrates Stripe Workbench, a Dashboard view that stores available information by default, obfuscates sensitive data, and provides searchable logs without code changes or additional software. In the example, about 50% of daily API calls fail; the Errors tab groups failures and connects each type to sample requests and related logs, revealing repeated card-verification errors and a request associated with an “Attacker Engineering Test Key” whose Go user-agent conflicted with the stated .NET backend. The investigation identifies a team testing attack-like API calls in production and recommends stopping production-key testing, avoiding test requests in production, and using Sandboxes.
Stripe Workbench provides browser-based tools for investigating EMV 3DS authentication and related payment flow behavior in the Stripe dashboard. It lets developers inspect Payment Intent and Charge data, including payment_method_details.card.three_d_secure.authentication_flow and result, to determine whether authentication used a challenge UI and whether it completed successfully. The Inspector also exposes API history and webhook events, while the Events tab can filter historical payment_intent.requires_action events and show their frequency over a selected period. In the Shell tab, stripe trigger payment_intent.requires_action simulates a 3DS-related flow and generates event data without installing additional tools, allowing webhook handling to be tested and investigated from the dashboard.
Stripe subscriptions require testing scenarios that unfold across billing cycles, and the post presents Test Clocks and Workbench as no-additional-cost test-mode tools for doing so without waiting real time. It provisions three monthly recurring product tiers, creates a test clock with a Unix Epoch FrozenTime, and attaches newly created customers and subscriptions to that clock using the Stripe .NET SDK. Advancing the clock by one month updates time-dependent objects, allowing Workbench Inspector logs and events such as invoice.created and customer.subscription.updated to be examined alongside payment and subscription state. A second simulation attaches pm_card_chargeCustomerFail, makes it the default payment method, and advances to the next billing period. The resulting failed invoice, canceled subscription, and customer.subscription.deleted cancellation_details show how these tools reveal the events and properties an integration should test.
The post presents advanced error-handling patterns for Stripe integrations that face high request volumes, temporary API slowdowns, connectivity problems, and webhook delivery failures. It uses Stripe Workbench to inspect account-level API activity, traffic spikes, error rates, API versions, and webhook activity; one example links a 429 response to a scheduled job that created usage records across thousands of accounts simultaneously. The implementation combines request spacing with Limiter, a p-queue concurrency cap of five, and a token bucket configured for 100 tokens per 60 seconds. Stripe’s stated limits are 100 read and 100 write operations per second in live mode and 25 of each in test mode, with stricter limits for some resources. The reported before-and-after results show the combined controls processing high API-call volume within those limits, reducing errors and producing more predictable interaction.
Stripe Workbench addresses the difficulty of finding and understanding errors produced by Stripe API invocations. It gives developers a view of recent errors, groups repeated failures, shows their frequency, and links summaries to request logs and actionable resolution guidance. The article describes Stripe error categories such as StripeCardError, StripeInvalidRequestError, and StripeConnectionError, then demonstrates Node.js try/catch handling that branches on the error type. It also covers webhook responses for payment_intent.payment_failed events, including retrieving event.data.object.last_payment_error, and explains how objects such as PaymentIntents, Setup Intents, Invoices, Setup Attempts, Payouts, and Refunds retain failure information for later inspection. Combined, these mechanisms support targeted responses, troubleshooting through detailed request and response data, and more reliable Stripe integrations.
Stripe’s August 2024 developer update announces that Workbench is available to everyone across every Dashboard surface, addressing developers’ request for in-context guidance and debugging tools during API integration work. Workbench is a developer home in the Dashboard that provides an at-a-glance view of integration behavior, lets users inspect API and event history, prototype integrations, and receive critical account alerts. As developers build, it highlights errors, helps resolve them, and recommends ways to improve integration efficiency; it can be opened with a single keystroke. The update also places Sandboxes and Event Destinations in public beta, expands Tap to Pay on iPhone with Stripe to seven countries, and notes community resources for Stripe Tax, the Stripe CLI, Payment Links, and related integrations.
Grab's in-house risk management platform, GrabDefence, relies on ingesting large volumes of upstream data to drive real-time heuristic rules and data science models. To prevent data discrepancies and missing information from degrading fraud detection, the team implemented a real-time data observability pipeline. The solution uses Apache Flink SQL alongside custom table functions like JSONEXPLOAD to flatten nested JSON structures and aggregate metrics over 5-minute tumbling windows. Processed metrics are sent to Datadog, where counters are grouped by source stream and evaluated using anomaly detection algorithms. Alerts are routed directly to Slack, reducing anomaly detection latency from days or weeks down to within the same day or hour.
Standard infrastructure monitoring tools track CPU and memory usage at the host or container level, obscuring the precise resource consumption of individual Spark jobs on shared instances. To achieve granular observability, the Iris platform gathers job metrics directly at the Java Virtual Machine level without requiring changes to user application code. Data collection relies on Uber's JVM Profiler for deep JVM, thread, and memory pool diagnostics alongside sparkMeasure for stage and task execution statistics. Collected metrics route asynchronously through an Apache Kafka queue to avoid execution bottlenecks, feeding a Telegraf, InfluxDB, and Grafana stack for real-time monitoring while archiving to a data lake for offline analytics. This multi-tiered telemetry enables engineering teams to identify over- or under-provisioned jobs and optimize ETL resource allocations.
Shopify’s mobile app saw performance decline during its React Native migration, prompting a year-long effort to make critical screens load under 500ms at P75 and launch within 2s at P75. The team built real-time dashboards to filter results by device and operating system, then targeted excessive initial rendering, unnecessary background updates, launch overhead, and weak cache utilization. They introduced LazyScrollView and ListSource on FlashList, deferred work outside the viewport, enabled inlineRequires, optimized a native module, batched state updates, froze background components, and improved Restyle. They also fixed a graph QL cache issue and pre-warmed critical screen data, increasing cache-first delivery to as much as 90% for key screens. By year-end, app launch P75 was 44% faster and screen-load P75 times were reduced by 59%, with performance treated as an ongoing process requiring monitoring and repeated optimization.
Grab launched Project Bonsai to optimize the size of its Android superapp, which encompassed over four million lines of code across 1,500 modules. Because large app sizes negatively impact user acquisition on low-end devices with constrained bandwidth, the engineering team structured its optimization strategy around measurement, reduction, and containment. The team developed App Sizer, a custom CI-integrated tool that tracks binary compositions and module size contributions in Grafana. Initial reductions targeted Java and Kotlin dex files, resolving bloated transitive R classes by upgrading the Android Gradle Plugin to eliminate overly broad R8 retention rules. These initiatives achieved a 26% reduction in app download size while simultaneously decreasing overall disk footprint.
Fly.io announces Sentry as the default error-monitoring tool for its applications, with new deployments receiving an automatically provisioned Sentry project and existing apps using flyctl ext sentry create. Each organization receives one year of monthly Team Plan credits covering 50,000 error events, 100,000 performance units, 500 session replays, and 1GB of attachment storage. For Rails apps, flyctl launch installs the required gems, creates initializers, and sets the SENTRY_DSN secret, allowing boot failures, memory exhaustion, exceptions, latency issues, and crashes to reach Sentry. The post demonstrates a deliberately raised Ruby exception, then uses flyctl apps errors to open the Sentry issue dashboard and identify the bug; planned extensions include release tracking and out-of-memory events.
An engineer recounts lessons from taking Ramp’s Bill Pay from its first code in April 2021 to a publicly launched product that eventually became a product with multibillion annual total payment volume. For 0-to-1 work, the account emphasizes protecting core abstractions, including canonicalized payment statuses that reduce varied payment states to five, using mocked functions to coordinate parallel engineering, and reaching beta customers quickly. Customer feedback, session replay, and persistent iteration are presented as necessary because the first customer will usually expose substantial flaws. For 1-to-N growth, manual processes and duct tape must be prioritized for replacement according to user impact, error risk, and workload. Growing stakes also require testing, monitoring, contingency plans, gradual rollouts, QA, and documentation that helps engineers self-service onboarding.
Supabase’s June 2023 beta update announces product, tooling, authentication, billing, and community developments. Mozilla chose Supabase Vector and OpenAI for AI Help, an AI chatbot that supports search and discovery for MDN, while Supabase Auth added native Sign in with Apple and Google support for one-tap methods including web integrations and Chrome extensions. The Supabase CLI added Dashboard migration visibility with executed SQL, local serving for all Functions, and a usage flag for monitoring key Postgres statistics; Studio also gained usage, overage, plan-limit, subscription, billing, and compute-detail improvements. Other updates include Kakao login, a Realtime Inspector for testing endpoints with JWTs and Row Level Security policies, an object ID in Storage upload responses, OrioleDB parallel index builds, database partitioning guidance, community projects, and an upcoming Launch Week.
Shopify investigated high Ruby garbage-collection latency in its monolith, where minor marks took about 3 ms but major marks could exceed four seconds and some requests spent multiple seconds in GC. Logging showed that roughly 75% of major marks were triggered by oldmalloc and nearly 25% by shady, while nofree became dominant after oldmalloc was addressed. The team used production experiments, improved metrics, changed GC environment settings, increased initial heap slots, and added out-of-band collection during request processing. A 128 GB oldmalloc threshold reduced major marking by about 20%; later out-of-band collection cut the P99.99 and P99.9 GC-time tail by almost tenfold and largely eliminated median-request pauses. The resulting configuration, with collection frequency adapting from every 128 to every 512 requests, was deployed across the fleet after about three weeks.
Supabase announced the winners of its sixth hackathon, held during Launch Week 6 after ending 2022 with many feature releases. Projects were judged across categories including Best Overall, Most Fun/Interesting, Best Flutter, Best Storage, and Best Edge Functions, with Deno participating in judging the edge category. Depulso, a CLI and web app for static site deployments with per-deployment .depulso.site subdomains and SSL, won Best Overall, while Supa SQL App was runner-up for converting human language into SQL queries. Other winners included HTTP Sense, a reverse proxy and network monitoring tool; supaquiz, a realtime multiplayer trivia game; Lookout, a metadata-based image discovery app; and Vista, a video transcoder that adds customizable subtitles from audio. Winners received keyboards or swag, and a Discord event was scheduled for January 5 at 7:00 AM PST.
Datadog dashboards can constrain metric analysis because they offer a limited set of visualizations and lack tooling for complex work such as statistical modeling. They also aggregate data over wider time ranges: the examples contrast one-second metrics across 15 minutes with two-hour intervals across 30 days, potentially hiding interesting events. The guide uses Datadog’s REST API and Python in Jupyter notebooks, requiring an API key, an APP key, and a metric query such as CPU utilization over time. It defines a time range, splits it into buckets whose width is controlled by time_delta, requests each window in a loop, appends the results, and converts them into a dataframe. The resulting data can be examined with tools such as seaborn; a KDE plot is used to inspect the distribution of system CPU utilization, with the exported data offering greater granularity than the dashboard example.
Shopify needed a reliable way to measure React Native rendering times and verify that mobile apps remained as fast as native while adopting React Native. The open-source @shopify/react-native-performance library measures app startup, navigation, and screen re-render times by timing from native startup, a user action, or a UI event until a screen is fully rendered and interactive. It uses an invisible marker view with a native counterpart to capture end-to-end timing, including React Native-to-native bridge communication, and models incremental rendering as interactive or non-interactive render passes in a state machine. Reports can be sent through onReportPrepared to analytics tools such as Amplitude, where percentile TTI dashboards compare screens over time, expose bottlenecks, and help catch regressions; Shopify also uses screen-level Apdex internally.
Dedicated vehicular inertial measurement units are prohibitively expensive to install across large fleets, while customer feedback lacks the coverage required to assess driving safety comprehensively. To monitor driver behavior at scale, Grab processes smartphone sensor data collected via a mobile telematics SDK at high sampling frequencies. A custom orientation algorithm calculates Euler roll and pitch angles from gravity and resolves yaw through principal component analysis to align phone measurements with vehicle axes. The pipeline applies low-pass or Kalman filtering to handle varying noise levels, followed by threshold peak-finding algorithms to detect harsh acceleration, braking, and cornering. Speeding events are identified by comparing GPS speeds against known map limits or aggregated speed profiles derived from free-flowing traffic.
The best engineering reads, once a week.