Anomaly Detection: From Baseline to Action
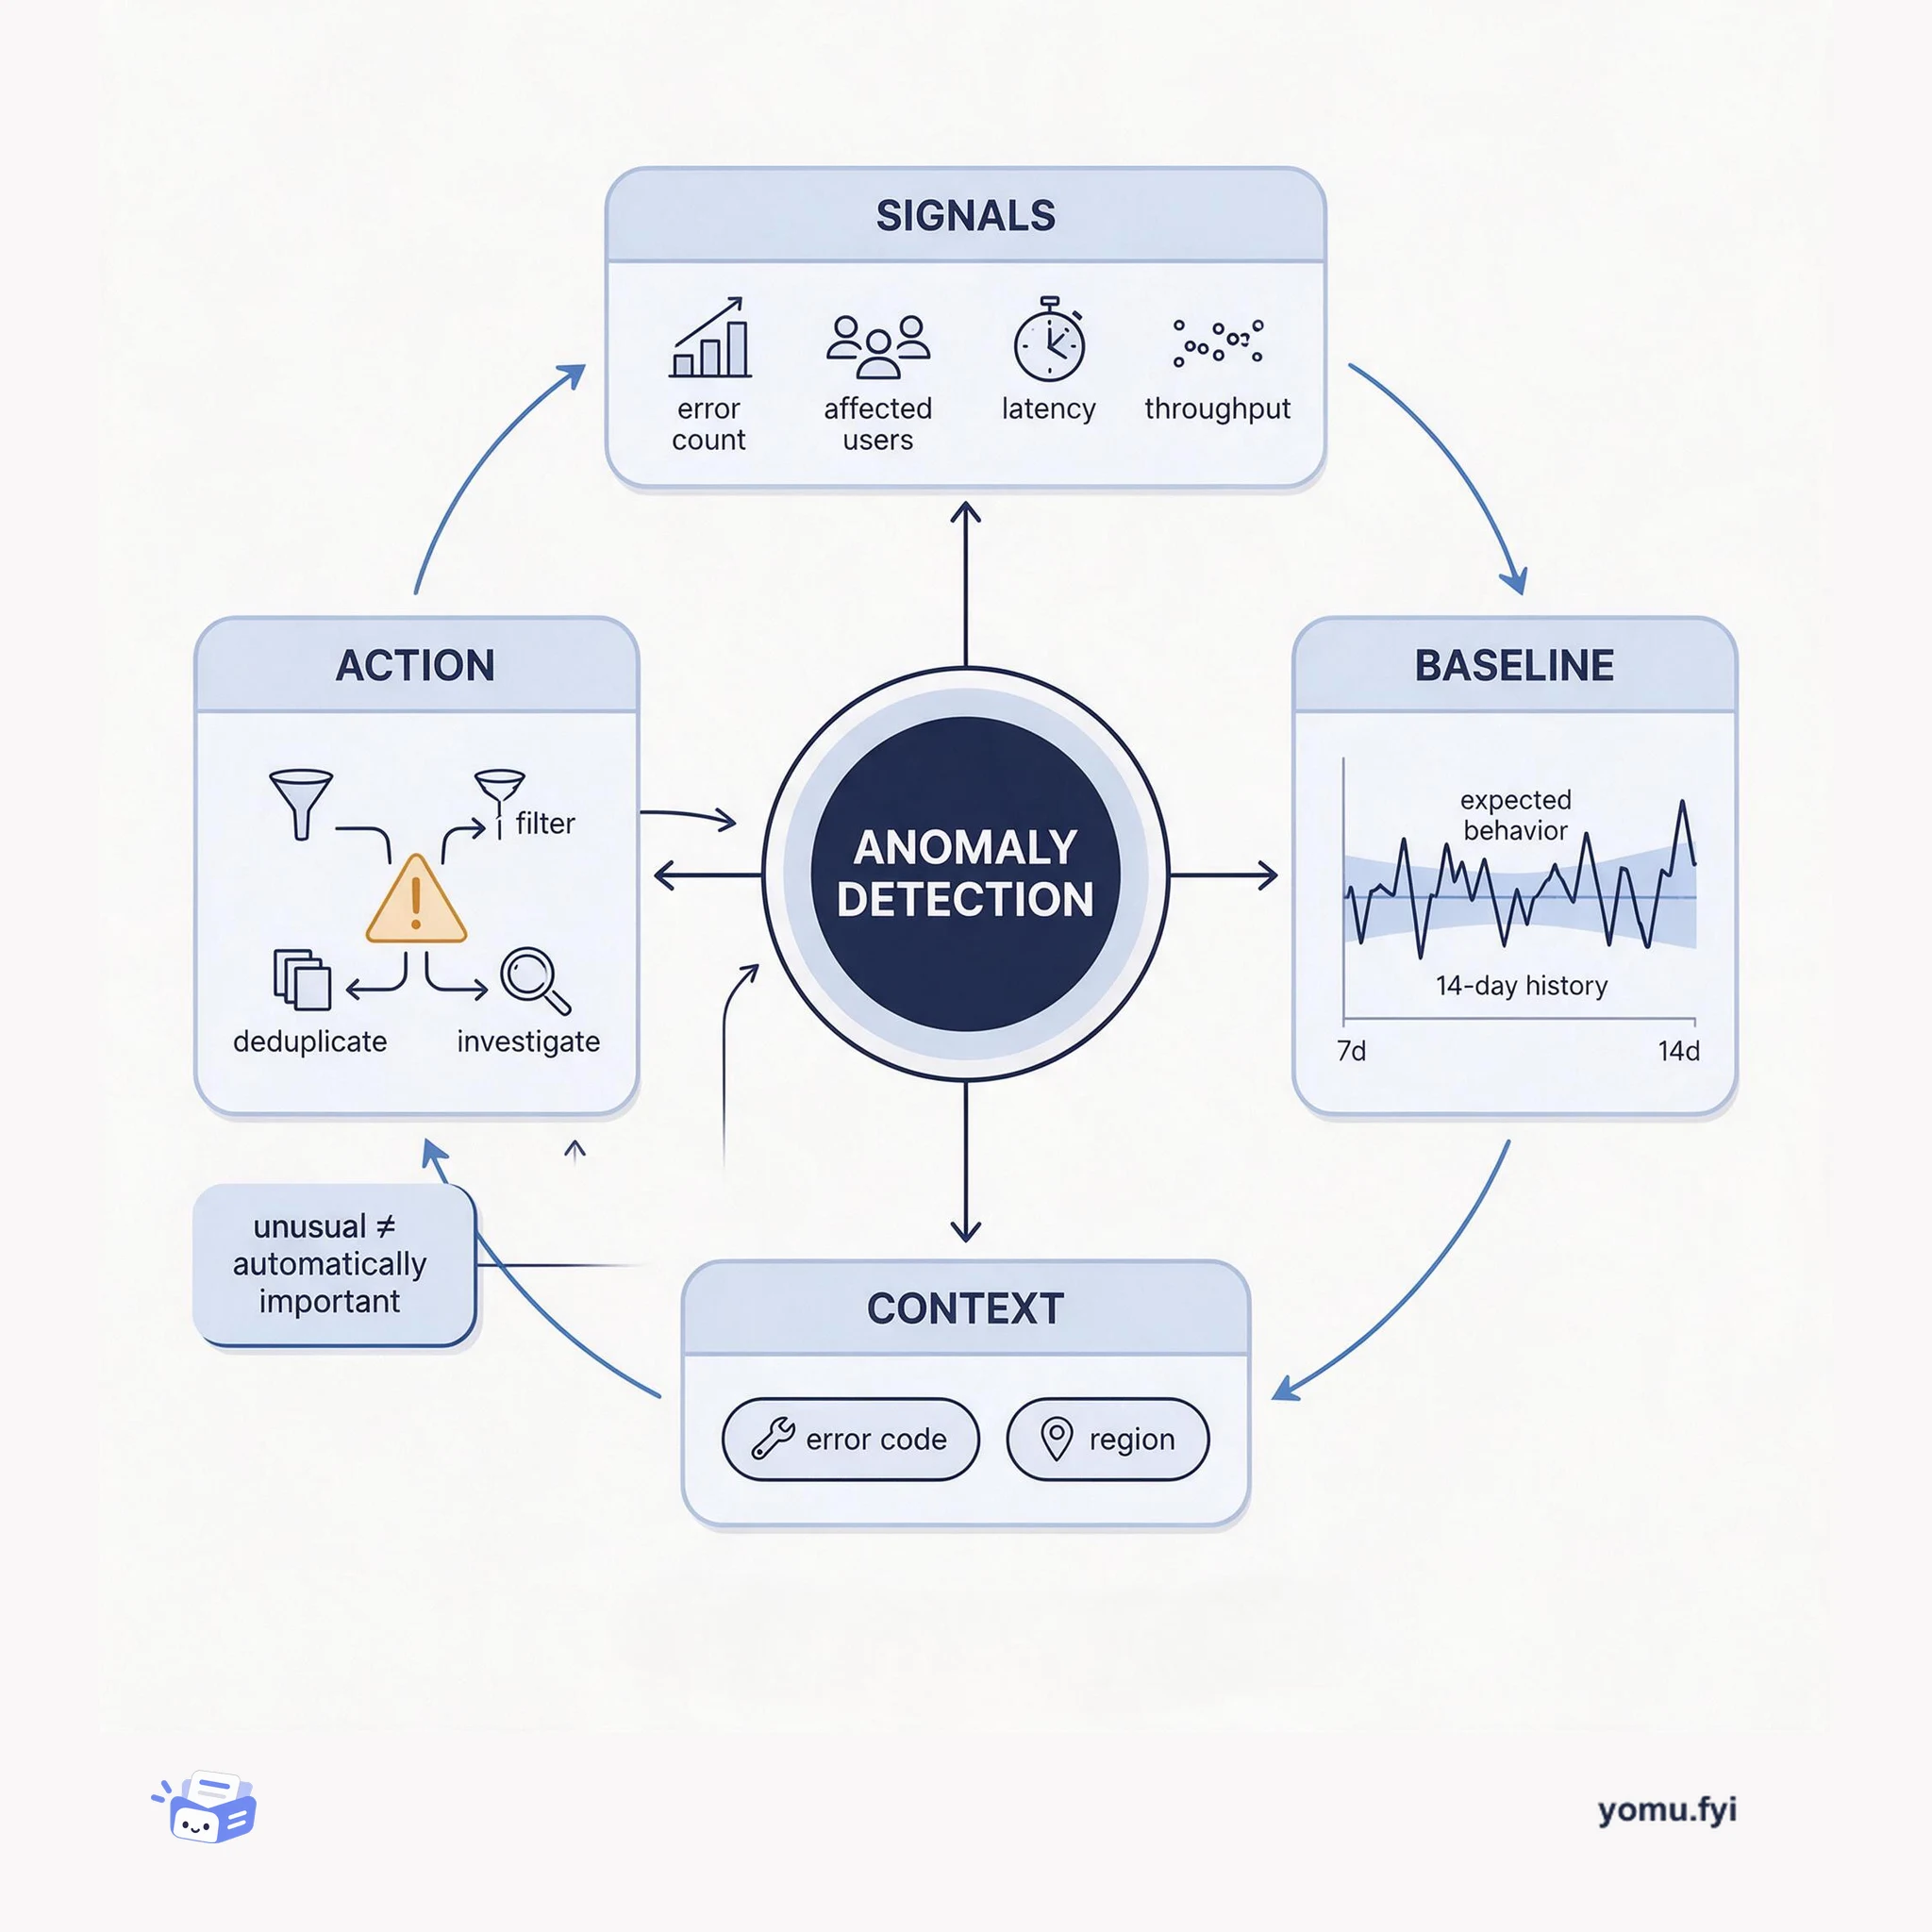
Anomaly detection identifies meaningful departures from expected behavior. This explainer shows how signals, baselines, context, and alert routing turn unusual measurements into engineer-ready findings.
Loading…
Topic
196 posts about Monitoring. Every summary links to the original.
See the idea
Anomaly detection identifies meaningful departures from expected behavior. This explainer shows how signals, baselines, context, and alert routing turn unusual measurements into engineer-ready findings.
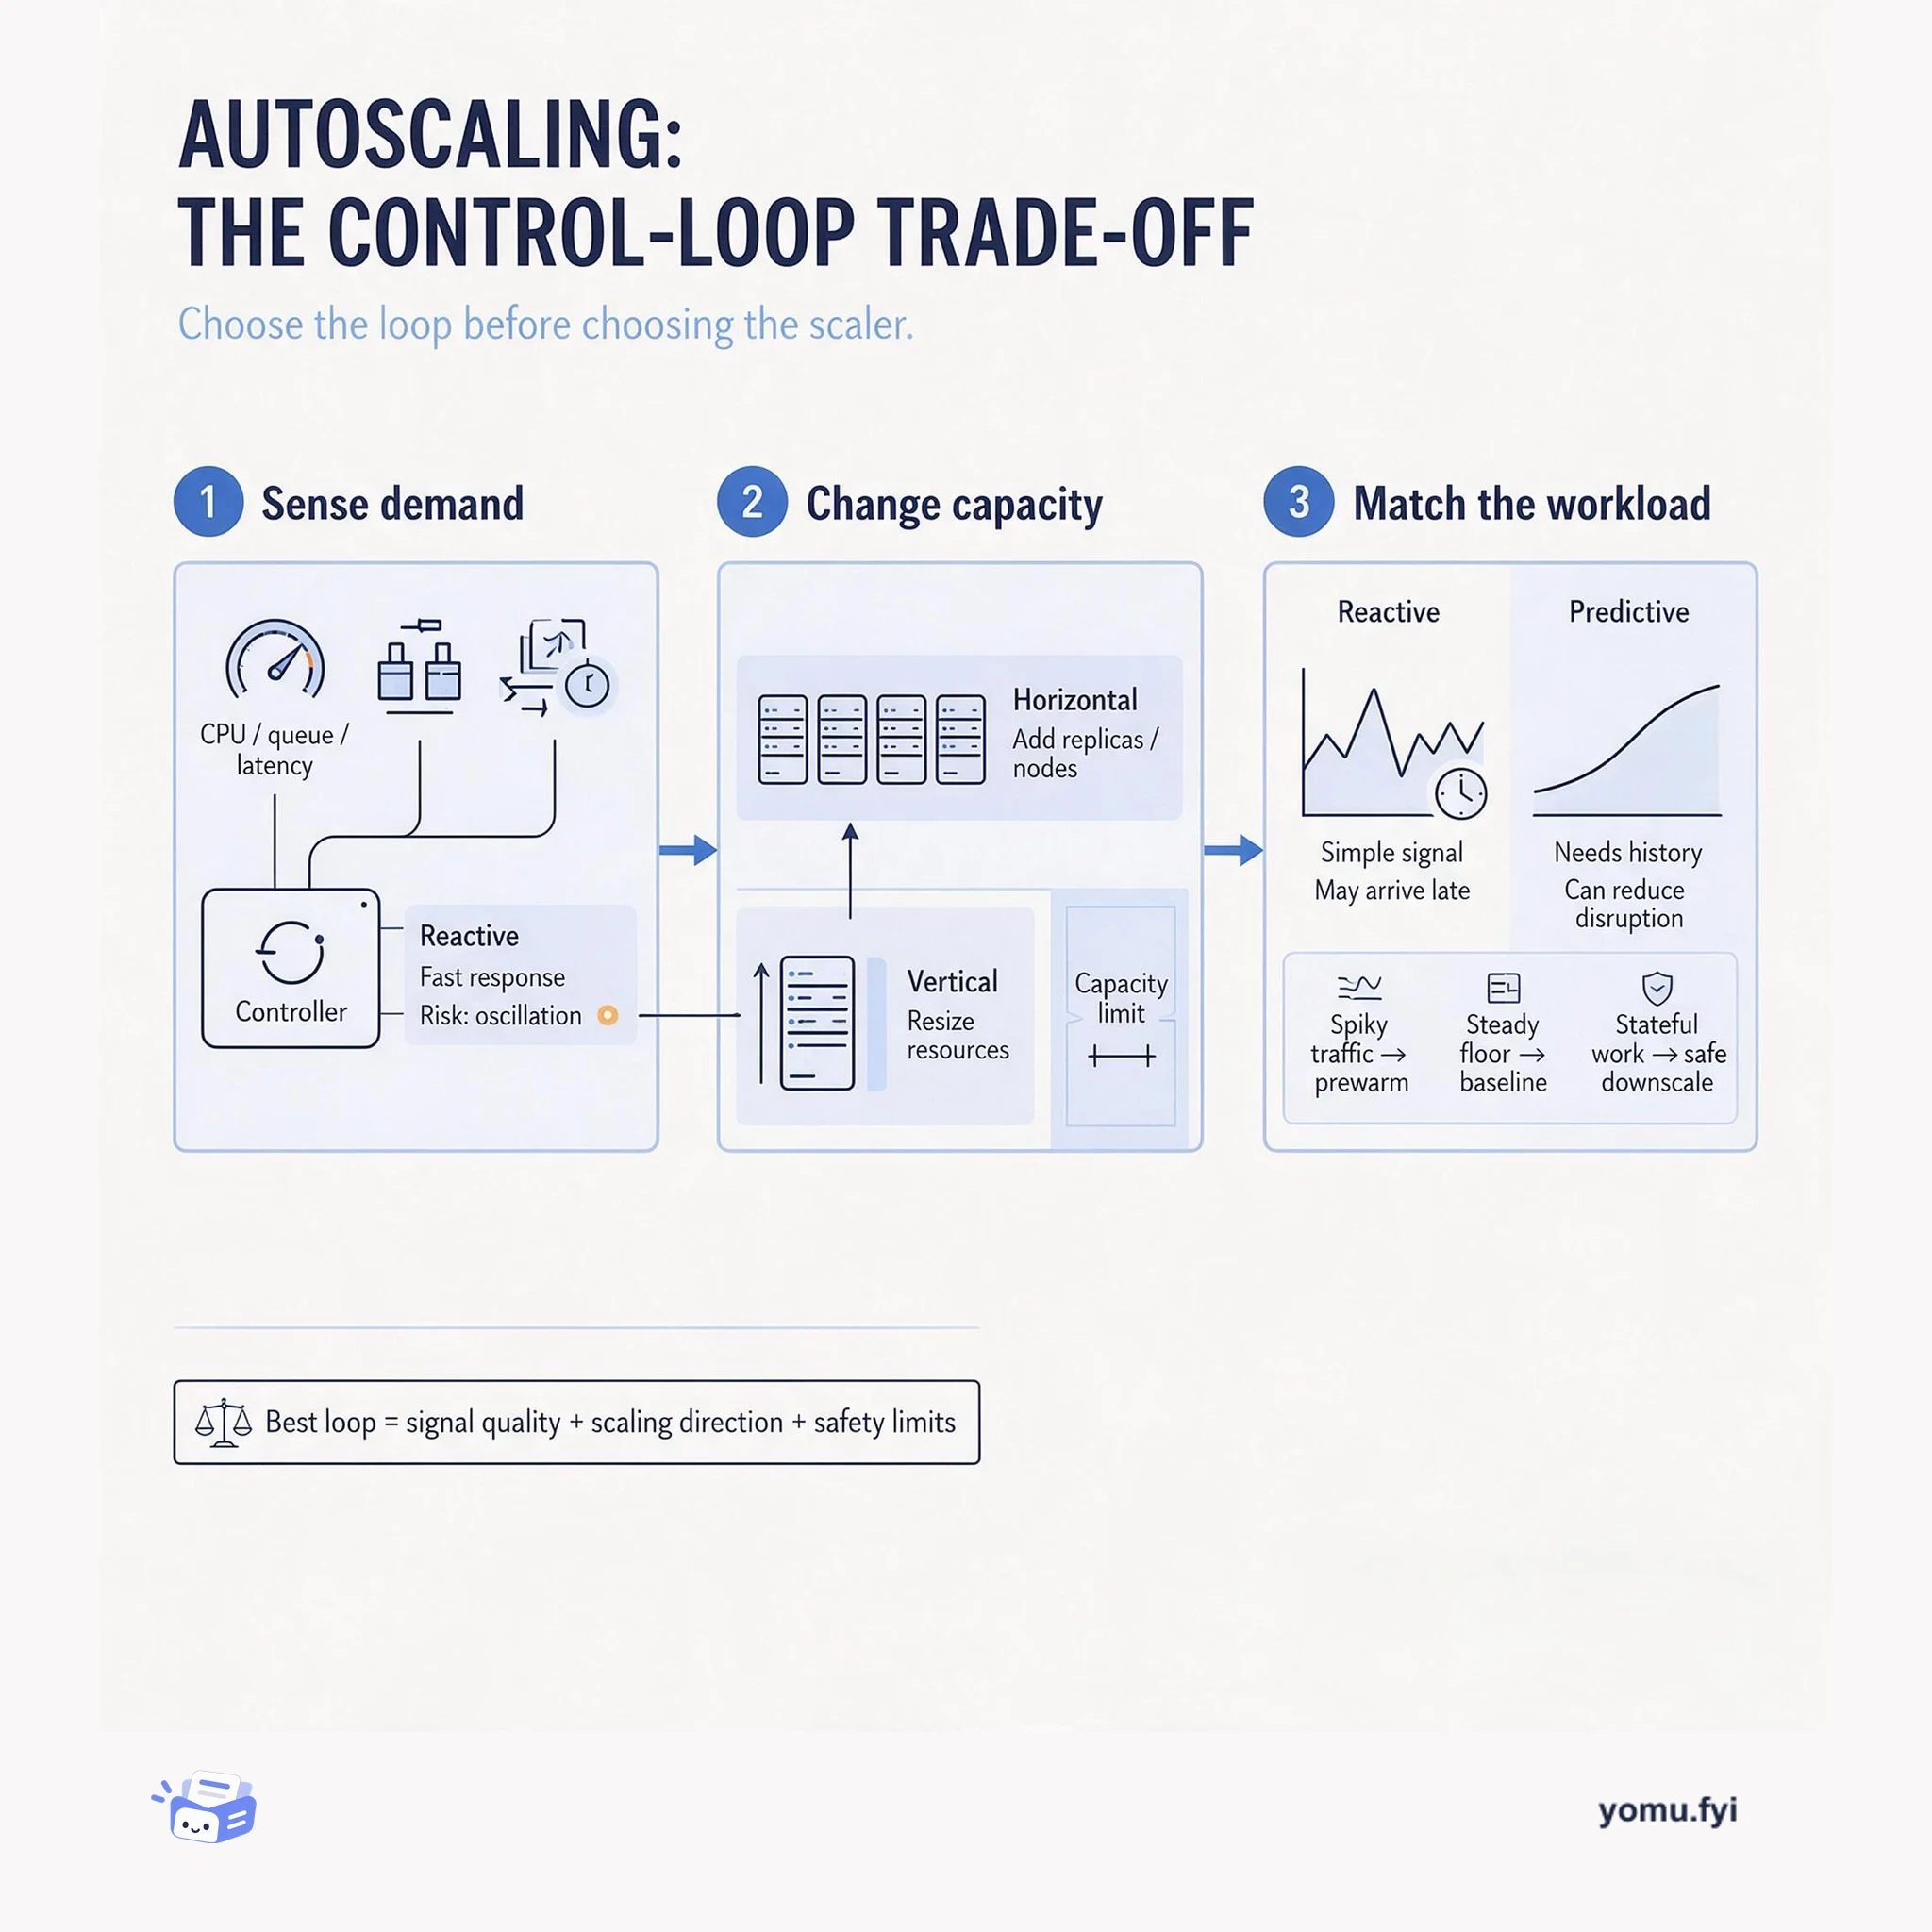
Autoscaling trades responsiveness, stability, and cost: this explainer shows how signal choice, scaling direction, and capacity limits shape the right control loop for a workload.
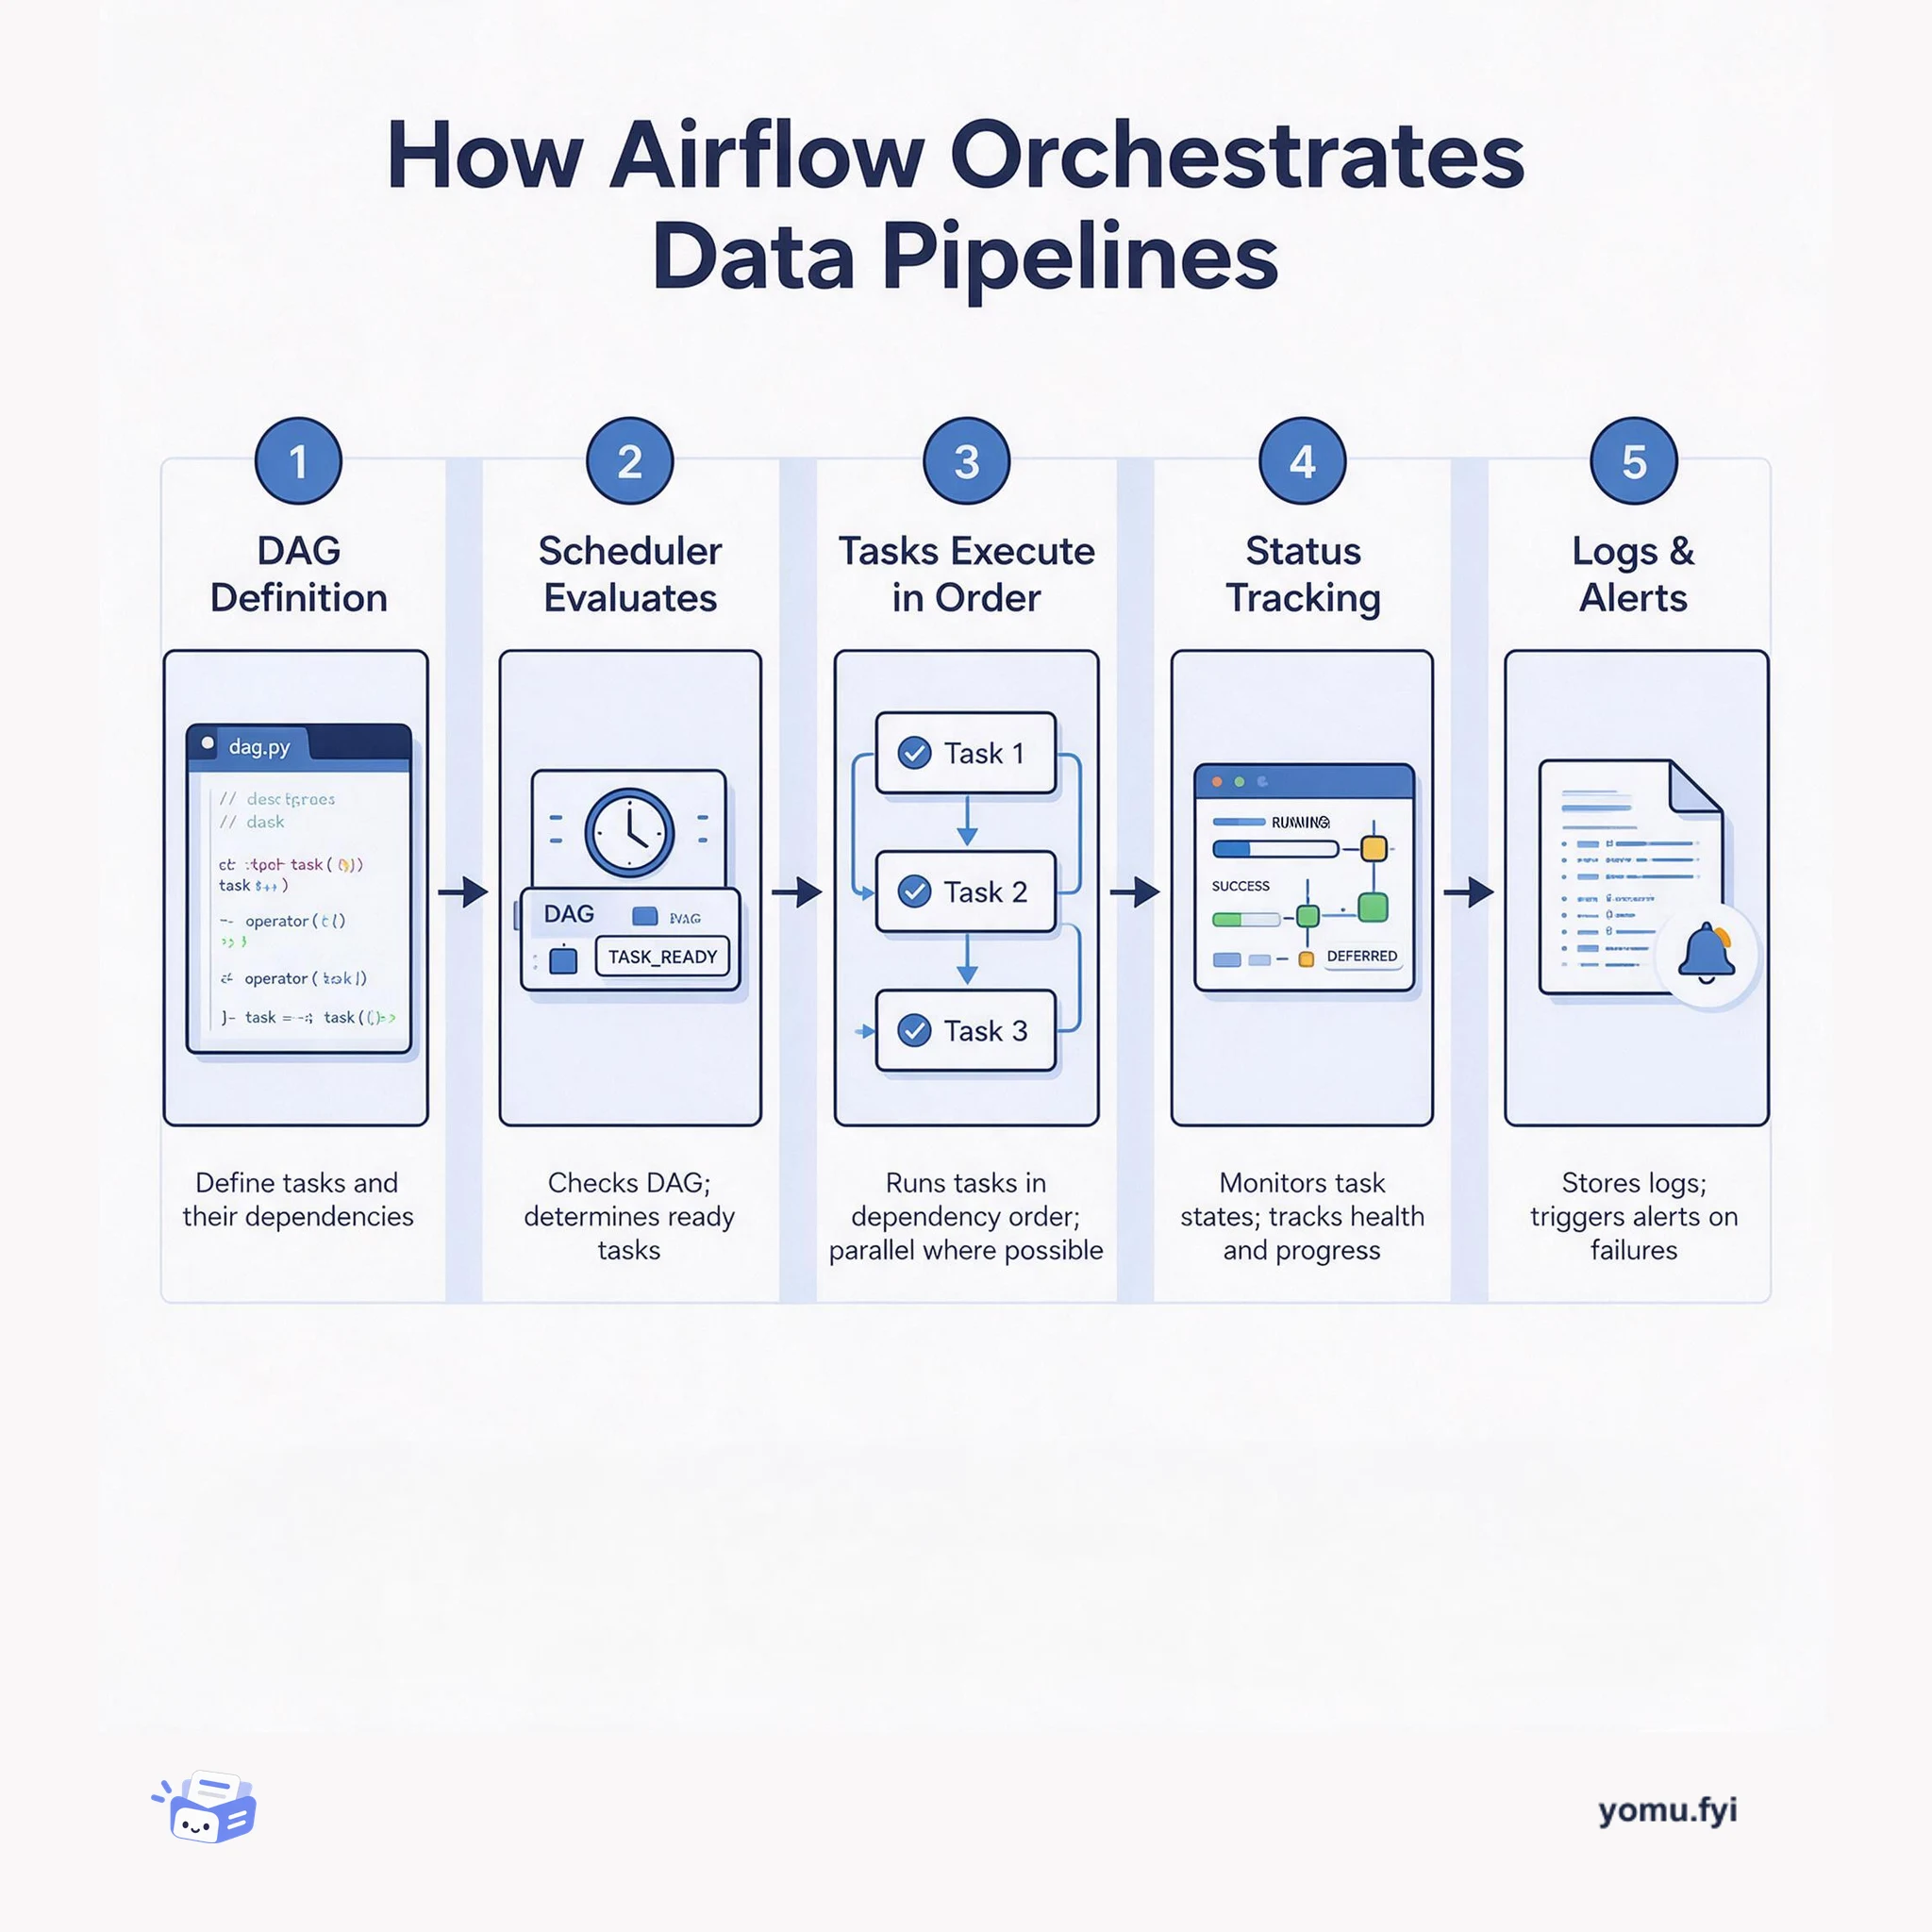
Airflow is a workflow orchestration platform that schedules, monitors, and manages data pipelines by defining tasks as code, executing them in dependency order, and tracking their success or failure.
The Good Stuff
Paid picks we use ourselves. Links carry a referral code — a subscription through one earns us a commission at no extra cost to you.
Newest first
Together GPU Clusters introduces changes for production training and inference workloads, addressing hardware failures, scheduler problems, and the limits of single-admin access. Platform health improvements include continuously running passive health checks, human-approved node repair recommendations, and Slurm-on-Kubernetes 2.0, which adds self-healing daemons, durable job accounting, descendant-process cleanup, and refreshed GPU state after reschedules. Operational controls include a cluster details view with health, utilization, events, configuration, and node actions, plus external OIDC, startup scripts, and an acceptance-test opt-out. Newly provisioned Slurm clusters use the latest stack by default, while existing managed clusters can be migrated during a maintenance window at no cost; the stated result is faster recovery, fewer support tickets, and greater visibility and control for growing teams running large clusters.
Bullet operates a DeFi exchange for perpetuals, spot trading, and lending, with trades settled on a blockchain while users retain custody of their assets. Its sub-millisecond trading system produces more than 150 million event rows per hour, creating a need for historical indexing, real-time analytics, and operational monitoring beyond the blockchain’s state-machine model. ClickHouse Cloud consumes events from Kafka, stores them in dedicated tables, and supports user features, leaderboard and reward calculations, P&L charts, audit logs, and Grafana-backed alerts. Replacing Databricks reduced query latency from 10–15 seconds to milliseconds, improved data freshness from 1–2 hours to under 5 seconds, and removed a separate DynamoDB serving layer at comparable cost while handling 1,000 times more data across staging, testnet, and mainnet.
Fin’s incident-management process is designed to reduce customer impact quickly when deployments, alarms, or customer reports indicate a disruption. It combines customer and product signals, including heartbeat metrics for workflows such as Fin’s response generation, with engineer monitoring of rollouts; a rollback can land in a little under two minutes. Responses run through incident.io and Slack, with defined engineering lead, incident commander, business lead, and resolution owner roles, plus the out-of-hours STRIKE responder group. The lifecycle covers triage, investigation, mitigation, and learning, with a stated preference for rolling back to a known state before fixing forward and with explicit alternatives when rollback is unavailable. After recovery, bounded follow-ups and incident reviews aim to improve recurrence prevention, blast-radius reduction, detection, and response, while early escalation and clear communication make the process repeatable rather than dependent on heroics.
Trigger.dev, an open-source platform for serverless asynchronous tasks, needed to scale observability for increasingly complex, long-running AI workflows spanning thousands of tenants. Its initial Postgres design stored logs, traces, and events in a growing table, making indexes, analytics, and operational reliability increasingly difficult to manage. The team moved observability workloads to ClickHouse after evaluating performance, scalability, open-source compatibility, deployment flexibility, and support for dynamic telemetry, including its native JSON data type. Migration occurred gradually at the task-execution level, routing each run’s logs to either database without downtime or customer intervention. ClickHouse now supports real-time telemetry analysis, approximately 200-millisecond P95 latency for queries returning tens of thousands of rows, and a dramatically smaller telemetry storage footprint.
Targeted structured logging provides a fast way to capture operational behavior in production without requiring new deployments for debugging. Developers benefit most from logging key runtime decisions, multi-step algorithm outcomes, mutating audit operations, and context around non-critical or retried errors. Rather than outputting plain text, applications should record structured key-value pairs that capture who performed an action, what occurred, and associated trace identifiers. Sensitive information such as secrets and personally identifiable data must be excluded or scrubbed, and large unparsed payloads should be avoided to prevent excessive costs. Managing log levels appropriately and treating logs as potentially temporary instrumentation helps maintain actionable telemetry without generating unnecessary noise.
Industrial machinery produces high volumes of alarms and sensor readings that exceed manual triage capacity. To address this bottleneck, an end-to-end GPU-accelerated AI agent is designed using NVIDIA NeMo libraries, Nemotron open models, and the NVIDIA OpenShell runtime behind a single HTTP endpoint. When triggered with an alarm payload and sensor frame, the agent gathers historical context using cuDF, cuVS, and NeMo Retriever, queries data warehouses via Text-2-SQL, and executes specialist signal checks with tools like cuFFT and cuML. Nemotron 3 Nano manages orchestration tasks while Nemotron 3 Super synthesizes the gathered evidence. The workflow outputs a structured package containing an observation, root-cause hypothesis, remedy, and recommended action within a seconds-long latency budget.
ClickStack now supports AI-generated dashboards and linked investigative workflows from natural-language prompts, targeting the effort required to understand telemetry, write queries, choose visualizations, and iterate. Rather than asking an LLM to return a finished artifact, ClickStack uses an AI Notebook with the same MCP tools available to external agents, where queries, visualizations, findings, and reasoning are captured in a persistent, editable investigation. The system explores telemetry, validates assumptions, assembles dashboards, and can connect overview and service-level dashboards through dashboard actions; generated charts remain editable. The same MCP server exposes these capabilities to agents such as Claude, Cursor, and Codex, so users can create, refine, and extend dashboards through one toolchain.
ClickStack’s inherited OpenTelemetry Collector schema was struggling with slow searches, Top N queries, and aggregations that could time out on large observability workloads. The team prioritized common log and trace access patterns, including exact-attribute searches, body-text queries, histograms, individual log lookups, and distinct-key or value introspection. They used fixed production-like workloads and iterative testing with ClickCannon, Kubernetes-managed environments, ephemeral ClickHouse Cloud instances, and controlled schema, query, and version comparisons. The resulting redesign combined primary-key changes, text indexes, query rewrites, alias columns, materialized views, and newer ClickHouse features, reducing representative query latency by more than 5× while balancing ingestion, storage, and operational efficiency.
Usage is an Apple ecosystem resource monitor that relies on undocumented APIs vulnerable to silent data structure changes across OS updates. To maintain stability across iPhone, iPad, and Mac without degrading device performance, the development team uses Sentry across separate component projects in a unified workspace. Beyond capturing standard crashes, the team wraps Swift errors with unexpected raw data payloads to quickly diagnose undocumented API structure drift while scrubbing sensitive user values. They also employ Sentry Size Analysis as a regression gate to monitor release payload deltas, preventing unintended asset omissions or bloat from slipping through code reviews. This multi-layered monitoring setup enables the team to detect and resolve platform-induced breakages before most end users encounter them.
ClickHouse Agents is now available for all Managed Postgres services in ClickHouse Cloud, extending its plain-English agent interface to operational data. The beta service, powered by Claude and built on LibreChat, combines an agent builder and chat interface with a sandboxed code interpreter; it is read-only by default and supports MCP-compatible systems. Agents can inspect Postgres schemas, run read-only queries, return the SQL used, and reason across Postgres and ClickHouse by querying each engine independently before merging results. Additional skills guide migration from Postgres to ClickHouse through discovery, access-pattern analysis, schema design, type mapping, CDC ingestion, and validation, while other workflows use metrics, Query Insights, and EXPLAIN to rank performance fixes. Planned extensions include scheduled recommendations and safe automated remediation, but the current release focuses on exploration, analysis, monitoring, and guided database work.
Databricks AI describes GPU reliability as a fleet-scale problem involving crashed jobs, silent slowdowns, and numerical corruption during distributed training. Its approach combines stress testing with demanding reinforcement learning, agentic coding, and document intelligence workloads, plus gpu-monitor, a multi-stage service that checks nodes during bootstrap, continuously while active, and periodically between workloads. The checks cover compute burn-in, peer connectivity, NCCL correctness and bandwidth, RDMA, ECC and HBM memory, PCIe integrity, throttling, thermal conditions, XID errors, and fabric health. A production incident showed why cumulative InfiniBand port downtime matters: a single outage exceeded the lower-level NCCL_IB_TIMEOUT, killing a collective before the longer PyTorch watchdog timeout. Nodes that fail checks are quarantined, while inter-node probes sweep message sizes from 8 bytes to 2 GiB and apply latency or BusBW criteria; the system is continuously expanded as new failure modes emerge.
amazon.science
Amazon measures carbon intensity across its diverse business operations to track progress toward its goal of reaching net-zero carbon by 2040. For retail operations, the company monitors carbon emissions per unit shipped, achieving a 39 percent reduction by the end of 2025 compared to 2019 baselines. This per-unit decrease stems from targeted investments in electric delivery vehicles, carbon-free energy, smarter package routing, lightweight packaging, low-carbon fuels, and alternative transport modes like rail. To improve industry comparability and transparency, the company updated its economic carbon intensity indicator in 2025 from emissions per dollar of gross merchandise sales to emissions per dollar of revenue. Carbon intensity is also evaluated regionally and nationally to isolate geographic variations and implement localized decarbonization interventions across supply chain networks.
Automated evaluations often miss unknown failure modes in AI agents because developers only write tests for anticipated errors. While building an itinerary agent for AI Engineer World's Fair, an open-weight model routed a speaker query to a tool returning only tracks, leading the model to hallucinate famous speakers and falsely claim the tool provided that data. Because a tool was executed, the trace appeared grounded until inspectable tool outputs revealed the discrepancy. To resolve this, the author retained the inexpensive model, corrected query routing, tightened system prompts against ungrounded entities, and added a custom entity-diffing eval in CI. Ultimately, directly reading agent telemetry traces alongside errors and logs is essential for diagnosing root causes and deciding trade-offs between model costs, prompt adjustments, and routing fixes.
Supabase has made its OpenCode integration available, connecting an AI coding agent to Supabase account and project management APIs and bundled Supabase skills. Users invoke /supabase, authenticate, and, for database, Edge Functions, logs, and other project-scoped capabilities, are guided through connecting Supabase MCP; the integration requires OpenCode 1.3.4 or later. It can list organizations and projects, create projects, open the MCP setup flow, monitor agent activity in real time, and let agents query data, check logs, and deploy functions, while the plugin is open source. The post demonstrates the workflow in Minecraft, where OpenCode connected through MCP, created and populated a table, and deployed an Edge Function on a real Supabase project.
Next.js provides out-of-the-box tracing for incoming requests, fetch calls, middleware, and server-side rendering, but traces remain invisible without a configured exporter. Developers can use the @vercel/otel package inside an instrumentation file to initialize the OpenTelemetry SDK and transmit traces to any OTLP-compatible destination. While Next.js automatically creates spans for standard request lifecycles, developers can define custom active spans in the Node runtime to capture specific domain operations and contextual attributes. Exporting traces to backends like Sentry requires configuring standard OTLP endpoint and authentication environment variables. Choosing between direct OTLP export via @vercel/otel and the dedicated Sentry SDK depends on requirements, as direct export lacks browser tracing, error monitoring, and Edge custom spans.
ClickStack’s May and early-June release focused on making observability dashboards more useful during investigations and expanding access to related workflows. Dashboard table actions can open searches against selected sources with templated WHERE clauses or link to other dashboards, while scoped filters prevent source-specific conditions from affecting unrelated tiles. Number visualizations gained fixed or threshold-based colors and automatic text scaling, and the service map added latency percentiles, throughput metrics, server-side filtering, and focus mode. The release also includes a Browser RUM dashboard template, experimental PromQL support through the ClickHouse TimeSeries Engine, expanded MCP tools, AI Notebooks beta for Managed ClickStack, and ClickStack Cloud in private preview.
Observability vendors are increasingly betting on a universal SRE agent that combines a platform, telemetry, and natural-language investigation. The post argues that debugging depends on team-specific systems, trusted signals, failure history, runbooks, workflows, and institutional knowledge that cannot be packaged into one vendor’s agent. Agents can compare more time windows and pursue more hypotheses than human investigators, creating demand for low-latency query infrastructure and more complete, high-fidelity historical data. It proposes a more open model in which teams build specialized agents on headless observability foundations, with APIs, data storage, and an observability MCP, while persistent investigation surfaces preserve work for collaboration and reuse. Humans remain responsible for direction, judgment, and action, so the near-term future is presented as human-agent collaboration rather than autonomous incident resolution.
Stripe describes integrating stablecoin settlement into its existing Global Payments and Treasury Network (GPTN), rather than creating a parallel system. GPTN models accounts, wallets, and payment rails as a directed graph, allowing routing, netting, cross-entity settlement, FX, reconciliation, and liquidity management to span fiat and blockchain flows. For a payout, Stripe records a pending stablecoin obligation, Bridge draws from a stablecoin liquidity pool to credit the recipient within seconds to minutes, and fiat replenishment proceeds asynchronously over traditional rails; reverse flows work similarly. A direct mode bypasses the usual few-minute planning cycle for urgent wallet funding, trading netting efficiency for speed, while standard flows continue batching. The live infrastructure handles real traffic, with ongoing work focused on forecast-driven liquidity, faster replenishment through RTP and SEPA Instant, and broader product and corridor coverage.
Postgres managed by ClickHouse, which entered public beta in May, received a broad update covering console operations, per-service RBAC, Terraform, Stripe provisioning, ClickPipes migrations, billing, capacity reservations, and extensions. The redesigned console adds service health, resource, and query views, while RBAC provides View and Manage roles across the console and public REST API; the alpha Terraform provider covers lifecycle operations including resizing, HA, replicas, restore, and password rotation. Postgres-to-Postgres ClickPipes now automate schema migration, usage is integrated into ClickHouse Cloud’s metering and billing, and AWS capacity reservations are allocated dynamically across availability zones. Underneath, pg_clickhouse and pg_stat_ch moved to the header-only clickhouse-c library, removing a C++ exception conflict, using Postgres memory contexts, and reducing the x86-64 Linux extension binary from 4.9 MB to 1.4 MB; the update shipped less than a month after beta, with Terraform and extensions still evolving.
Payment fraud detection is presented as a real-time practice for identifying and blocking unauthorized transactions amid evolving card-not-present, account takeover, authorised push payment, friendly, and card-testing attacks. Modern systems combine predefined rules, machine learning, behavioral analytics, device fingerprints, geolocation, transaction history, and velocity signals to calculate risk scores within milliseconds, declining or routing high-risk payments to review. Rules are fast and interpretable but require continual tuning, while machine-learning and behavioral models can identify complex or user-specific patterns that static thresholds miss. The source also emphasizes prevention controls such as MFA, tokenization, 3D Secure, and device binding, alongside unified real-time data infrastructure that supports cross-channel signals, continuous retraining, and deployment into payment authorization flows.
The best engineering reads, once a week.