Anomaly Detection: From Baseline to Action
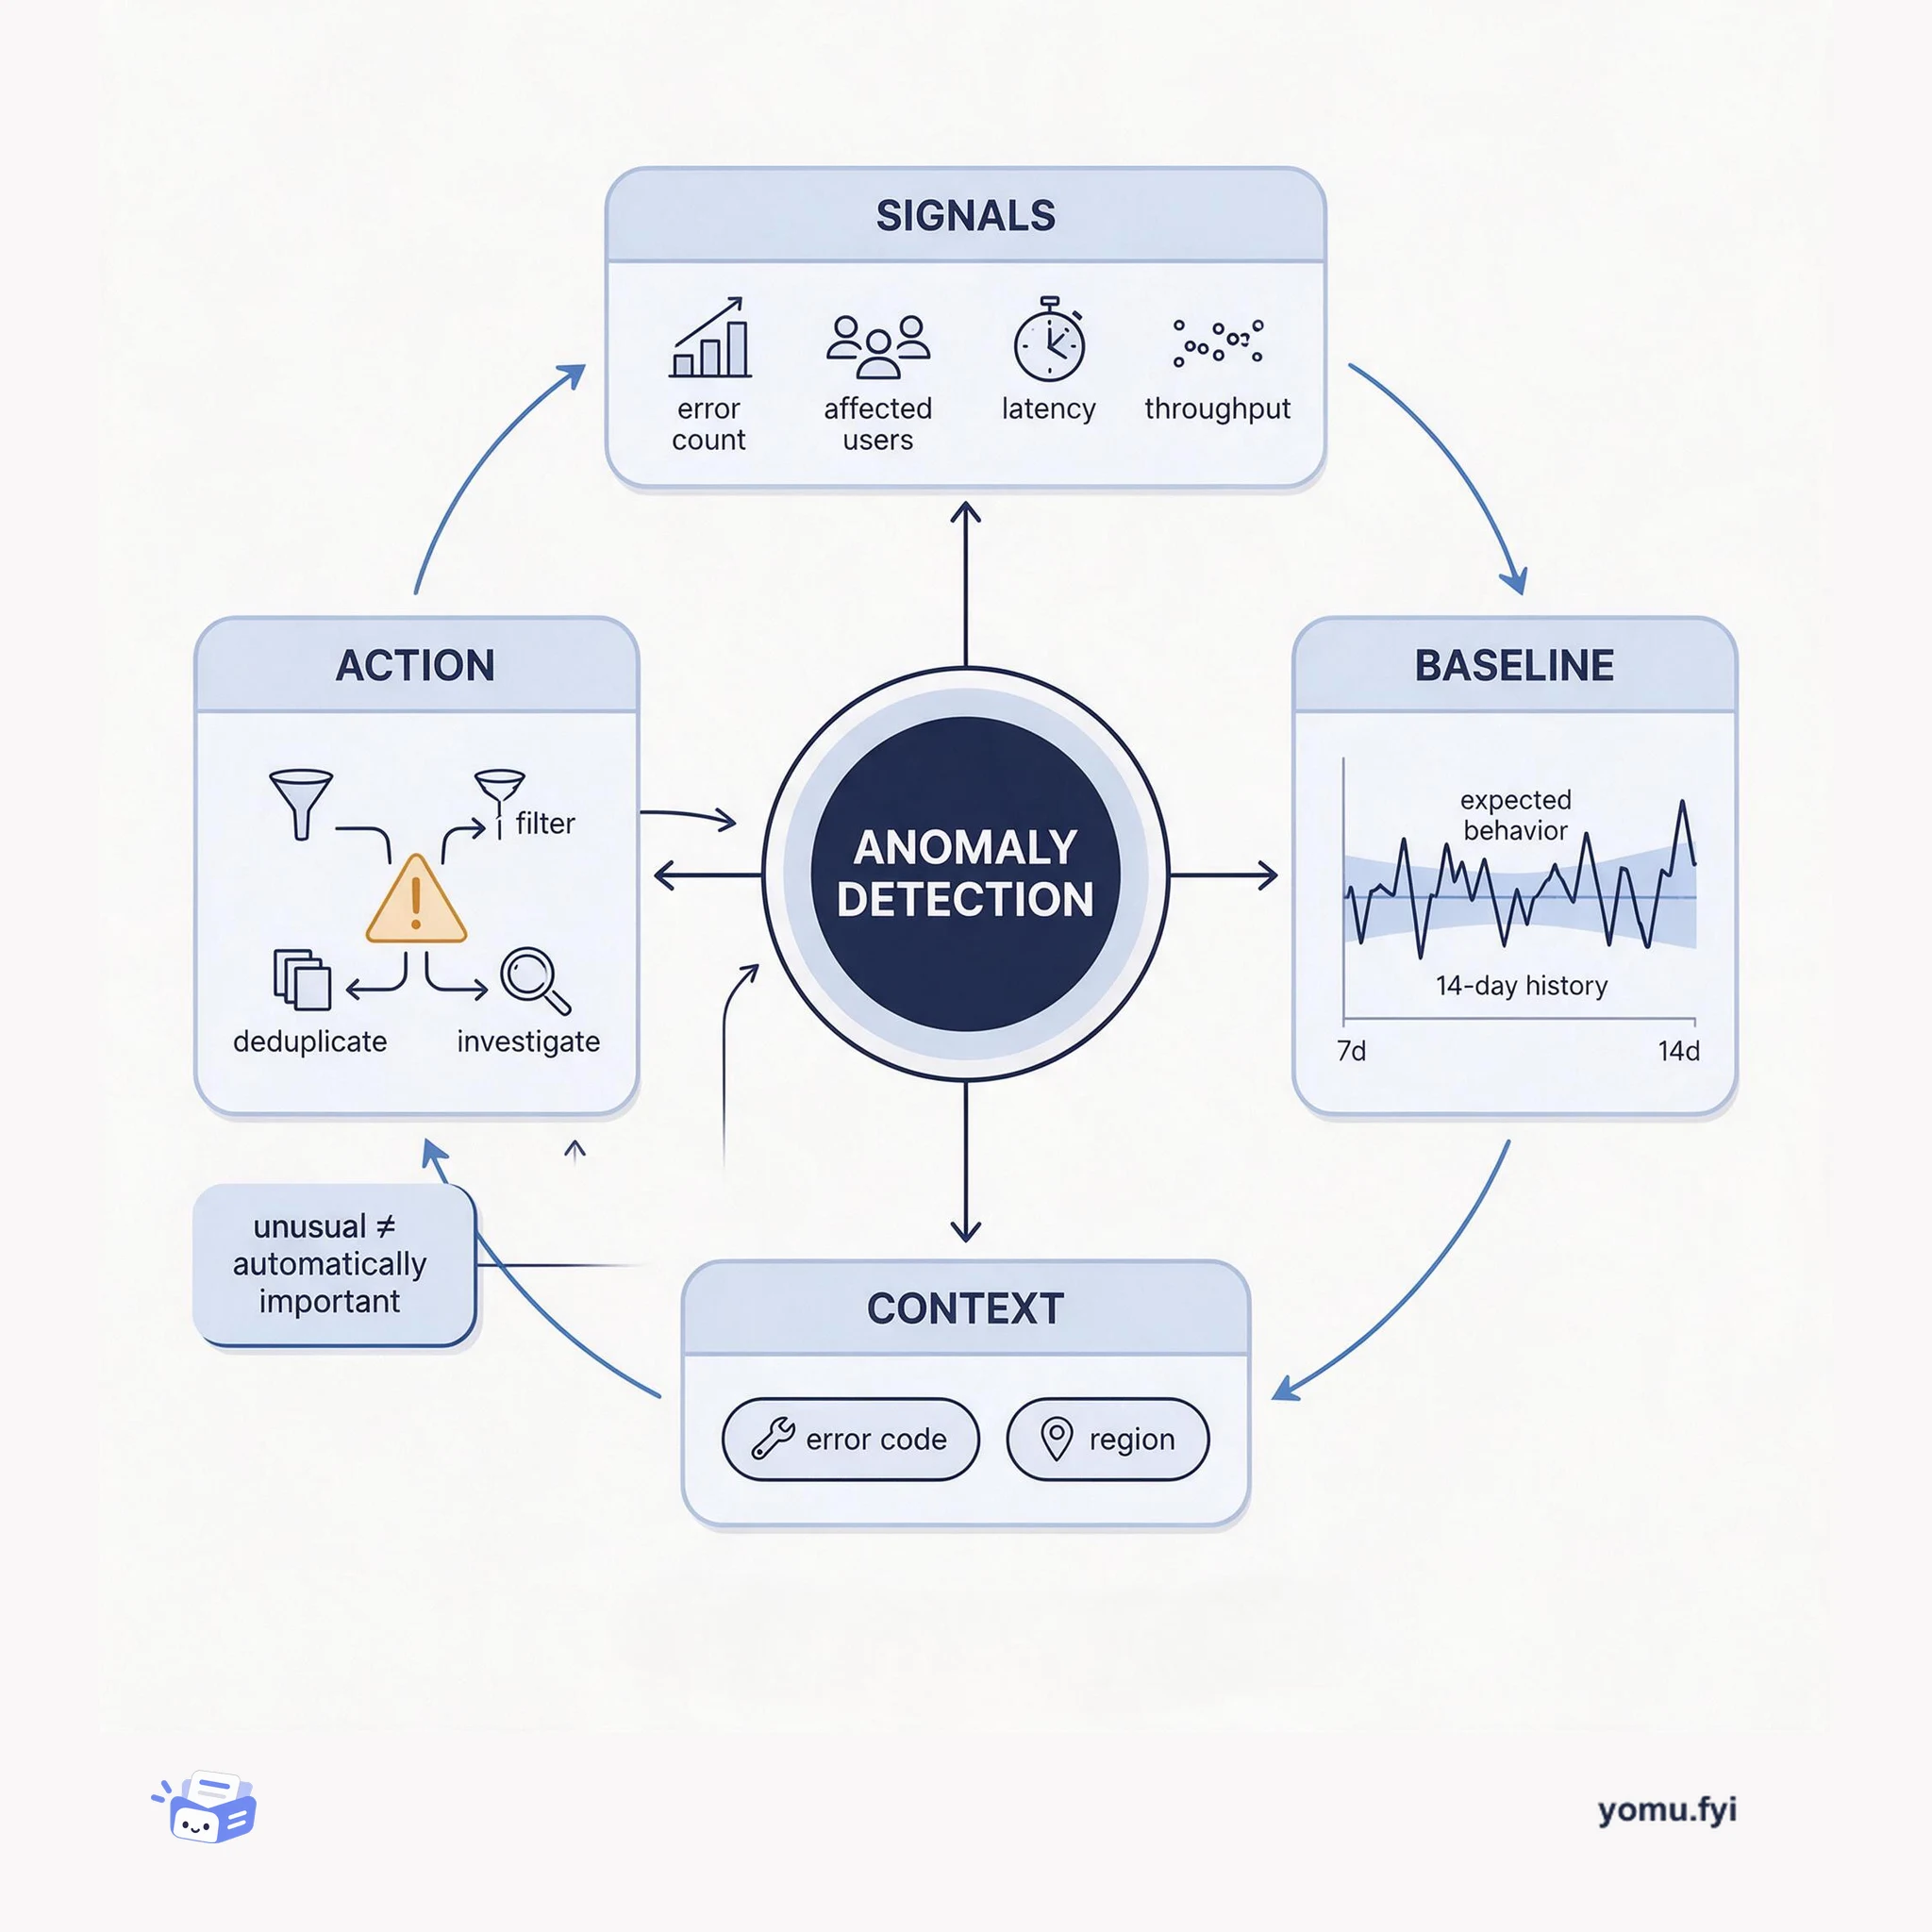
Anomaly detection identifies meaningful departures from expected behavior. This explainer shows how signals, baselines, context, and alert routing turn unusual measurements into engineer-ready findings.
Loading…
Topic
196 posts about Monitoring. Every summary links to the original.
See the idea
Anomaly detection identifies meaningful departures from expected behavior. This explainer shows how signals, baselines, context, and alert routing turn unusual measurements into engineer-ready findings.
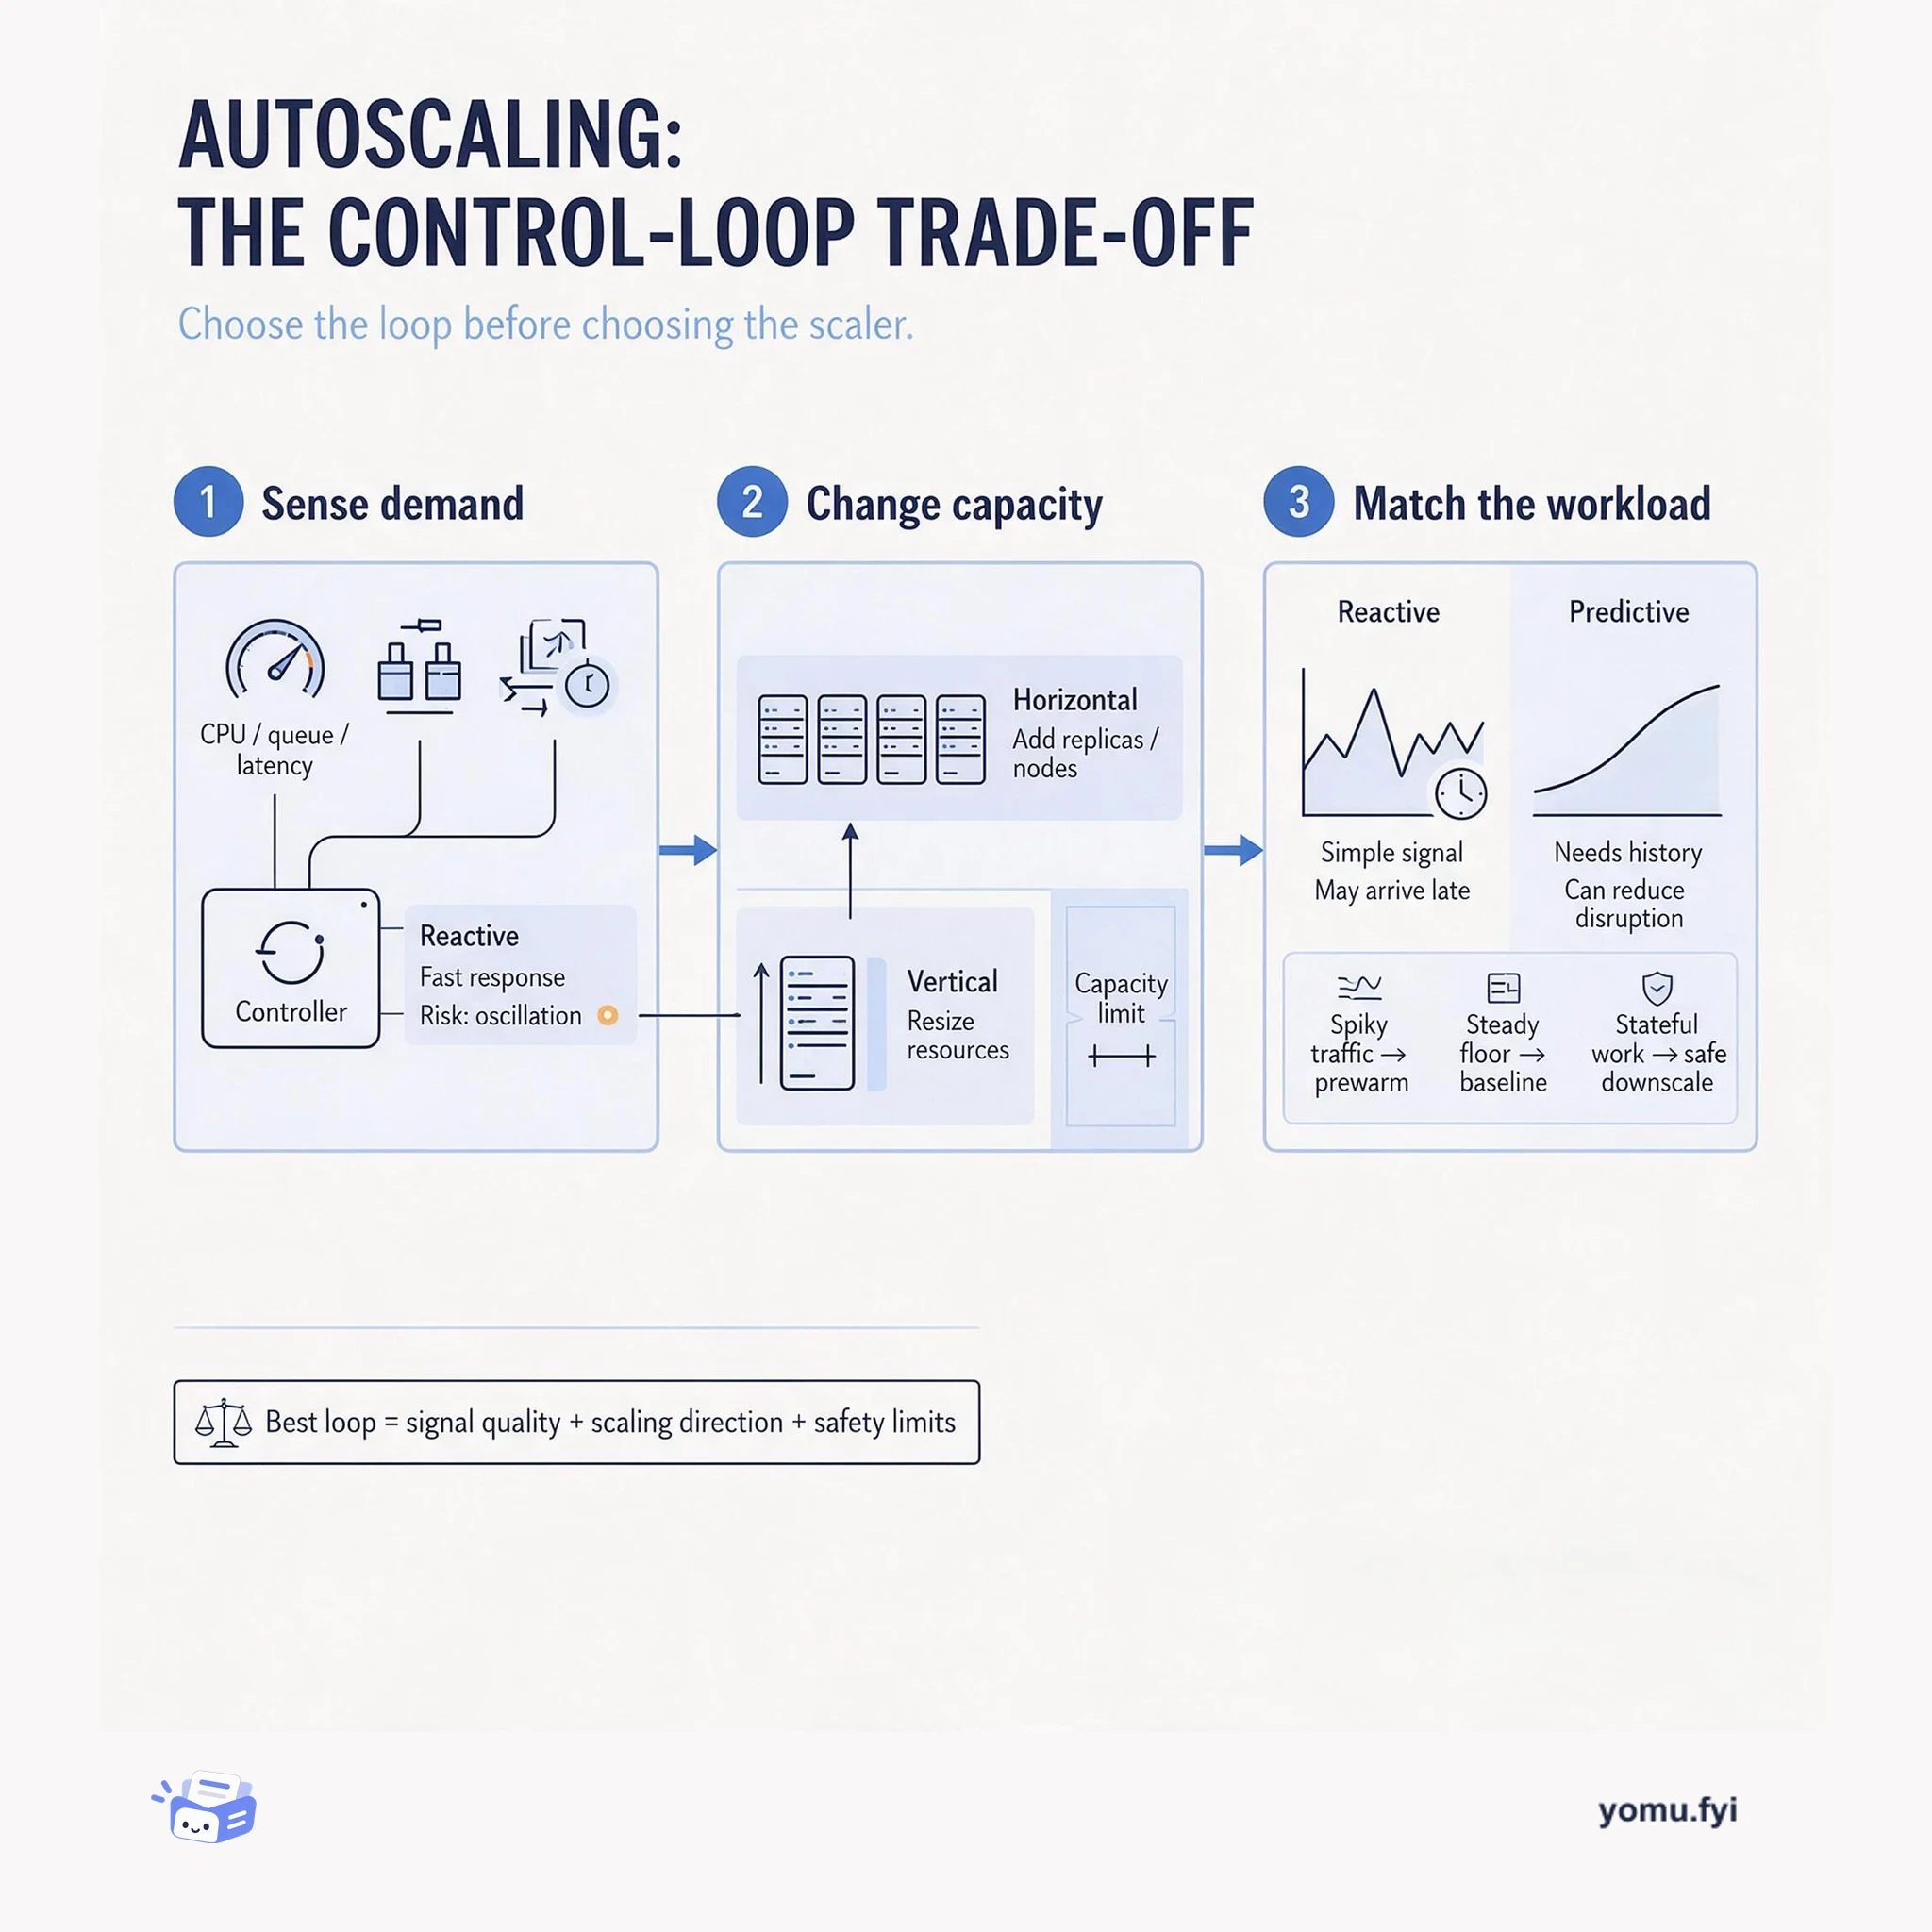
Autoscaling trades responsiveness, stability, and cost: this explainer shows how signal choice, scaling direction, and capacity limits shape the right control loop for a workload.
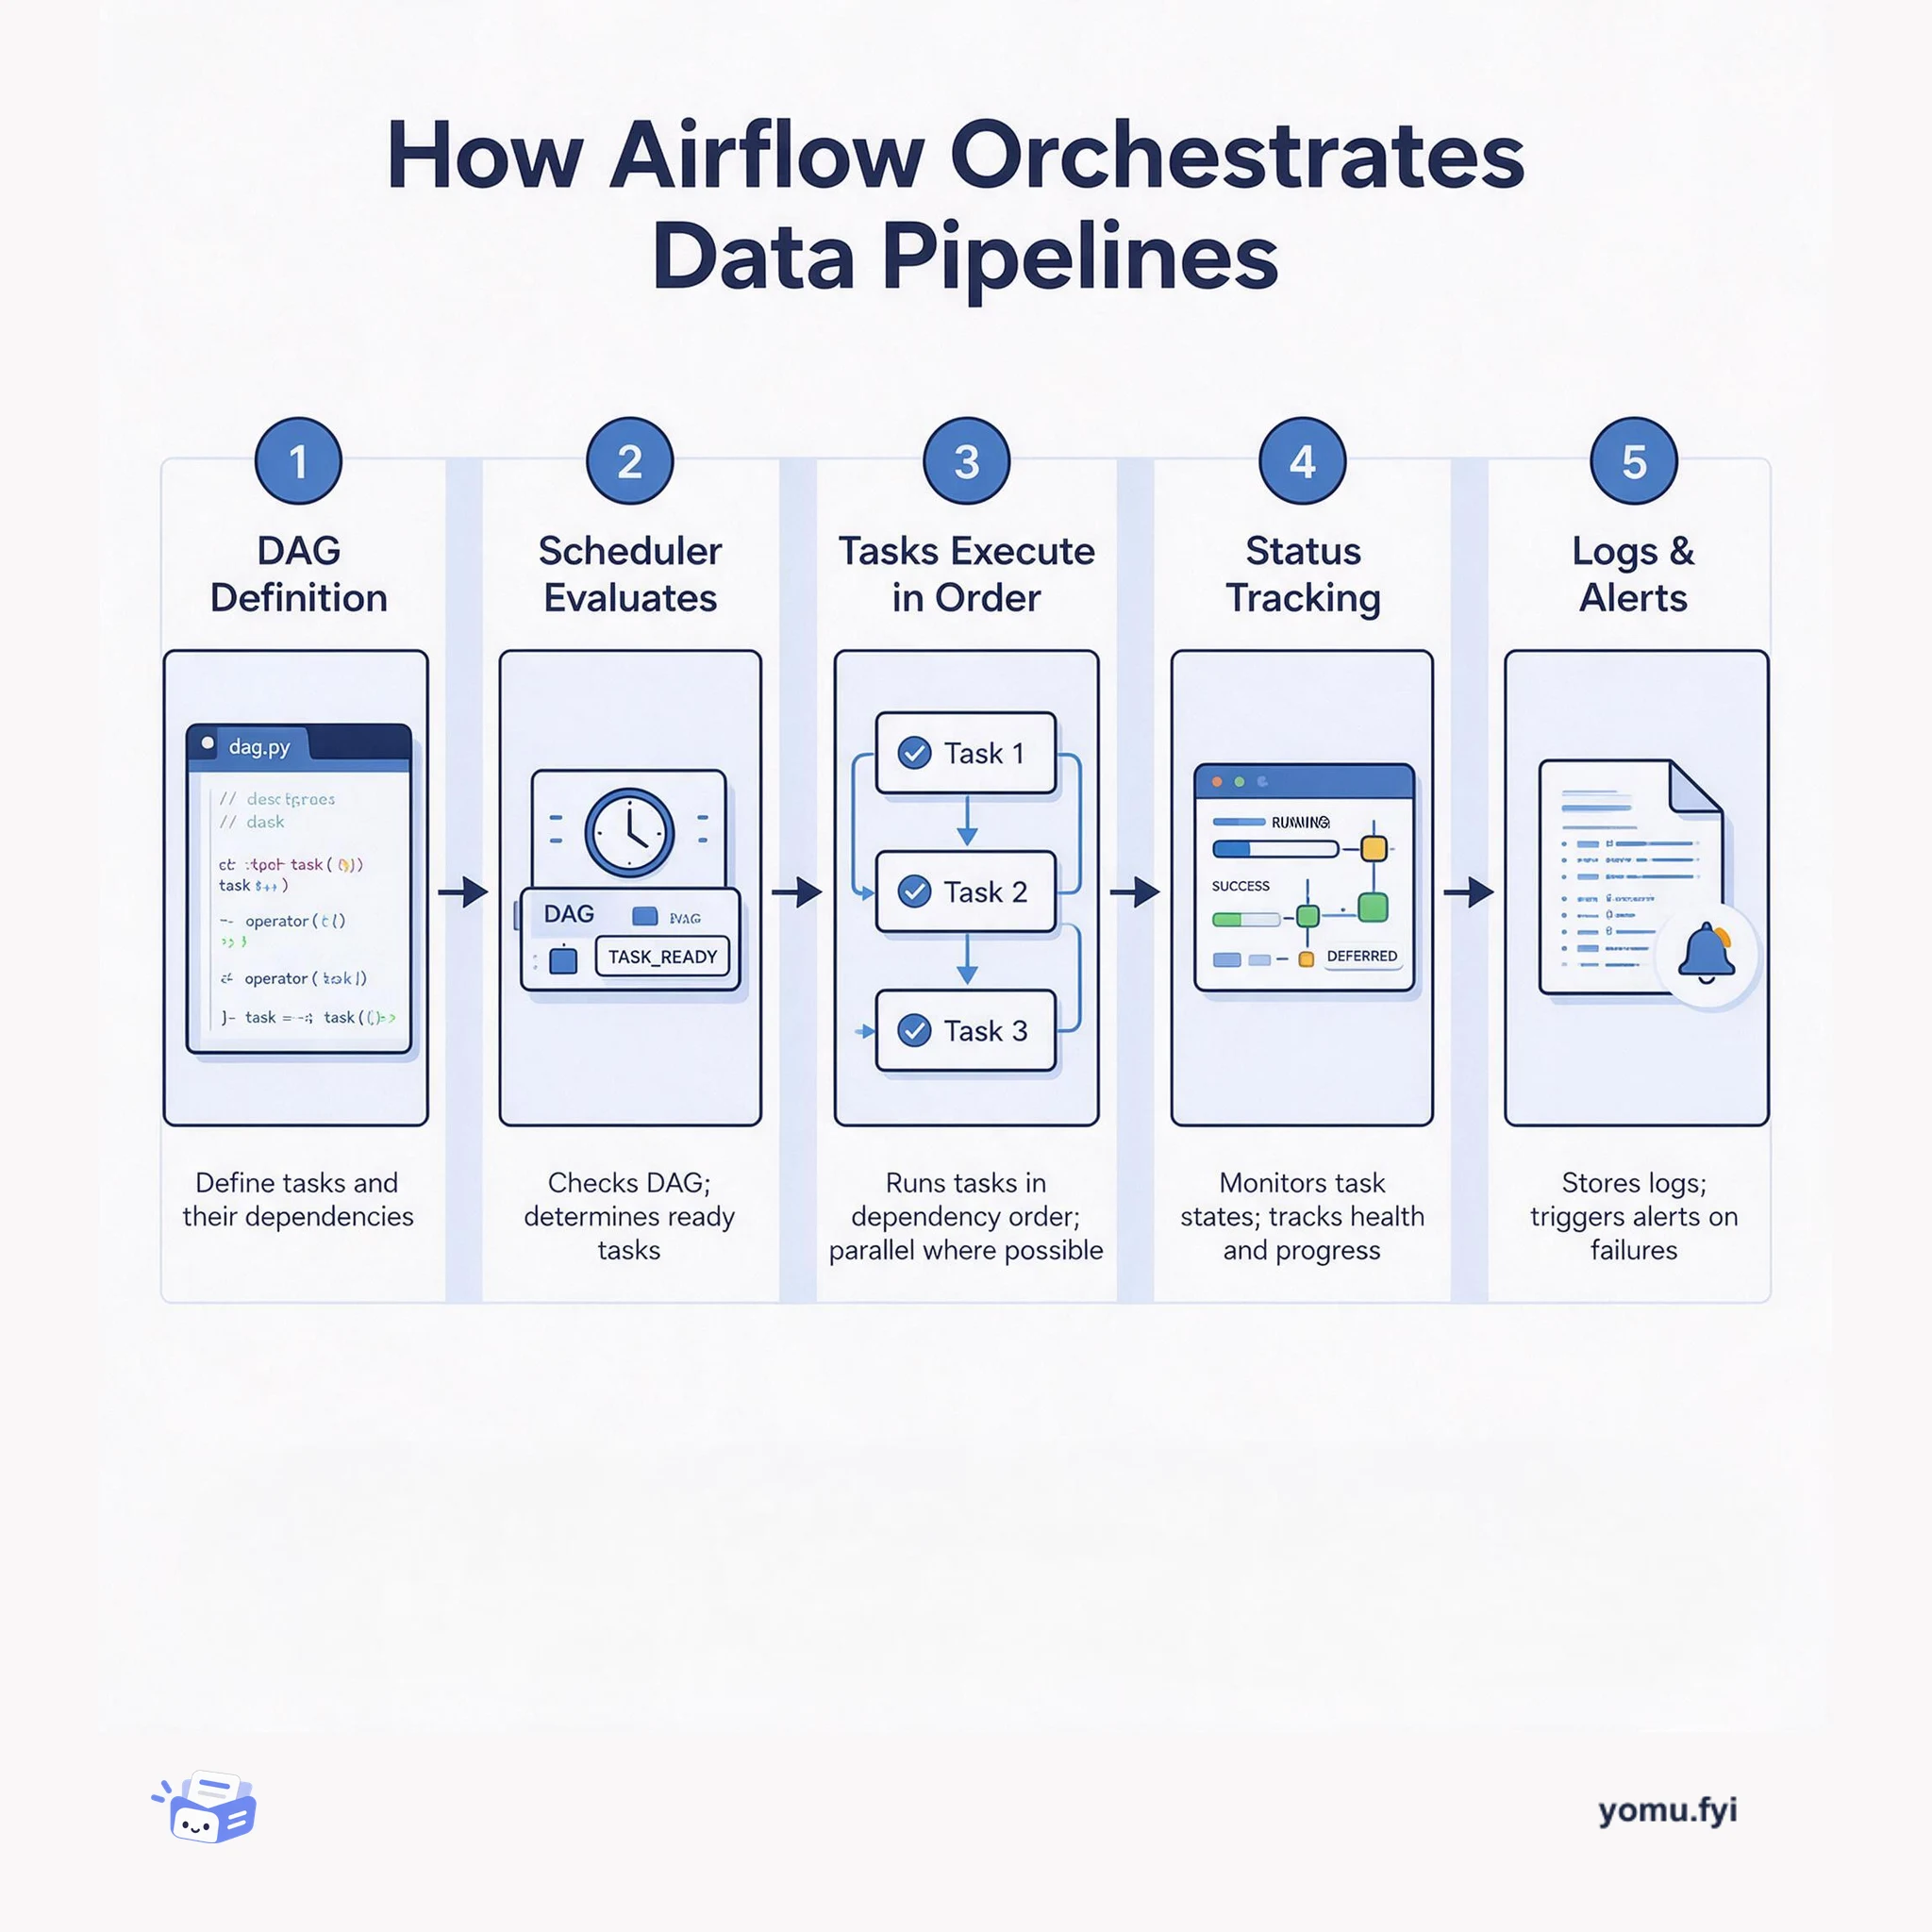
Airflow is a workflow orchestration platform that schedules, monitors, and manages data pipelines by defining tasks as code, executing them in dependency order, and tracking their success or failure.
The Good Stuff
Paid picks we use ourselves. Links carry a referral code — a subscription through one earns us a commission at no extra cost to you.
Newest first
ClickHouse has announced a GCP Pub/Sub connector for ClickPipes, now in Private Preview, to stream GCP infrastructure logs, application events, and operational signals into ClickHouse Cloud in real time. Previously, routing data from Pub/Sub into ClickHouse required GCS or a Dataflow pipeline; the connector instead manages subscription lifecycle, schema inference, and message delivery after a topic and target table are configured. It supports JSON, Avro, and Protobuf, Pub/Sub Schema Registry integration, automatic decompression, attribute-based filtering, and start positions of latest, earliest, or a specific timestamp. ClickPipes supports horizontal and vertical scaling, configurable replicas, automatic retries, built-in metrics and logs, and programmatic management through OpenAPI and the ClickHouse Terraform Provider. The connector is available upon request and free during Private Preview, with access offered through a waitlist or a ClickHouse Cloud account manager.
Genie ZeroOps is an autonomous background agent for monitoring and operating data and AI assets, including jobs, pipelines, tables, and ML models. It continuously detects visible and silent failures, uses Unity Catalog lineage and platform observability to assess root causes, generates remediation through development workflows, and verifies fixes in isolated sandboxes. These environments use shallow, zero-copy table clones, scoped permissions, and network isolation, so proposed changes run against real data without touching production or applying anything before approval. For ML workloads, the agent can diagnose degraded predictions, train a candidate on corrected features, evaluate it against the production model’s existing eval suite and criteria, and support live-traffic ramping when it is measurably better. Genie ZeroOps is entering private preview in the coming weeks, initially supporting jobs, pipelines, tables, and ML workloads; Apps and Lakebase databases are on the roadmap.
Qube Research & Technologies (QRT), a global quantitative investment manager headquartered in London, uses ClickHouse Cloud for a data platform that serves researchers and for near-real-time risk monitoring, management, and P&L. Founded in 2018 as a cloud-native firm after the spinout of Credit Suisse’s proprietary trading arm, QRT chose a cloud-based approach rather than inheriting decades of on-premise infrastructure. The platform supports two major systems, while ClickStack consolidates logs, metrics, and traces for observability; alerts, log queries, and metric aggregations run against a single ClickHouse instance using standard SQL. QRT says its previous database was constrained by writer and reader counts and total cluster load, whereas ClickHouse provides greater speed and scalability, and that a unified monitoring backend simplifies maintenance while remaining reliably fast.
ClickHouse Cloud can automatically scale infrastructure up and down, but teams may need to monitor latency SLAs for specific workloads such as a frontend dashboard requiring p99 under 200 ms. The guide tags queries with log_comment, reads system.query_log through clickhousectl, and aggregates query_duration_ms over a defined window to measure the SLA. When it is breached, operators compare query volume and latency with Prometheus-compatible CPU, memory, and concurrency metrics to distinguish increased concurrency from resource contention, then choose horizontal replica scaling or vertical replica sizing. A cron-based script can scale out when p99 exceeds a threshold, while an agent can inspect evidence and apply one scaling action using clickhousectl; actions are recorded in the ClickHouse Cloud activity log.
Modern application telemetry relies on four overlapping signals: errors, traces, logs, and metrics. Each telemetry type addresses distinct engineering questions and powers specific debugging workflows. Errors track grouped, actionable application crashes, whereas traces map timing and execution paths across dependency waterfalls. Metrics aggregate numerical measurements across historical deployments, and logs preserve complete state and decision-making context at specific moments in execution. Emitting telemetry directly into the format needed for a given workflow proves superior to relying on a single wide event, as tools like AI coding agents require structured spans to optimize execution paths while human debuggers rely on unsampled logs and metrics to pinpoint silent failures.
Databricks SQL Query Tags address a visibility gap in warehouse workloads: built-in logs identify users, warehouses, and tools, but not dashboards, projects, teams, or cost centers. Query Tags, now in Public Preview, attach multiple custom key-value pairs to each SQL execution, carry them into the Query History System Table, and expose them in the Query Profile UI. Partner integrations can automatically tag dbt models, while Power BI and Tableau support connection-level tags, and APIs and connectors support connection- or statement-level metadata. Users can also issue SET QUERY_TAGS in SQL Editor, notebooks, dashboards, or alerts to label subsequent session statements. These tags enable SQL or Genie queries for cost allocation, regression analysis, workload filtering, and environment comparisons; future plans include broader connector and workload support plus Query History search.
At Open House, ClickHouse announced three observability updates: ClickStack Cloud entered private preview, AI Notebooks entered beta for Managed ClickStack, and a ClickStack MCP server was introduced in open-source ClickStack. ClickStack Cloud is a fully managed, serverless platform that accepts OpenTelemetry data through a managed endpoint, while Managed ClickStack is generally available for teams controlling collectors, ingestion, compute sizing, schema design, and tuning. AI Notebooks provide a persistent, shareable investigation workspace in which prompts, queries, charts, reasoning steps, findings, branches, intermediate results, and generated queries remain visible and editable. The MCP server exposes the investigative tools used by Notebooks to external agents, routing requests through optimized searches, aggregations, and visualizations rather than relying entirely on ad hoc SQL generation; it can also persist findings in dashboards. Together, the announcements present a choice between managed convenience, operational control, and programmable observability workflows.
ClickStack Cloud is entering private preview as a fully managed, serverless observability service built on ClickHouse for teams that want ClickHouse-powered logs, metrics, and traces without operating the underlying infrastructure. Users send OpenTelemetry data to a managed OTLP endpoint, while the service handles ingestion, durable buffering through an object-storage-backed event queue, scaling, storage, and query serving, then exposes telemetry in the ClickStack UI with integrated authentication and RBAC. The preview separates ingestion and query resources and is developing automatic tuning based on query patterns, including materialized fields, primary-key adjustments, materialized views, and indexes. Dedicated query compute for agentic and high-volume analytical workloads is planned after the preview, while pricing remains unfinished and the existing Managed ClickStack offering remains intended for teams requiring direct infrastructure and schema control.
Integrating Sentry into systems already instrumented with OpenTelemetry does not require replacing existing backend SDKs or rewriting service instrumentation. A hybrid architecture pairs the Sentry SDK on the frontend for browser tracing, Session Replay, and logs with existing OpenTelemetry configurations across backend services. Frontend requests propagate W3C traceparent headers to backend endpoints, which then export traces and logs over OTLP directly to Sentry endpoints or through an intermediate OpenTelemetry Collector. Ingested telemetry attaches backend spans and standard Python logs to the initial frontend user actions, establishing a unified distributed trace across the entire request path. Although Sentry's OTLP ingest currently supports logs and traces rather than metrics, dedicated backend Sentry SDKs remain an optional addition later for backend exception tracking and profiling.
Software engineers frequently rely on separate product analytics tools and teams to answer user behavior questions, creating disjointed data models and delayed insights. Existing debugging telemetry within tools like Sentry—specifically spans, structured logs, and application metrics—can serve as the primary source for product metrics. Developers enrich request spans with business-level attributes, record discrete business events through wide structured logs, and track KPIs with metric counters and distributions. This unified telemetry links business outcomes directly to underlying traces, errors, releases, and source code lines, enabling immediate root-cause analysis and automated alerts. While multi-session cohort and funnel aggregation remains a current tooling gap, standard telemetry solves day-to-day adoption, performance, and revenue questions.
Databricks SQL Alerts is generally available as an automated alternative to manually checking dashboards and rerunning monitoring queries for business KPIs, pipeline health, and data quality. Teams define a SQL query, evaluation condition, schedule, and notification destinations, then receive alerts when results cross configured guardrails; standalone alerts can also run within Lakeflow Jobs. GA supports authoring in the SQL editor, notifications through email, Slack, PagerDuty, Microsoft Teams, or webhooks, and production management through Git, Declarative Automation Bundles, APIs, Terraform, and SDKs. The post’s revenue example compares yesterday’s result with a seven-day average and triggers when revenue_pct_change is below -5%, while the SQL Alert task can expose OK, TRIGGERED, or ERROR to downstream pipeline logic.
ClickStack's April release introduces several core enhancements across querying, alerting, and dashboard visualization capabilities. The platform added SQL-powered alerting, allowing teams to express complex statistical rules like rolling baselines and anomaly detection using native ClickHouse SQL and window functions without external pipelines. To improve search and filtering performance across common observability workloads, the default otel_logs schema was redesigned with ClickHouse text indexes and adjusted ordering keys. Furthermore, heatmaps transitioned into a first-class chart type inside the shared visualization system for latency distribution tracking. The update also delivers persistent alert execution error reporting, expanded threshold comparison operators, and per-series number formatting across dashboards.
Inside D. E. Shaw group, a global investment and technology development firm, millions of compute workloads run monthly across its high-performance computing infrastructure. To support capacity planning and resource allocation, it collects task-level metrics for requested and utilized compute, producing millions of distinct time series that its previous observability platform could not accommodate. Engineers benchmarked databases on identical hardware and datasets; ClickHouse ingested approximately 3.5 million samples per second on one node versus roughly 480,000 for a competing solution, while similar queries completed in seconds instead of timing out. They retained InfluxDB line protocol, batched messages into ClickHouse, and built disk-based tooling to transform and stream historical data; the resulting four-server NVMe cluster stores about 68 TB compressed and sustains 530k records per second on average. Materialized views support capacity-planning dashboards, while OpenTelemetry tracing extends the platform to other observability workloads, with SQL migration and data modeling requiring engineering effort.
Traditional time-series databases like Prometheus experience write amplification, memory overhead, and operational challenges when high-cardinality label combinations churn rapidly. ClickHouse alters these economics by abandoning dedicated series objects in favor of a wide events model, storing telemetry as rows in columnar tables with dynamic Map attributes and metric measurements. Dynamic attributes can be handled using sharded Map types alongside materialized columns and text indexes for frequently queried labels. This design trades ingestion overhead for query-time processing, relying on columnar compression, partition pruning, and parallel scans to compute aggregations on demand. ClickHouse avoids the ingest-side bottlenecks of high cardinality, though Prometheus remains preferable for moderate cardinality, native PromQL semantics, and single-series lookups.
Observability systems frequently encounter high cardinality when metrics contain numerous unique label combinations across multidimensional cloud infrastructure. In Prometheus, every unique label combination instantiates an independent time series that incurs metadata overhead, requires in-memory memSeries registration, and continually expands inverted index posting lists. The ingestion engine stores samples in two-hour Head blocks using compressed 120-sample chunks with XOR-based encodings, but rapid series creation and elevated scrape frequencies multiply chunk allocations and memory consumption. When executing read operations, broad aggregations and regular expressions require intersecting expansive posting lists and decoding entire chunks sequentially because the engine cannot push value predicates directly into compressed storage blocks. Consequently, managing high-cardinality workloads in series-oriented architectures forces operational trade-offs between system stability and granular visibility into ephemeral components.
Pre-configured monitoring templates often fail to meet organization-specific needs, forcing developers to manually build dashboards widget by widget. Sentry introduced AI-agent-powered dashboard creation and editing in open beta, alongside CLI management tooling and template revisions. Users can prompt an AI chat interface to build or adjust dashboards, duplicate and customize uneditable Sentry-built templates, or execute dashboard commands directly in their terminal. Dashboards leverage issue, tracing, and application metric data across frontend, backend, mobile, and framework-specific views like Next.js and Laravel. Edits made through the UI, CLI, or AI agent are automatically tracked in a revision history that supports one-click rollbacks.
ClickStack introduced SQL-based visualizations and SQL-based alerting to allow users to build charts and alerts using arbitrary ClickHouse SQL queries. Traditional query builders trade analytical flexibility for simplicity, preventing teams from easily expressing multi-stage computations like rolling baselines, anomaly detection, or dynamic SLO calculations. To maintain interactivity within dashboards, the system supports ClickHouse query parameters and macros that inject active time ranges, interval sizes, dashboard filters, and source tables. Furthermore, SQL-based alerting evaluates the numeric columns output by these queries, such as returning binary flags when values exceed statistical boundaries. By shifting computational logic directly into SQL, teams can implement complex operational checks without relying on static external thresholds.
AI-assisted software development often generates functional code that lacks proper instrumentation, leading to unindexed database queries, N+1 patterns, and fragmented connection strategies. While Supabase provides built-in query analytics, security advisors, and subsystem logs, it cannot trace distributed requests across the entire application stack. Integrating Sentry bridges this visibility gap by establishing distributed traces across Next.js frontends, Deno-based Supabase Edge Functions, and Postgres databases. Teams can forward Supabase logs into dedicated Sentry projects and configure runtime integrations to automatically detect performance bottlenecks such as slow spans and Web Vitals regressions. Furthermore, integrating Model Context Protocol servers allows Sentry's Seer debugger to identify root causes and generate automated fixes for emerging issues.
Unreal Engine games frequently experience performance issues such as frame-rate drops, hitches, and network degradation that do not register as application crashes. To address the lack of live production telemetry, the Sentry Unreal SDK introduces automatic performance metrics. The integration periodically samples frame times, network health, active UObject counts, physical memory usage, and garbage collection pause durations across desktop, console, and Android platforms. Telemetry entries attach contextual hardware and environment attributes alongside trace IDs to connect aggregate latency spikes directly to underlying traces and spans. Enabled by default in Unreal SDK version 1.11.0, this telemetry provides developers with fleet-wide visibility into hardware-specific bottlenecks across game releases.
ClickHouse Cloud introduced Query Insights in preview for Managed Postgres to help teams diagnose slow database queries. Powered by the open-source extension pg_stat_ch, the tool streams per-statement telemetry directly into ClickHouse to enable fast aggregations across billions of execution rows. Postgres normalizes query literals into placeholders during the parse-analyze phase before telemetry leaves the database, preventing sensitive data exposure. Telemetry emission maintains around three percent producer overhead by utilizing a non-blocking try-lock on a shared-memory ring buffer. Users can examine high-level database health metrics, rank query patterns by runtime or latency percentiles, and inspect execution flyouts detailing disk spills, cache hits, and parallel worker behavior.
The best engineering reads, once a week.