Accountability: Named Owner or Enforced Mechanism?
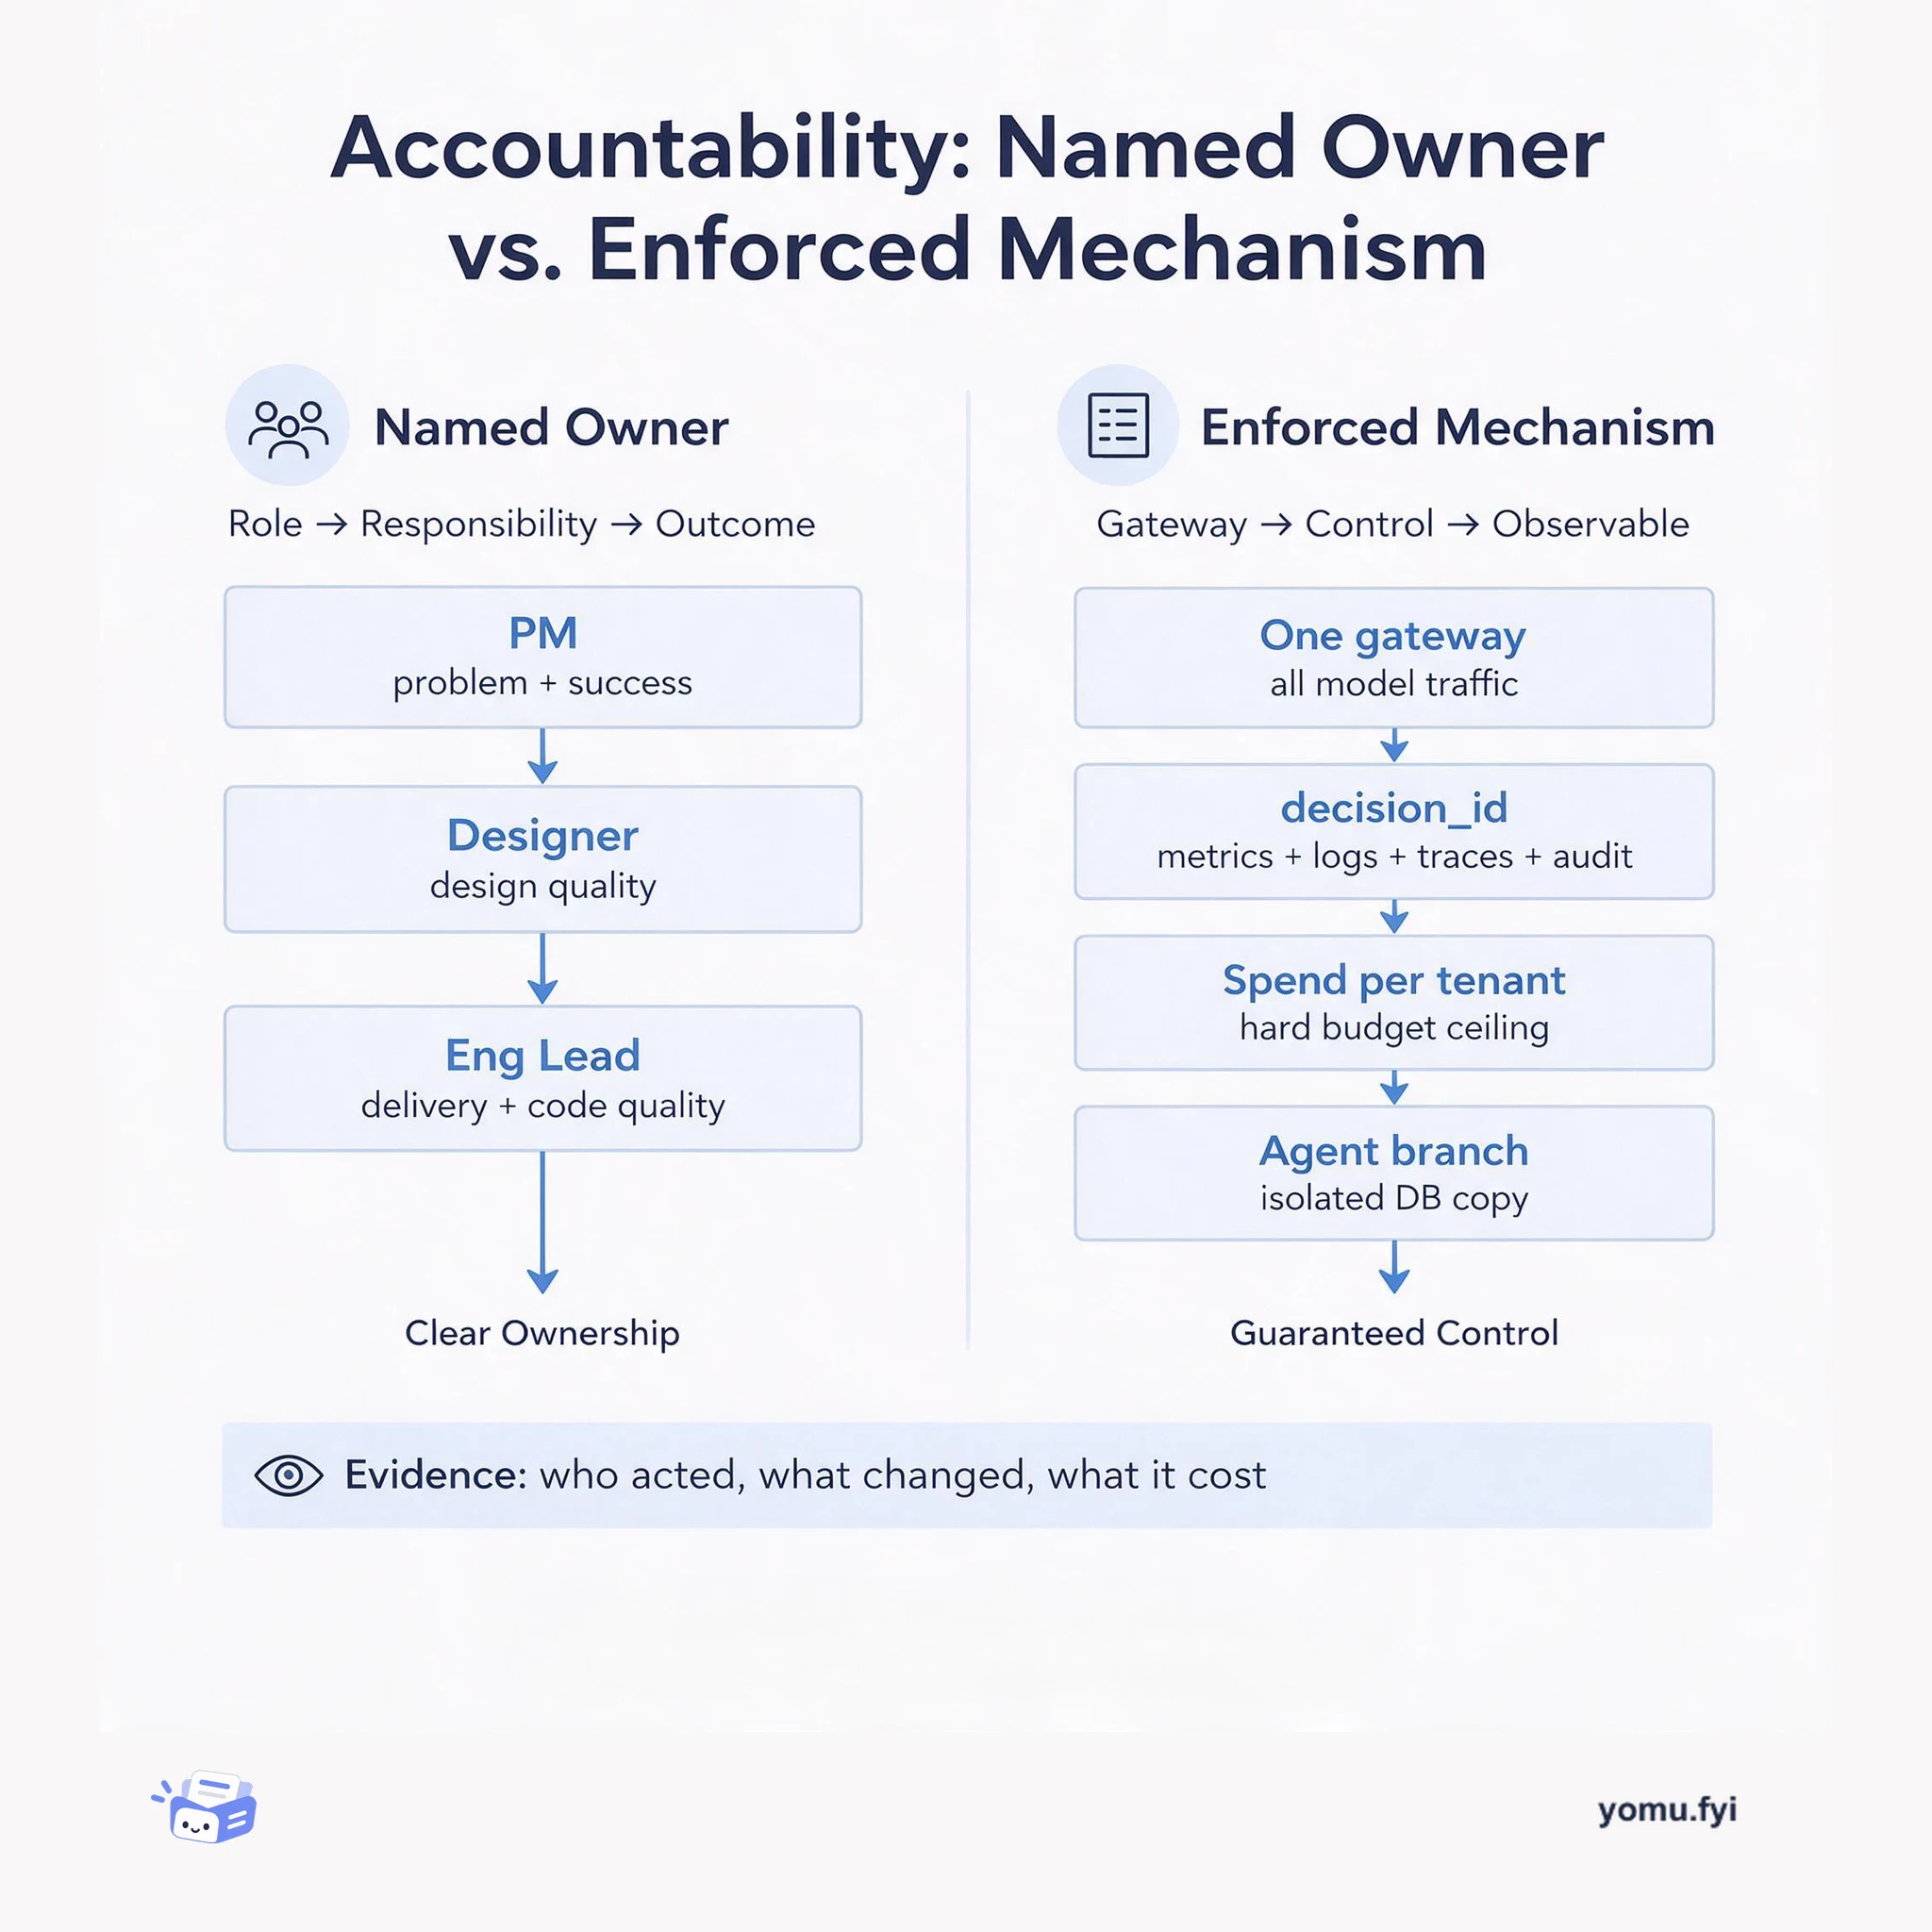
A side-by-side comparison of the two accountability models engineers actually rely on: a named human owner per outcome, and system-enforced traces, budgets, and isolation.
Loading…
Topic
248 posts about Observability. Every summary links to the original.
See the idea
A side-by-side comparison of the two accountability models engineers actually rely on: a named human owner per outcome, and system-enforced traces, budgets, and isolation.
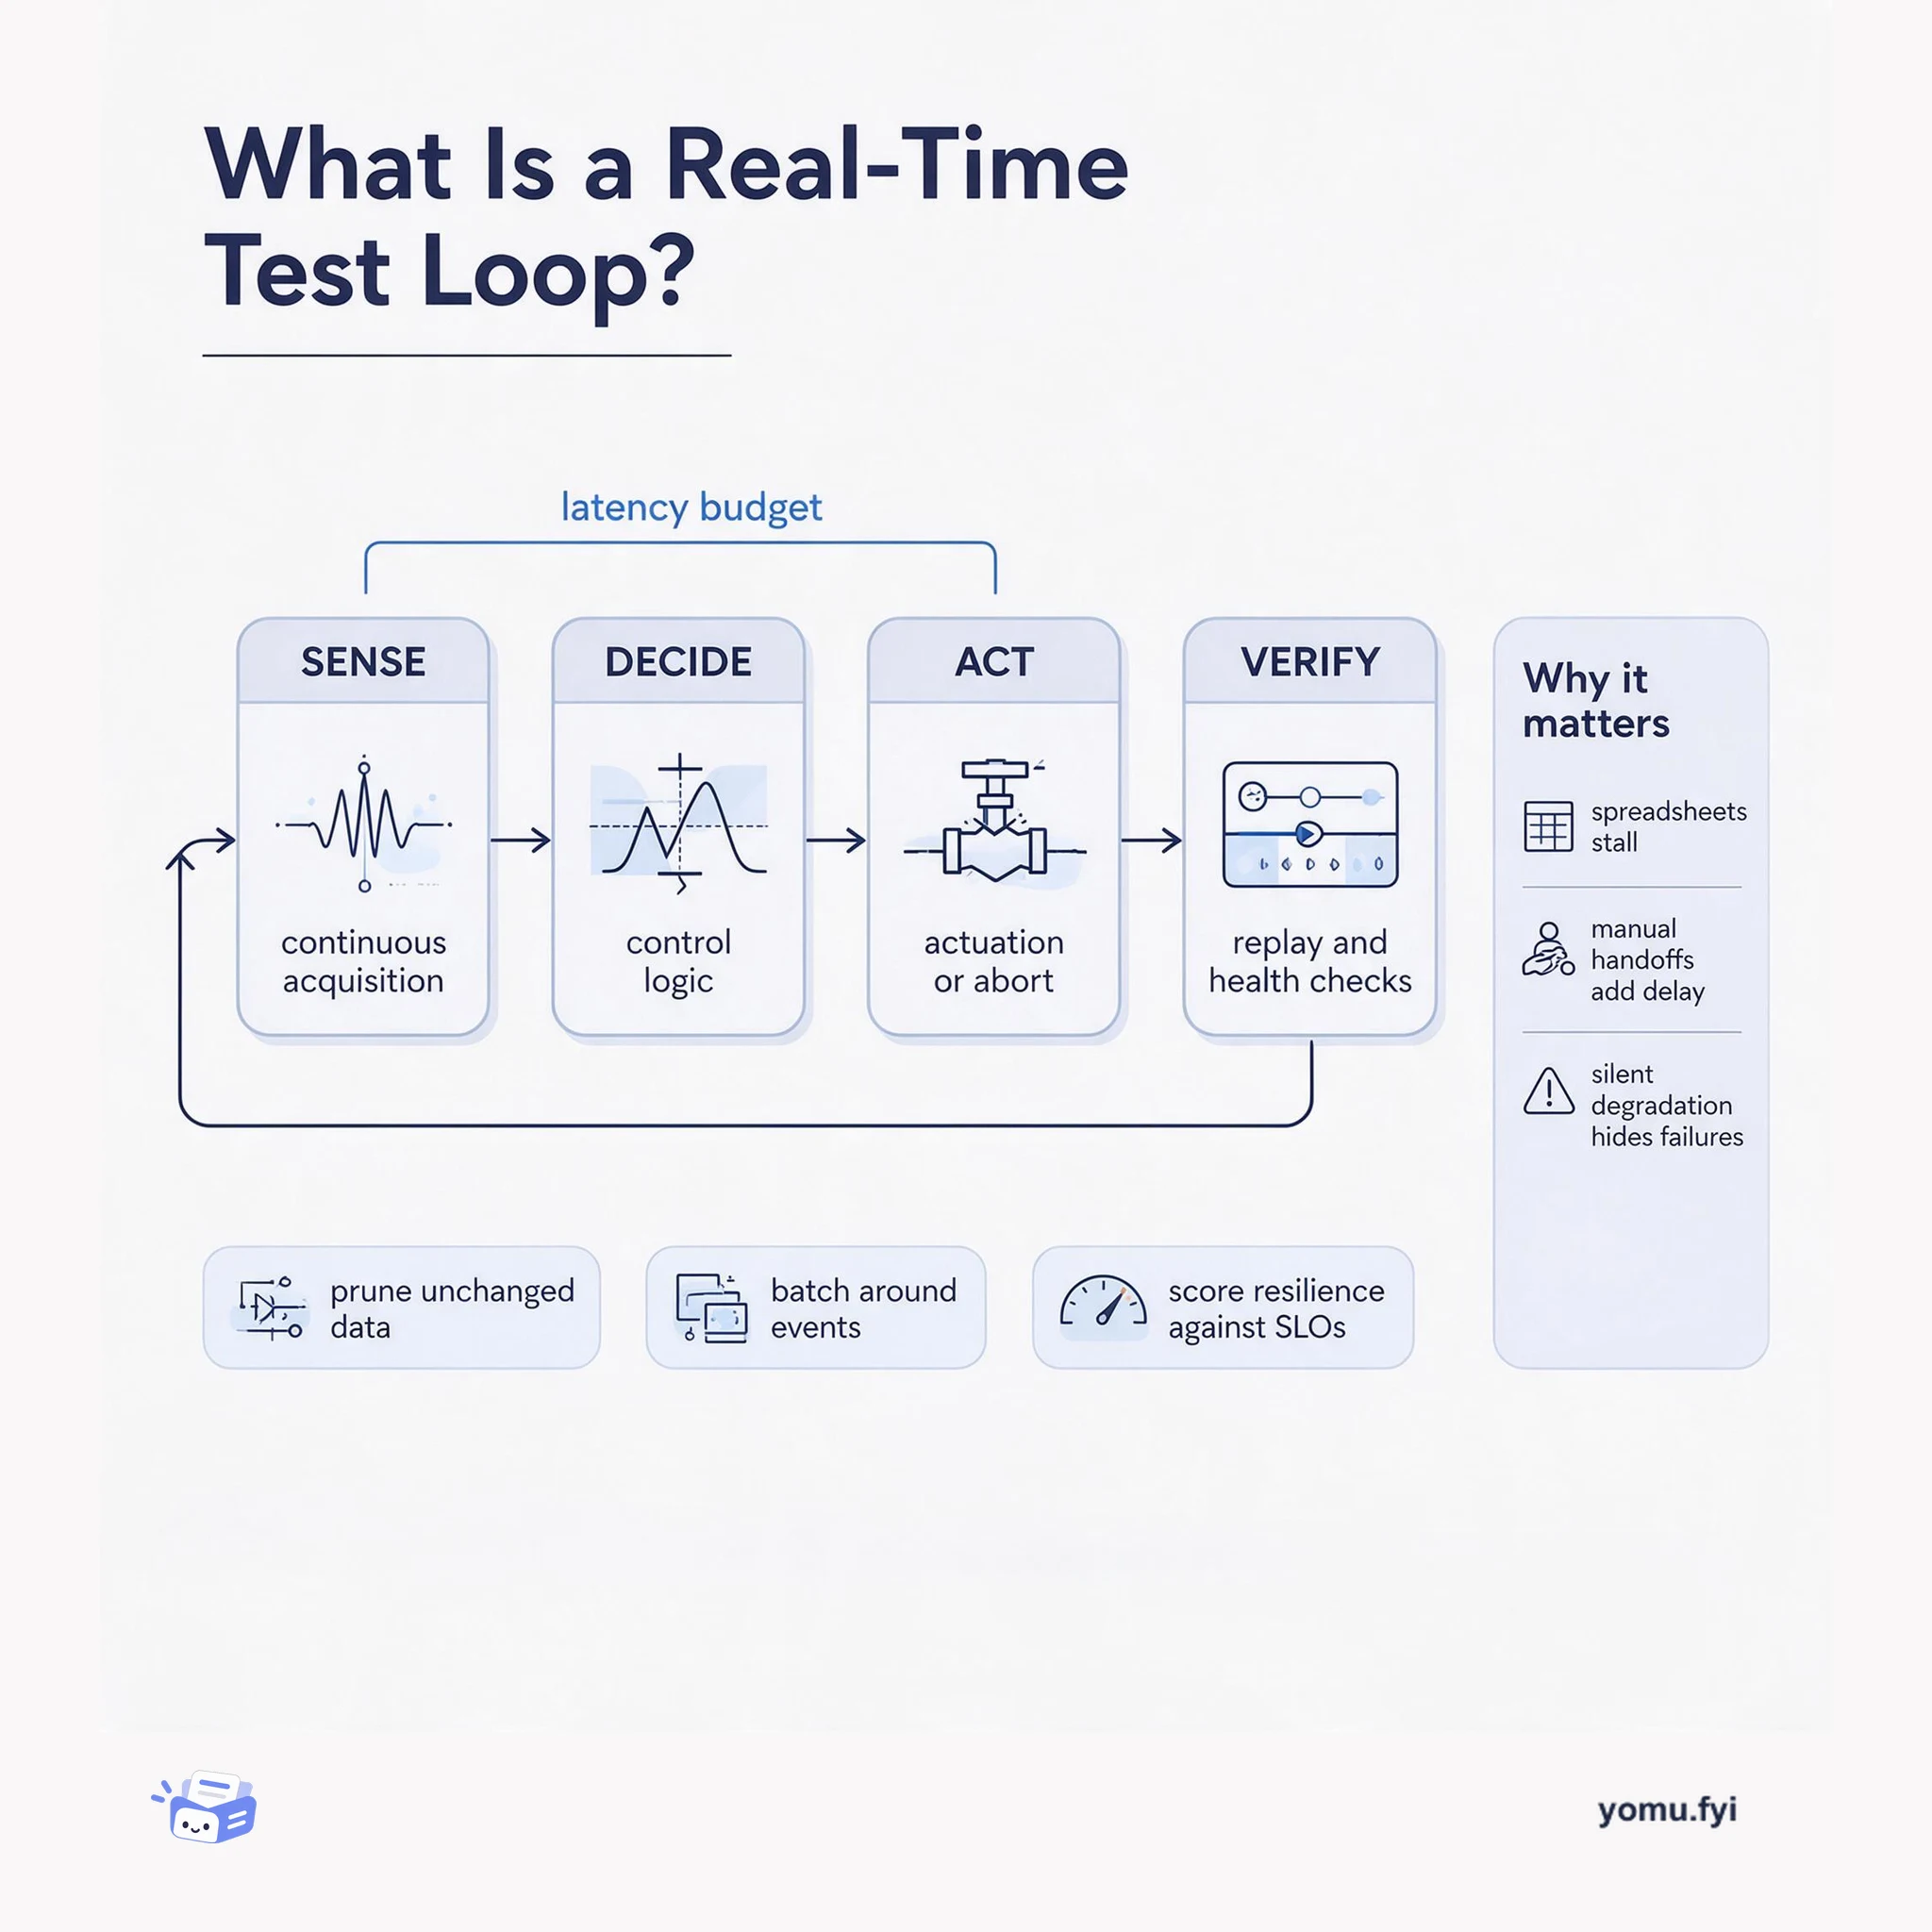
A real-time test loop is the closed path from sensor acquisition to control action and back to verification. This explainer maps its four parts and the latency budget that binds them.
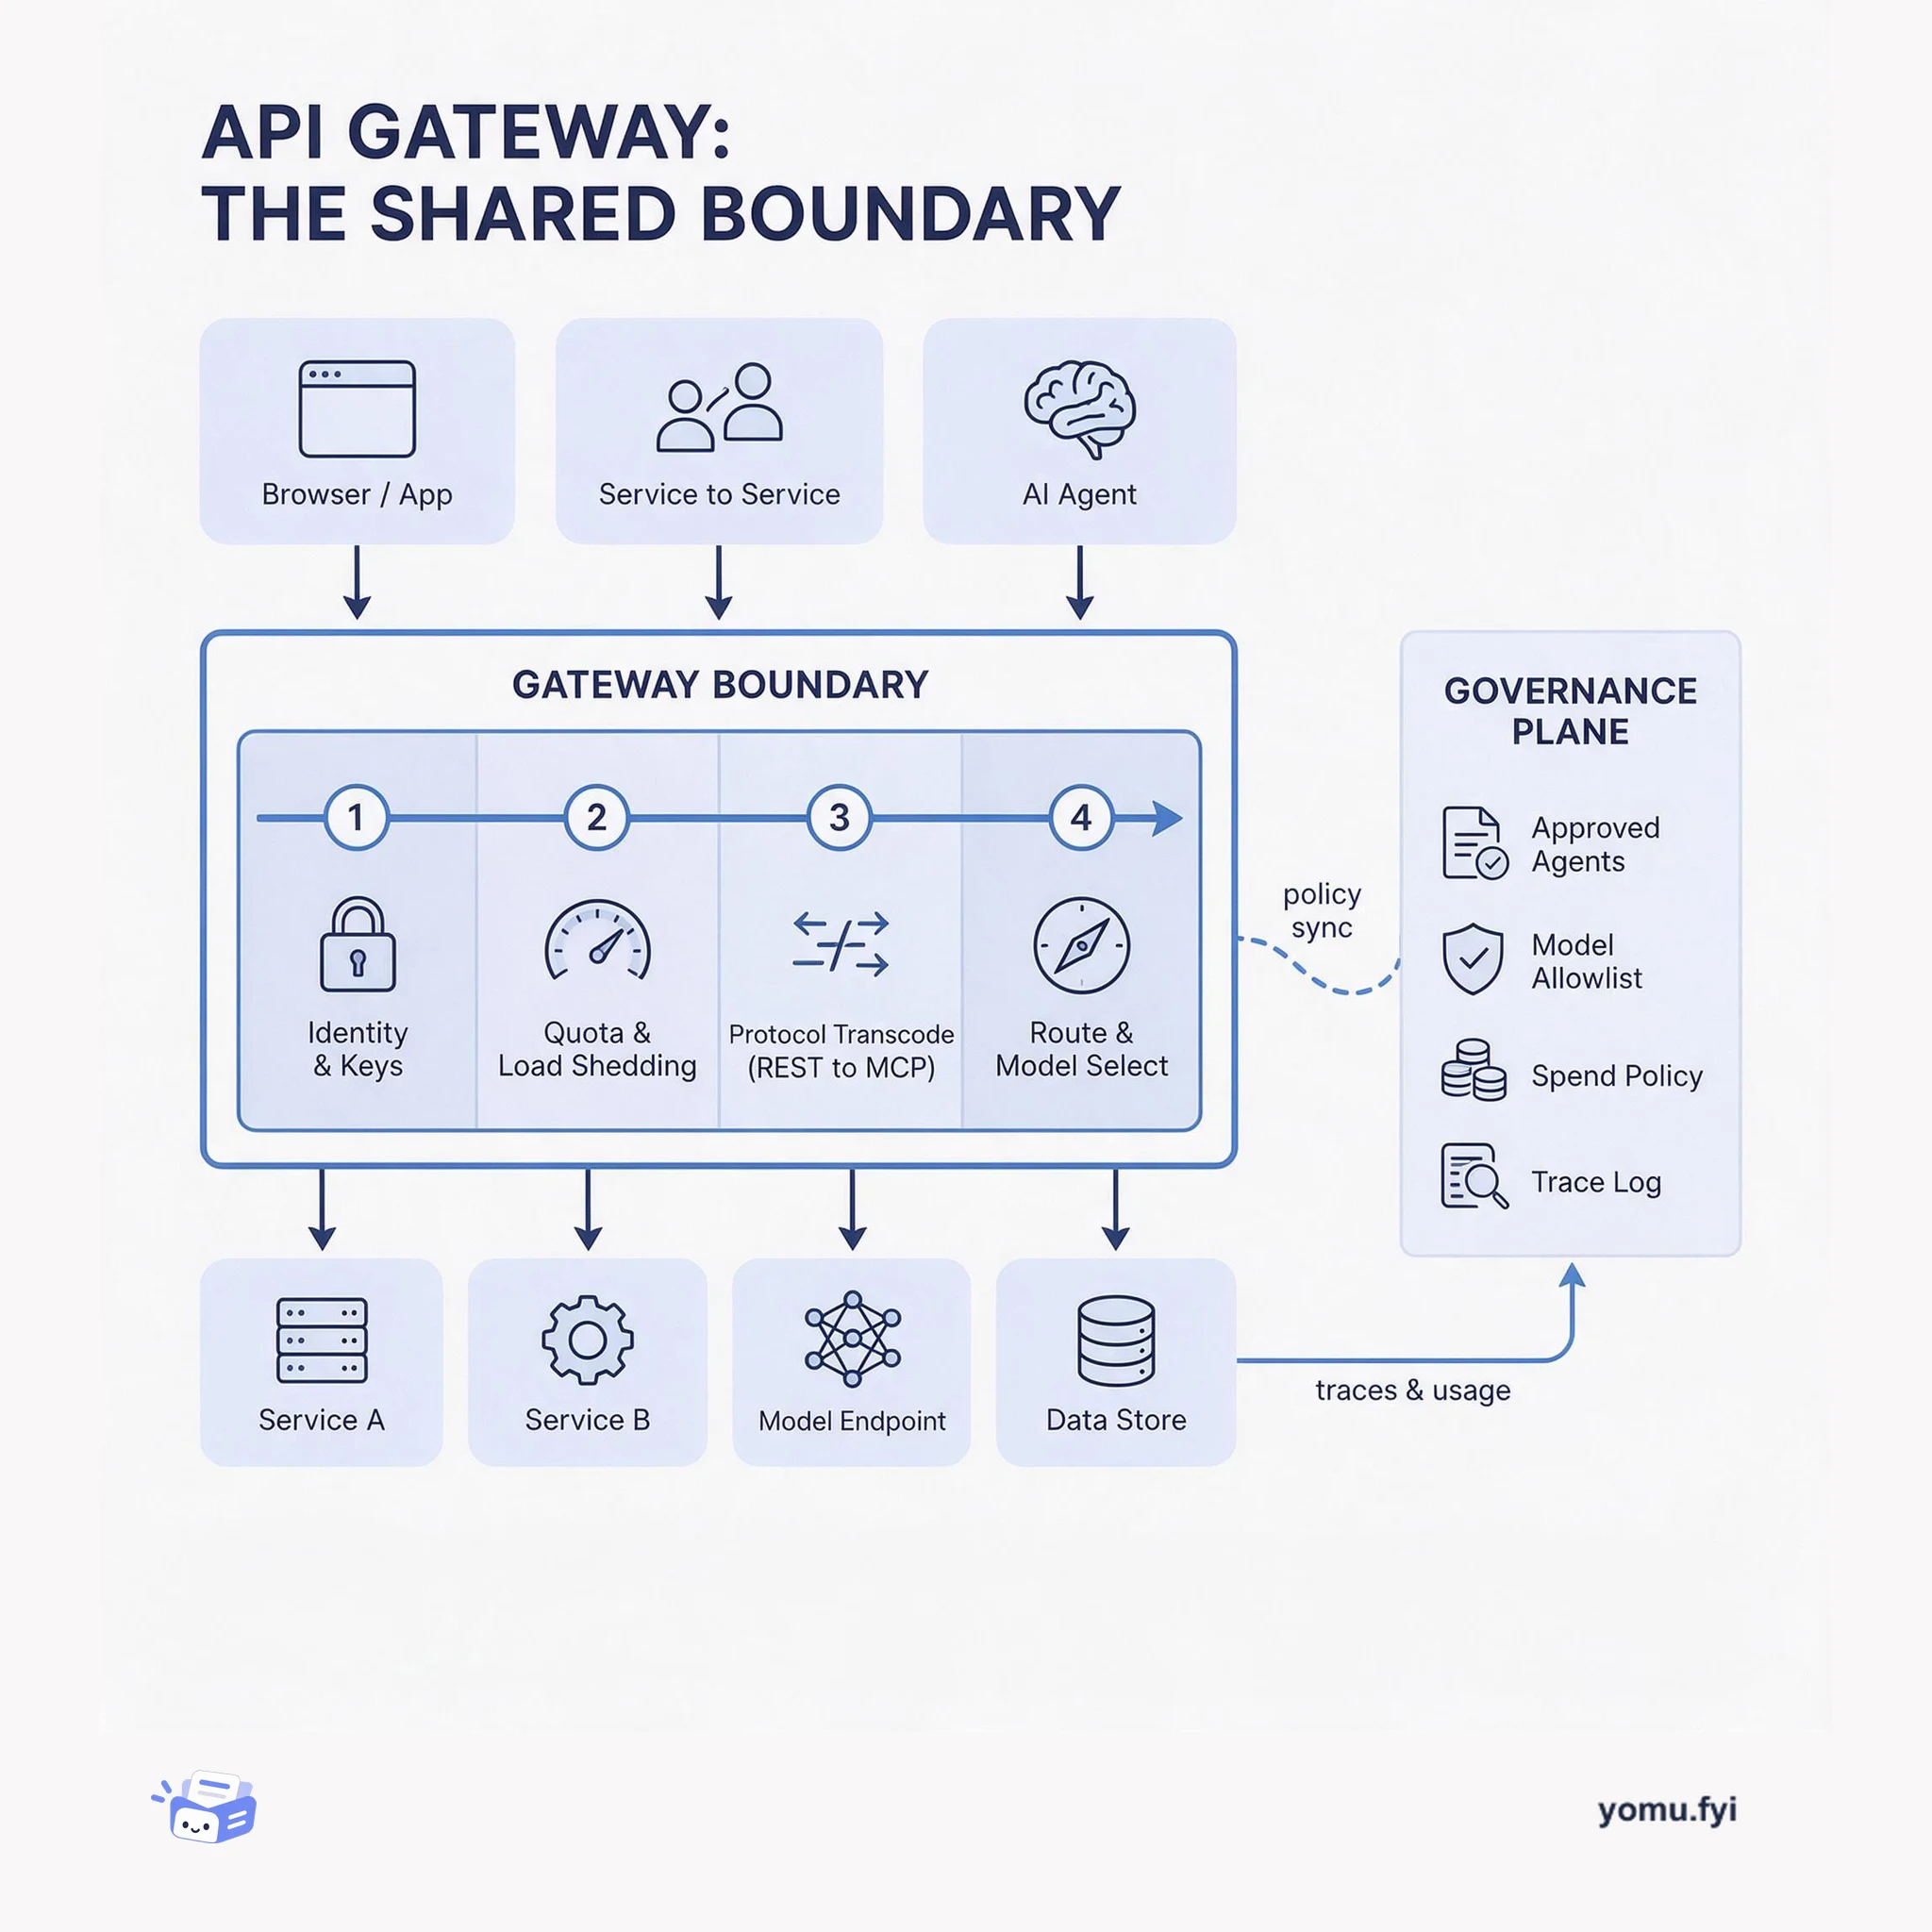
The API gateway is the single boundary where protocol translation, auth, quotas, and routing become shared policy instead of per-service code. This layered diagram shows what belongs there and why.
The Good Stuff
Paid picks we use ourselves. Links carry a referral code — a subscription through one earns us a commission at no extra cost to you.
Newest first
Grab's Trust, Identity, Safety, and Security team processes billions of daily rule and machine learning decisions for fraud detection, safety, and identity checks. Earlier logging approaches using plain text Kibana logs and the ActionTrace library lacked structured formats, dynamic entity customization, and fine-grained access controls. To resolve these limitations, the team built Archivist, a centralized tracing, statistics, and feedback system. Archivist ingests events through an SDK into Kafka streams, buffers and routes data into Elasticsearch indices and Amazon S3, and provides a role-based user portal. The platform handles 80 million daily logs across roughly 50 business scenarios, reducing scenario onboarding times from days to minutes.
Fly apps include built-in Prometheus instrumentation, exposing automatically collected metrics through a public Prometheus endpoint and allowing applications to export custom metrics. The walkthrough connects an organization’s Fly Prometheus URL to Grafana with a Fly token, then explains dashboard variables and PromQL queries using counters, gauges, histograms, labels, irate(), rate(), increase(), sum(), and regional grouping. Examples cover network traffic, TCP connections, HTTP response rates by region, and response-time heatmaps built from histogram buckets ranging from 5ms to 120s. Application instrumentation is shown for Go, Python Flask, and Node.js, with scraping configured in fly.toml through a metrics port and path. The post concludes that metrics are currently free, with some tier free forever, although a future pricing plan is expected for ambitious usage.
Fly describes the Prometheus-style metrics infrastructure behind its globally distributed micro-VM platform and explains why it favors metrics over traditional monitoring checks. The system collects counters and other measurements through HTTP /metrics endpoints, stores them in a clustered VictoriaMetrics (“Vicky”) deployment, and uses Telegraf, Vector, exporters, and Consul to connect sources and manage discovery. Within Firecracker instances, custom init, the Nomad driver, and a vsock carry node-exporter-type JSON statistics from guests for collection, while applications can expose their own exporters. Deployments can declare an exporter port and /metrics path in fly.toml, after which Fly routes those application metrics into Vicky alongside platform data. The resulting Prometheus API is available for Grafana queries, dashboards, and alerts, with labels such as app, region, host, and instance; the post argues that the same historical data supports anomaly detection, trending, and planning.
Android Vitals data revealed that 15.7% of Grab users had less than 1GB of free device storage and uninstalled the app at 1.2 times the normal rate. To understand on-device storage consumption, the team instrumented session launches using the Android StorageManager API to collect binary size, cache folder size, and total footprint metrics. Analysis showed unusually large cache sizes driven by orphaned cache folders from discontinued third-party libraries, including an image library replacement of Picasso by Glide. An automated cleanup routine deployed in app updates purged legacy cache directories upon launch. This mechanism reclaimed 575 terabytes of junk data across more than 13 million devices, averaging 40MB per user.
Grab redesigned its backend logging approach to address mounting vendor costs, query language limitations, and debugging difficulties across a growing microservices ecosystem. Most services previously emitted syslog-style key-value logs almost entirely at the INFO level, which made volume reduction difficult and lacked causal ordering and automated correlation. The engineering team migrated to a self-managed Elastic stack backend and built a structured logging library in Go from the ground up. This framework introduces dynamic log-level adjustment at runtime, automatic trace-based log correlation via Grab-Kit, and the Common Grab Log Schema to enforce consistent JSON formatting without Elasticsearch indexing conflicts.
Grab experienced intermittent HTTP 5XX alerts when its Gothena service sent driver location updates to the Astrolabe service through an AWS Elastic Load Balancer (ELB). CloudWatch metrics revealed that requests were failing to reach healthy backend instances because of an uneven load distribution favoring a single ELB node in one Availability Zone. The team verified that Route 53 was properly using Alias records and ruled out OS-level DNS caching since Linux does not cache DNS queries by default. Connection inspection with netstat across multiple Go services confirmed a heavily skewed distribution of connections toward specific ELB IP addresses. Comparative tests with cURL, tcpdump, Go, Python, and Ruby in an isolated environment demonstrated that Go reused connections across requests while other runtimes opened new connections per request.
Datadog dashboards for the grab_attention cluster displayed periodic 1.5X step increases in Elastic Load Balancer (ELB) health check requests and ElastiCache Redis connections, creating the illusion of an untracked instance running outside Auto Scaling Group records. Inspecting instance hostname tags revealed that the existing two instances were simply receiving elevated ping counts from the load balancers. AWS Support clarified that ELB scaling events provision new nodes while keeping old nodes running for roughly 90 minutes to handle cached DNS clients. Investigation also revealed that two separate ELBs were attached to the cluster, altering expected request baselines. Furthermore, the application's health check endpoint initiated a non-pooled Redis connection on every request, directly translating load balancer pings into database connection spikes.
Heroku’s internal components use logfmt to capture production activity, enabling retrospective request analysis, flexible trace queries, historical metrics, and incident investigation. The format can also become an unreadable 51-page wall of text, motivating hutils, a small suite of tools installable through Rubygems for exploring structured log data. Its ltap command extracts message streams from Splunk or Papertrail using a search query, while lviz parses messages into a tree that groups common key/value nodes and reduces duplicate data; the tools are designed to chain together. Additional commands include lcut for selecting fields and lfmt for colorized, whitespace-enhanced formatting, with both also supporting heroku logs --tail.
The best engineering reads, once a week.