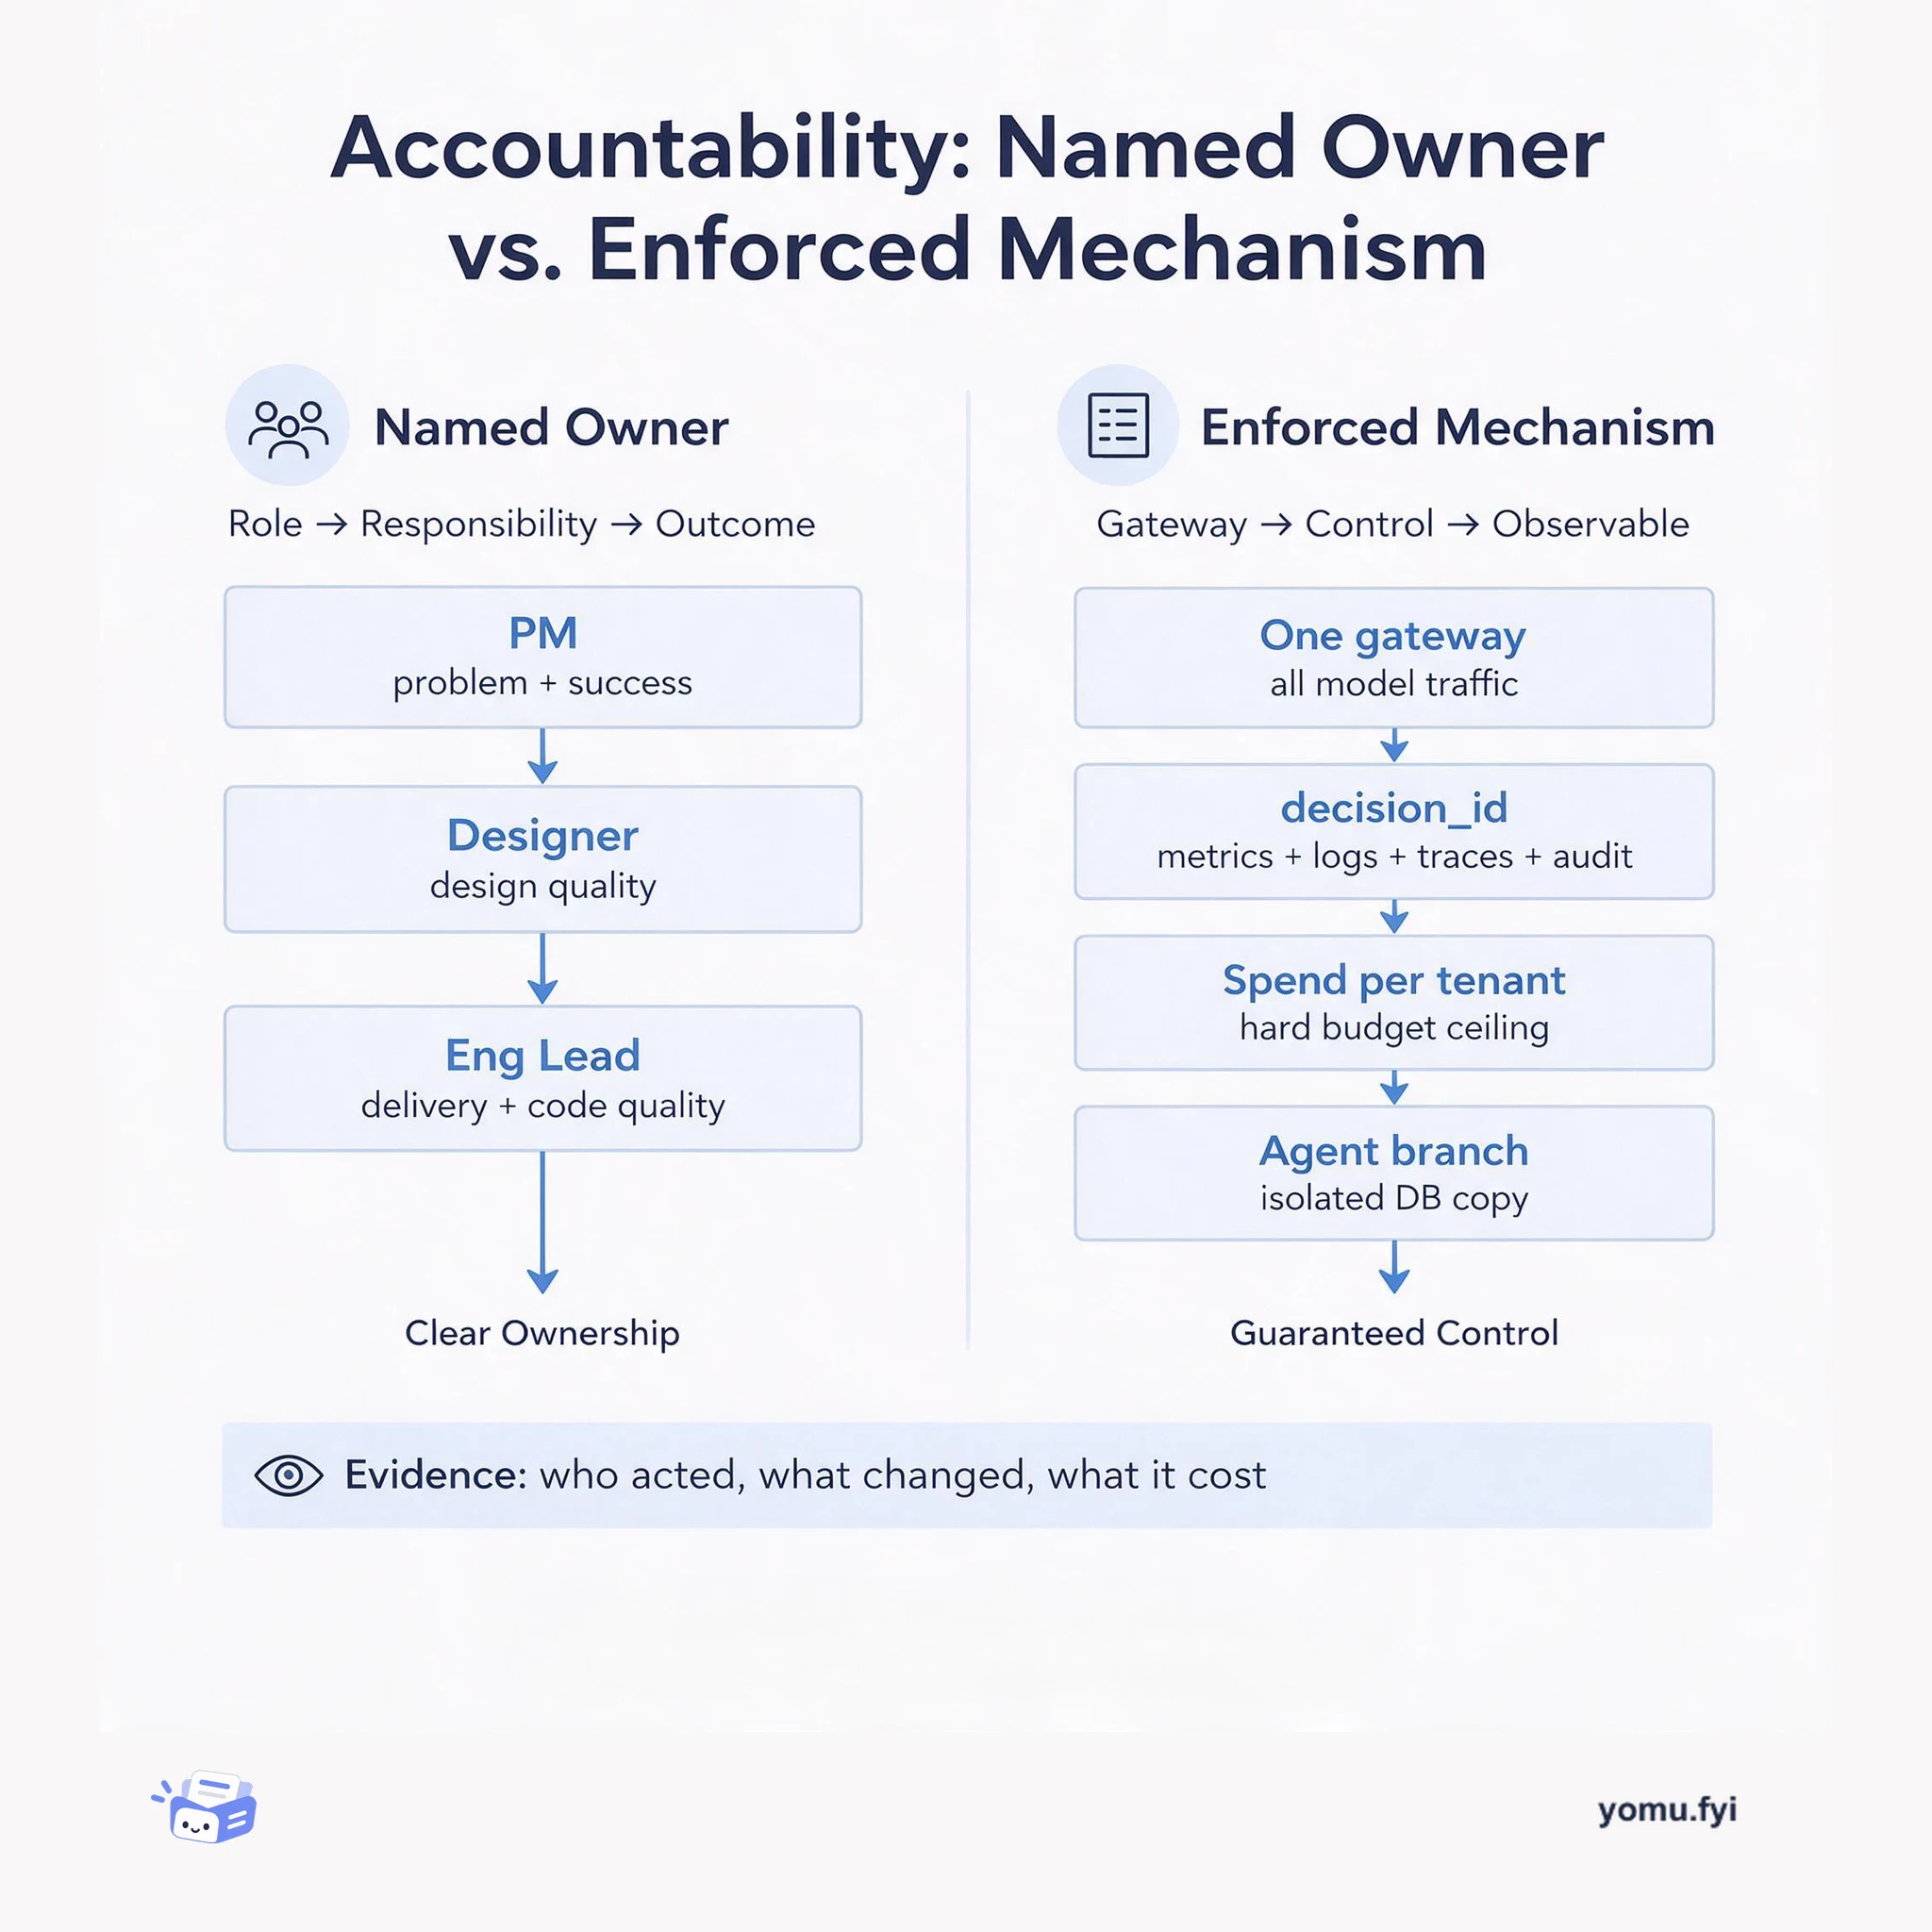
Accountability: Named Owner or Enforced Mechanism?
A side-by-side comparison of the two accountability models engineers actually rely on: a named human owner per outcome, and system-enforced traces, budgets, and isolation.
Loading…
Topic
250 posts about Observability. Every summary links to the original.
See the idea
A side-by-side comparison of the two accountability models engineers actually rely on: a named human owner per outcome, and system-enforced traces, budgets, and isolation.
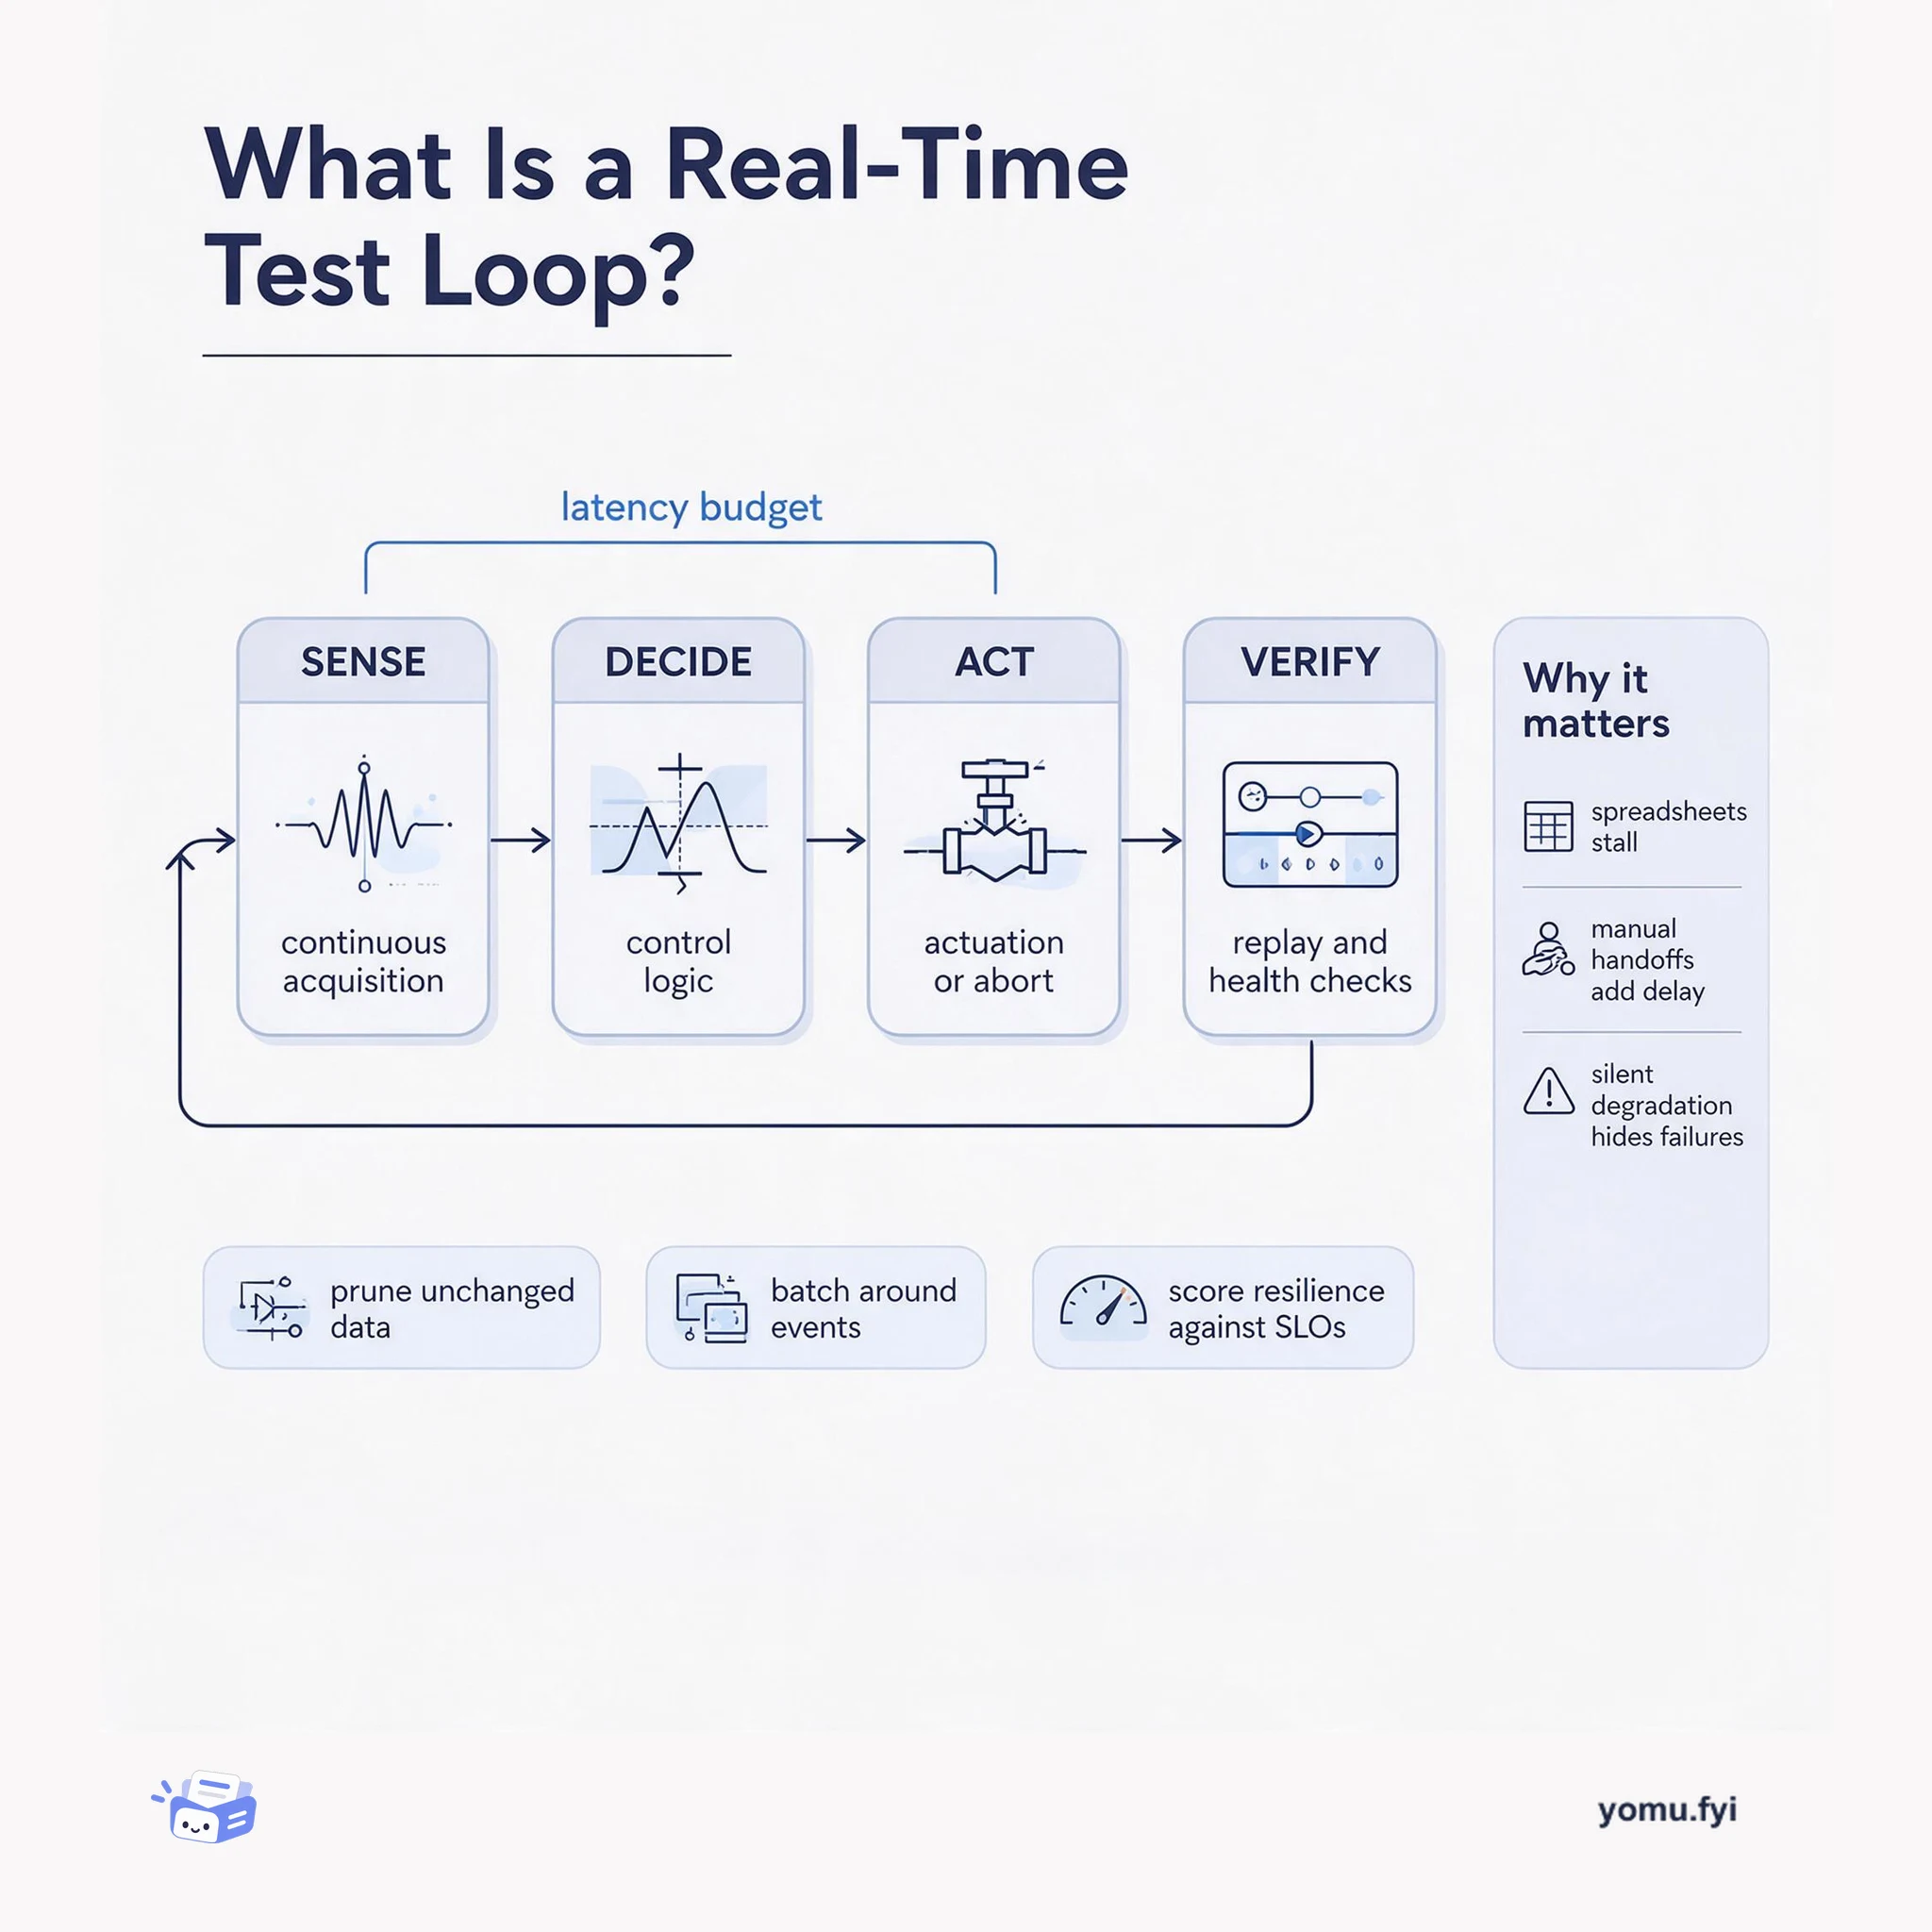
A real-time test loop is the closed path from sensor acquisition to control action and back to verification. This explainer maps its four parts and the latency budget that binds them.
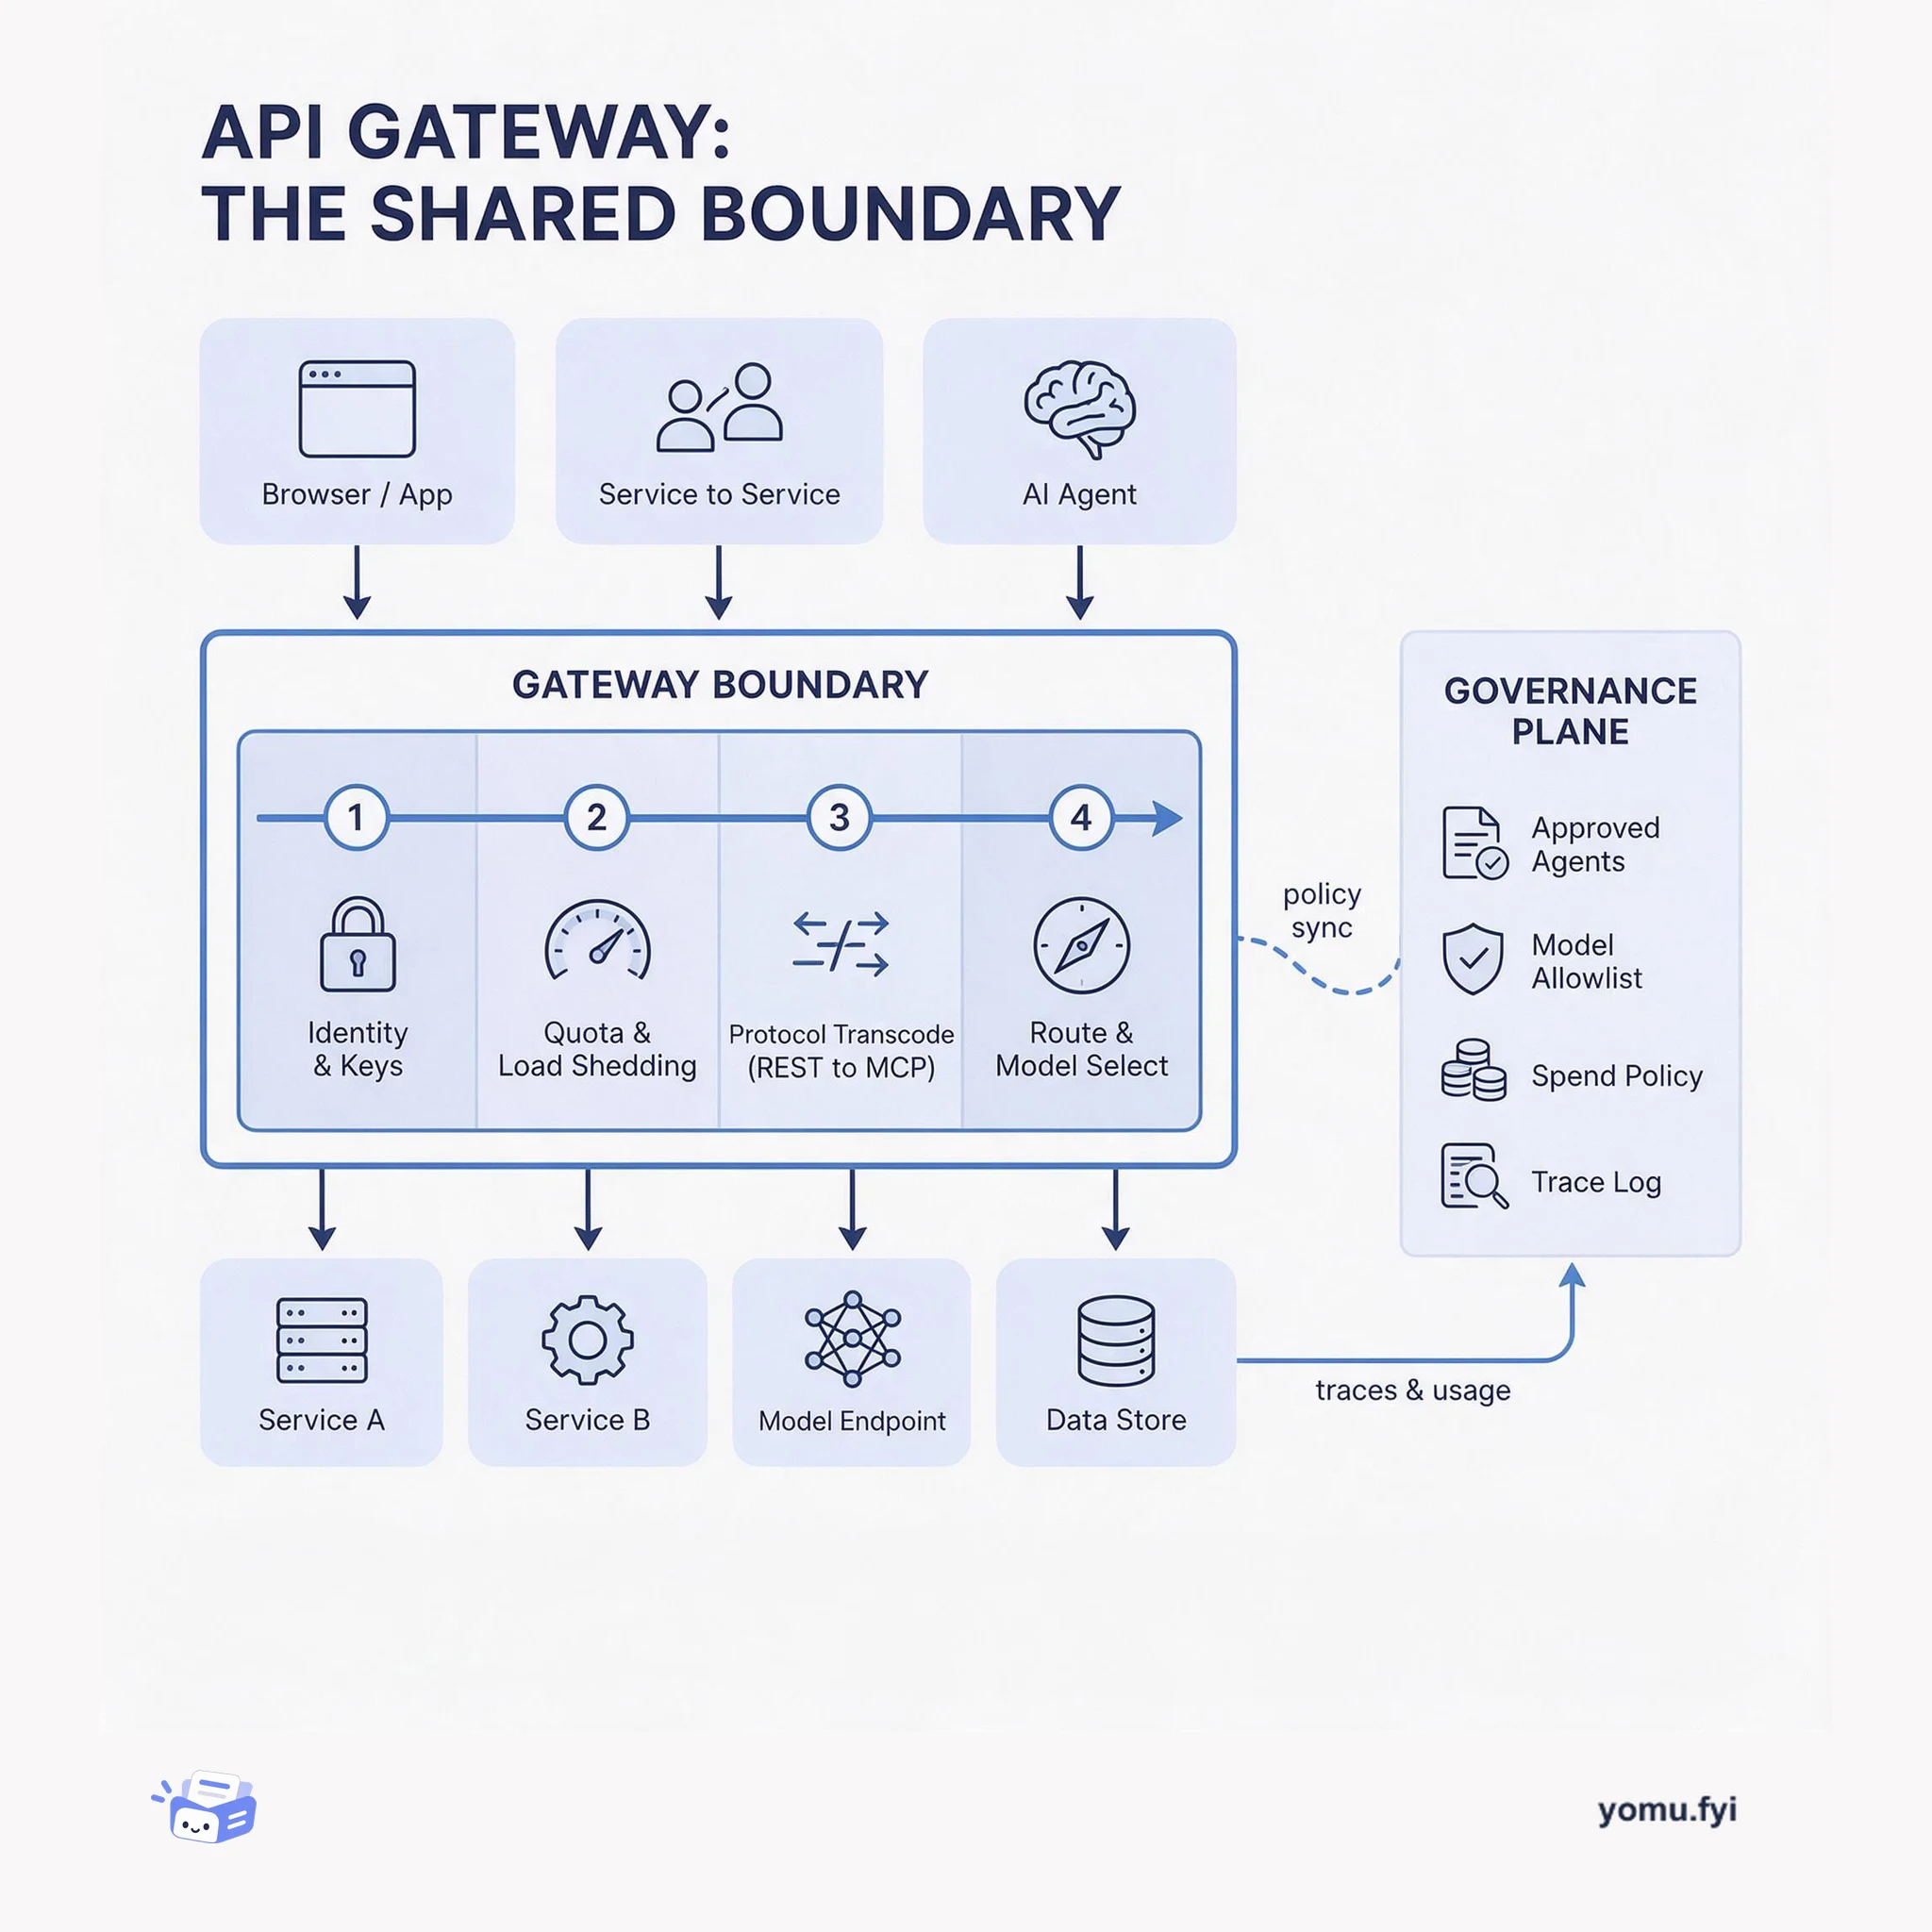
The API gateway is the single boundary where protocol translation, auth, quotas, and routing become shared policy instead of per-service code. This layered diagram shows what belongs there and why.
The Good Stuff
Paid picks we use ourselves. Links carry a referral code — a subscription through one earns us a commission at no extra cost to you.
Newest first
The post demonstrates how to debug and fix Stripe Invoicing integration errors with Workbench, a context-aware tool available throughout the Stripe Dashboard. It uses the Overview and Errors tabs to locate a recent parameter_missing error, then examines the failed Invoice create request and identifies the missing Customer object that prevented invoice creation. The Shell and API Explorer let developers list customers, supply a Customer ID, construct and run the corrected create command, and generate an SDK request from the configured fields. Workbench’s Inspector then exposes the invoice’s JSON data map, logs, and lifecycle events; the example confirms successful payment for a zero-dollar invoice and explains that non-zero charges require Invoice Items tied to products and prices.
Stripe Invoicing’s no-code workflow hides the API calls and invoice state transitions that developers may need to inspect when debugging payment failures. Using Stripe Workbench’s Inspector, Logs, and Events tabs, the walkthrough maps object hierarchies, requests, event payloads, and previous_attributes across an invoice lifecycle. Creating an invoice in the Dashboard produces a draft Invoice, a separate Invoice Item, an automatically generated Invoice Line Item, and related creation or update events. Sending it creates a Payment Intent and finalizes the invoice from draft to open; charging captures the Payment Intent, creates a Charge, and changes the invoice to paid. Draft invoices can be deleted, while open invoices can be voided, preserving the record and canceling the Payment Intent, and the same Workbench method can be applied to other Stripe API areas.
Stripe payment methods differ in how quickly they confirm attempted payments, with cards reporting status immediately and bank debits, bank transfers, and cash-based vouchers requiring additional processing time. The post uses Stripe Workbench and its in-browser CLI shell to create Checkout sessions in test mode, submit card and ACH Direct Debit payments, and inspect emitted events. For cards, charge.succeeded and payment_intent.succeeded signal successful payment, while integration code must inspect checkout.session.completed payment_status rather than confuse it with the session status. With delayed methods, checkout.session.completed can show unpaid before checkout.session.async_payment_succeeded or checkout.session.async_payment_failed arrives; the former changes payment_status to paid, and production processing can take days.
Mae Santos, Head of Critical Applications and Data Reliability Engineering at Two Sigma, leads a global team across New York, Houston, London, and Tokyo to support critical applications and data pipelines. While software teams frequently prioritize functional features over operational stability, designing systems with reliability in mind from the beginning allows for progressive enhancements without complete rewrites. System architecture should be guided by concrete goals across four key dimensions: availability, observability, scalability, and supportability. In addition, mapping out interconnections among systems, infrastructure, data, and human processes helps teams manage dependencies effectively. Applying automation across support and delivery workflows further reinforces reliability by minimizing human error and accelerating execution.
Grab's in-house risk management platform, GrabDefence, relies on ingesting large volumes of upstream data to drive real-time heuristic rules and data science models. To prevent data discrepancies and missing information from degrading fraud detection, the team implemented a real-time data observability pipeline. The solution uses Apache Flink SQL alongside custom table functions like JSONEXPLOAD to flatten nested JSON structures and aggregate metrics over 5-minute tumbling windows. Processed metrics are sent to Datadog, where counters are grouped by source stream and evaluated using anomaly detection algorithms. Alerts are routed directly to Slack, reducing anomaly detection latency from days or weeks down to within the same day or hour.
Standard infrastructure monitoring tools track CPU and memory usage at the host or container level, obscuring the precise resource consumption of individual Spark jobs on shared instances. To achieve granular observability, the Iris platform gathers job metrics directly at the Java Virtual Machine level without requiring changes to user application code. Data collection relies on Uber's JVM Profiler for deep JVM, thread, and memory pool diagnostics alongside sparkMeasure for stage and task execution statistics. Collected metrics route asynchronously through an Apache Kafka queue to avoid execution bottlenecks, feeding a Telegraf, InfluxDB, and Grafana stack for real-time monitoring while archiving to a data lake for offline analytics. This multi-tiered telemetry enables engineering teams to identify over- or under-provisioned jobs and optimize ETL resource allocations.
Upgrading to Xcode 13.1 introduced severe CI test instability and high CPU utilisation for Grab's iOS development team. To address this, the team integrated observability tools across their UITest pipeline to pinpoint performance bottlenecks and test flakiness. Interventions included isolating spotlight.app to curb CPU spikes, replacing Safari with a mock browser for deep link tests, and booting simulators with pre-granted permissions. The team also built custom network tracking tools to enforce resource mocking and transitioned tests away from arbitrary sleep commands to explicit wait wrappers. These combined changes cut CI runtimes, decreased CPU utilisation by over 50%, and stabilized automated test executions.
Supabase is releasing Supabase Logs for self-hosted users and CLI development, built around Logflare, which processes more than 1 billion log events daily from Supabase services. Logflare is a multi-node, highly available Elixir cluster that ingests events through Vector or native integrations, streams them to BigQuery, and exposes SQL-backed HTTP Endpoints for Studio, Logs Explorer, and usage charts. Endpoints support parameterized queries, in-memory read-through caching, configurable cache warming, and select-only query sandboxing, allowing views over billions of daily events without querying many terabytes on every request. The release changes Logflare’s license to Apache 2.0, replaces closed-source SQL parsing with rust-based sqlparser-rs, and improves environment-based configuration for self-hosting; BigQuery is currently the supported backend, with more planned.
Shipping Logs describes how Fly.io application stdout moves through the platform and how to centralize and retain it beyond Fly.io’s log lifetime. Apps run in Firecracker VMs, where an injected Rust init process captures stdout and sends it through host-side Go code to Vector, which publishes the logs to an internal NATS cluster; Flaps limits access to an organization’s logs. The Fly Log Shipper runs Vector as a NATS client and forwards organization-wide streams to a configured sink such as Logtail, Loki, Datadog, or Cloudwatch, using secrets for provider credentials. Deployment involves launching the image, removing the generated services section, adding an internal port, and running fly deploy. A SUBJECT environment variable can narrow collection with NATS subjects such as logs.sandwich.>, covering an app across regions and instances.
Nextdoor deploys weekly mobile updates across iOS and Android using phased rollouts starting at 1% adoption to minimize blast radius. Standard aggregate observability cannot reliably detect early regressions because early adopters skew significantly more active than average users, obscuring silent drops in overall metric noise. To overcome this selection bias, Nextdoor built App Release Anomaly Detection using difference-in-differences causal inference. The methodology verifies pre-adoption trends with standard deviation bounds and fits a linear regression model to estimate the effect against an unobserved counterfactual. During a rollout of iOS version v1.234.5, this model identified a statistically significant app session decline at 1% adoption, isolating the regression 10 days earlier than week-over-week metrics.
Oxygen is Shopify’s hosting counterpart for Hydrogen custom storefronts, designed to provide globally available, fast storefronts with secure Shopify integration without additional third-party hosting costs. Its architecture combines GitHub and GitHub Actions with Cloudflare Workers and edge distribution, Shopify CDN, Admin API, Identity and Access Management, and Oxygen-scoped developer tooling and observability. Requests pass through a Gateway Worker, which validates authorization for the shop and storefront version before using Cloudflare’s Dynamic Dispatch API to route traffic to a Storefront Worker running Hydrogen code. Rather than build proprietary infrastructure, Shopify reused Cloudflare’s worker platform to reduce upfront complexity, scale, and security risks, while its observability stack uses Grafana, Cortex, Loki, and Tempo. Oxygen is used in production by Allbirds, Shopify Supply, Shopify Hardware, and Denim Tears, and is generally available to Plus merchants.
fly-proxy, a Rust-based proxy, leaked memory because its obsolete custom HoneycombLayer retained child spans under a long-lived parent span. The post follows a request from browser input through DNS, TCP, TLS, HTTP/2, and asynchronous Rust components including an aya-built eBPF program, tokio, hyper, and tracing, before explaining how the leak surfaced. In the custom layer, every closed child span was added to its parent’s collection, so each request consumed a small amount of memory while a high-level async task remained alive. Removing that legacy code fixed the primary problem: memory usage barely exceeded 50MB during a load test, while remaining growth came from queues and latency data retained for processing rather than the identified leak.
Shopify needed a maintainable way to connect increasingly modular business systems whose interfaces ranged from SOAP and FTP to REST and GraphQL. The company evaluated Mulesoft but found that its proprietary XML and Java virtual machine stack isolated the team from Shopify’s development ecosystem and complicated access to internal services and infrastructure. It instead built a Ruby on Rails integration platform around minimal validation, transparent data transformations, flexible client support, security, reusable components, documentation, and request-level testing with WebMock. The implementation favors direct manipulation of JSON hashes because that keeps mappings visible, while acknowledging risks such as typos and complex mock management. After a year, the platform had 18 integrations, had migrated all Mulesoft applications, and enabled other teams to build integrations, with ongoing work on testing and onboarding.
Shopify had more than six traffic paths for its core, services, PII-restricted systems, and mTLS-authenticated APIs, making platform-wide features harder to deploy and traffic behavior harder to observe. Möbius and Shopify Front End (SFE) were designed together: Möbius terminates TCP and TLS near clients and forwards requests to SFE, while SFE routes them from regional clusters to application clusters. SFE uses nginx deployments with custom Lua and a centralized API fed by Kubernetes controllers, enabling routing and active/active or active/passive load balancing without DNS TTL delays. Möbius automates edge domain configuration, DNS ownership validation, and certificate acquisition through vendor APIs, so application owners generally only need to change DNS. The unified design standardizes edge protection and observability, supports future edge capabilities, and leaves exceptions for services whose dependencies could create crash loops.
Supabase announced several major platform updates for March 2022, introducing global edge deployments for JavaScript and TypeScript functions developed and tested locally. Database querying expanded to support GraphQL through an open-source, portable Postgres extension. Supabase Realtime received support for multiplayer and presence to enable collaborative applications, alongside enterprise and scale capabilities including Point-In-Time-Recovery, SLAs, premium support, a Prometheus endpoint, and an observability dashboard. To enhance security, an integration with GitHub secret scanning automatically notifies developers and rolls exposed service_role keys found in public repositories. Additional updates include the PostgREST 10 pre-release, Next-JS auth helpers, new OAuth providers, and full remote hiring across engineering, marketing, and human resources.
Supabase launched Edge Functions to execute TypeScript code close to end-users across more than 30 data centers. Built on the secure-by-default Deno runtime and hosted via Deno Deploy, the feature offers fast start-ups, scale-to-zero pricing, and native support for npm modules and Node built-in APIs. Incoming requests first reach an API gateway called Relay, which authenticates JSON Web Tokens, handles rate-limiting, and forwards requests using a Deployment ID to Deno Deploy. Observability is handled through Logflare to feed structured logs and metrics directly into the Supabase Dashboard. To mitigate abuse risks experienced during earlier product rollouts, invocations are currently limited to POST requests rather than general website hosting.
Supabase announced the launch of its Enterprise Plan alongside new features integrated across existing tiers. The Pro Plan now merges pay-as-you-go billing with a default twenty-five dollar monthly spend cap, and users gain access to self-serve database add-ons for on-demand scaling. A new Log Explorer powered by the Logflare acquisition allows querying logs directly with SQL, providing ninety days of retention on the Enterprise tier. Dedicated enterprise capabilities include Point-in-Time Recovery powered by the open-source tool WAL-G, custom Prometheus scraping endpoints for observability, and guaranteed support service level agreements. Additionally, Supabase achieved SOC2 Type 1 compliance and introduced Elixir Livebooks to monitor PgBouncer connection pools.
Supabase announced product updates, platform improvements, and community resources released during January 2022. The platform expanded authentication options by adding Notion and LinkedIn OAuth support alongside Vonage and Textlocal SMS providers for one-time passwords. Observability tooling gained SQL querying capabilities for logs, timestamp filtering, and expanded time spans across project usage charts to accelerate issue diagnosis. Database infrastructure advanced with the release of pg_graphql version 0.1.0 introducing SQL Comment Directives, while PostgREST replaced pg_listen with built-in schema reloading and automated compute-based connection pool scaling. To streamline customer assistance, a priority selector was added to dashboard support forms with urgent tiers for paid projects.
Supabase announced the acquisition of Logflare, a realtime log ingestion and analytics platform. Modern database architectures encompass APIs, authentication, storage, and CDNs, requiring unified observability to diagnose slow queries and trace user requests effectively. Built with Elixir—the same language powering Supabase's Realtime Engine—Logflare automates schema adaptation for streaming inserts and enables developers to construct APIs from SQL queries via Logflare Endpoints. The integration roadmap includes embedding log querying with SQL directly into the Supabase Dashboard, maintaining existing integrations for Vercel and Cloudflare, and transitioning Logflare toward a fully open-source implementation with multiple backend storage engines. Over the coming months, existing Logflare users will be migrated to the Supabase platform under matching pricing tiers.
PostgreSQL 14 introduces several enhancements to improve application performance, data manipulation, query troubleshooting, and database security. Developers can traverse nested JSON data structures using subscripting and store noncontiguous values using multirange data types in single operations. Applications relying on libpq can leverage client-side query pipelining to send multiple queries across high-latency networks without waiting for individual responses, while parallel execution now supports foreign data wrappers, parallel sequential scans, and materialized view refreshes. For observability, query IDs are integrated into live execution tracking via pg_stat_activity, EXPLAIN VERBOSE outputs, and log files. Security upgrades include predefined read-only roles such as pg_read_all_data alongside SCRAM-SHA-256 enabled as the default authentication mechanism.
The best engineering reads, once a week.