Accountability: Named Owner or Enforced Mechanism?
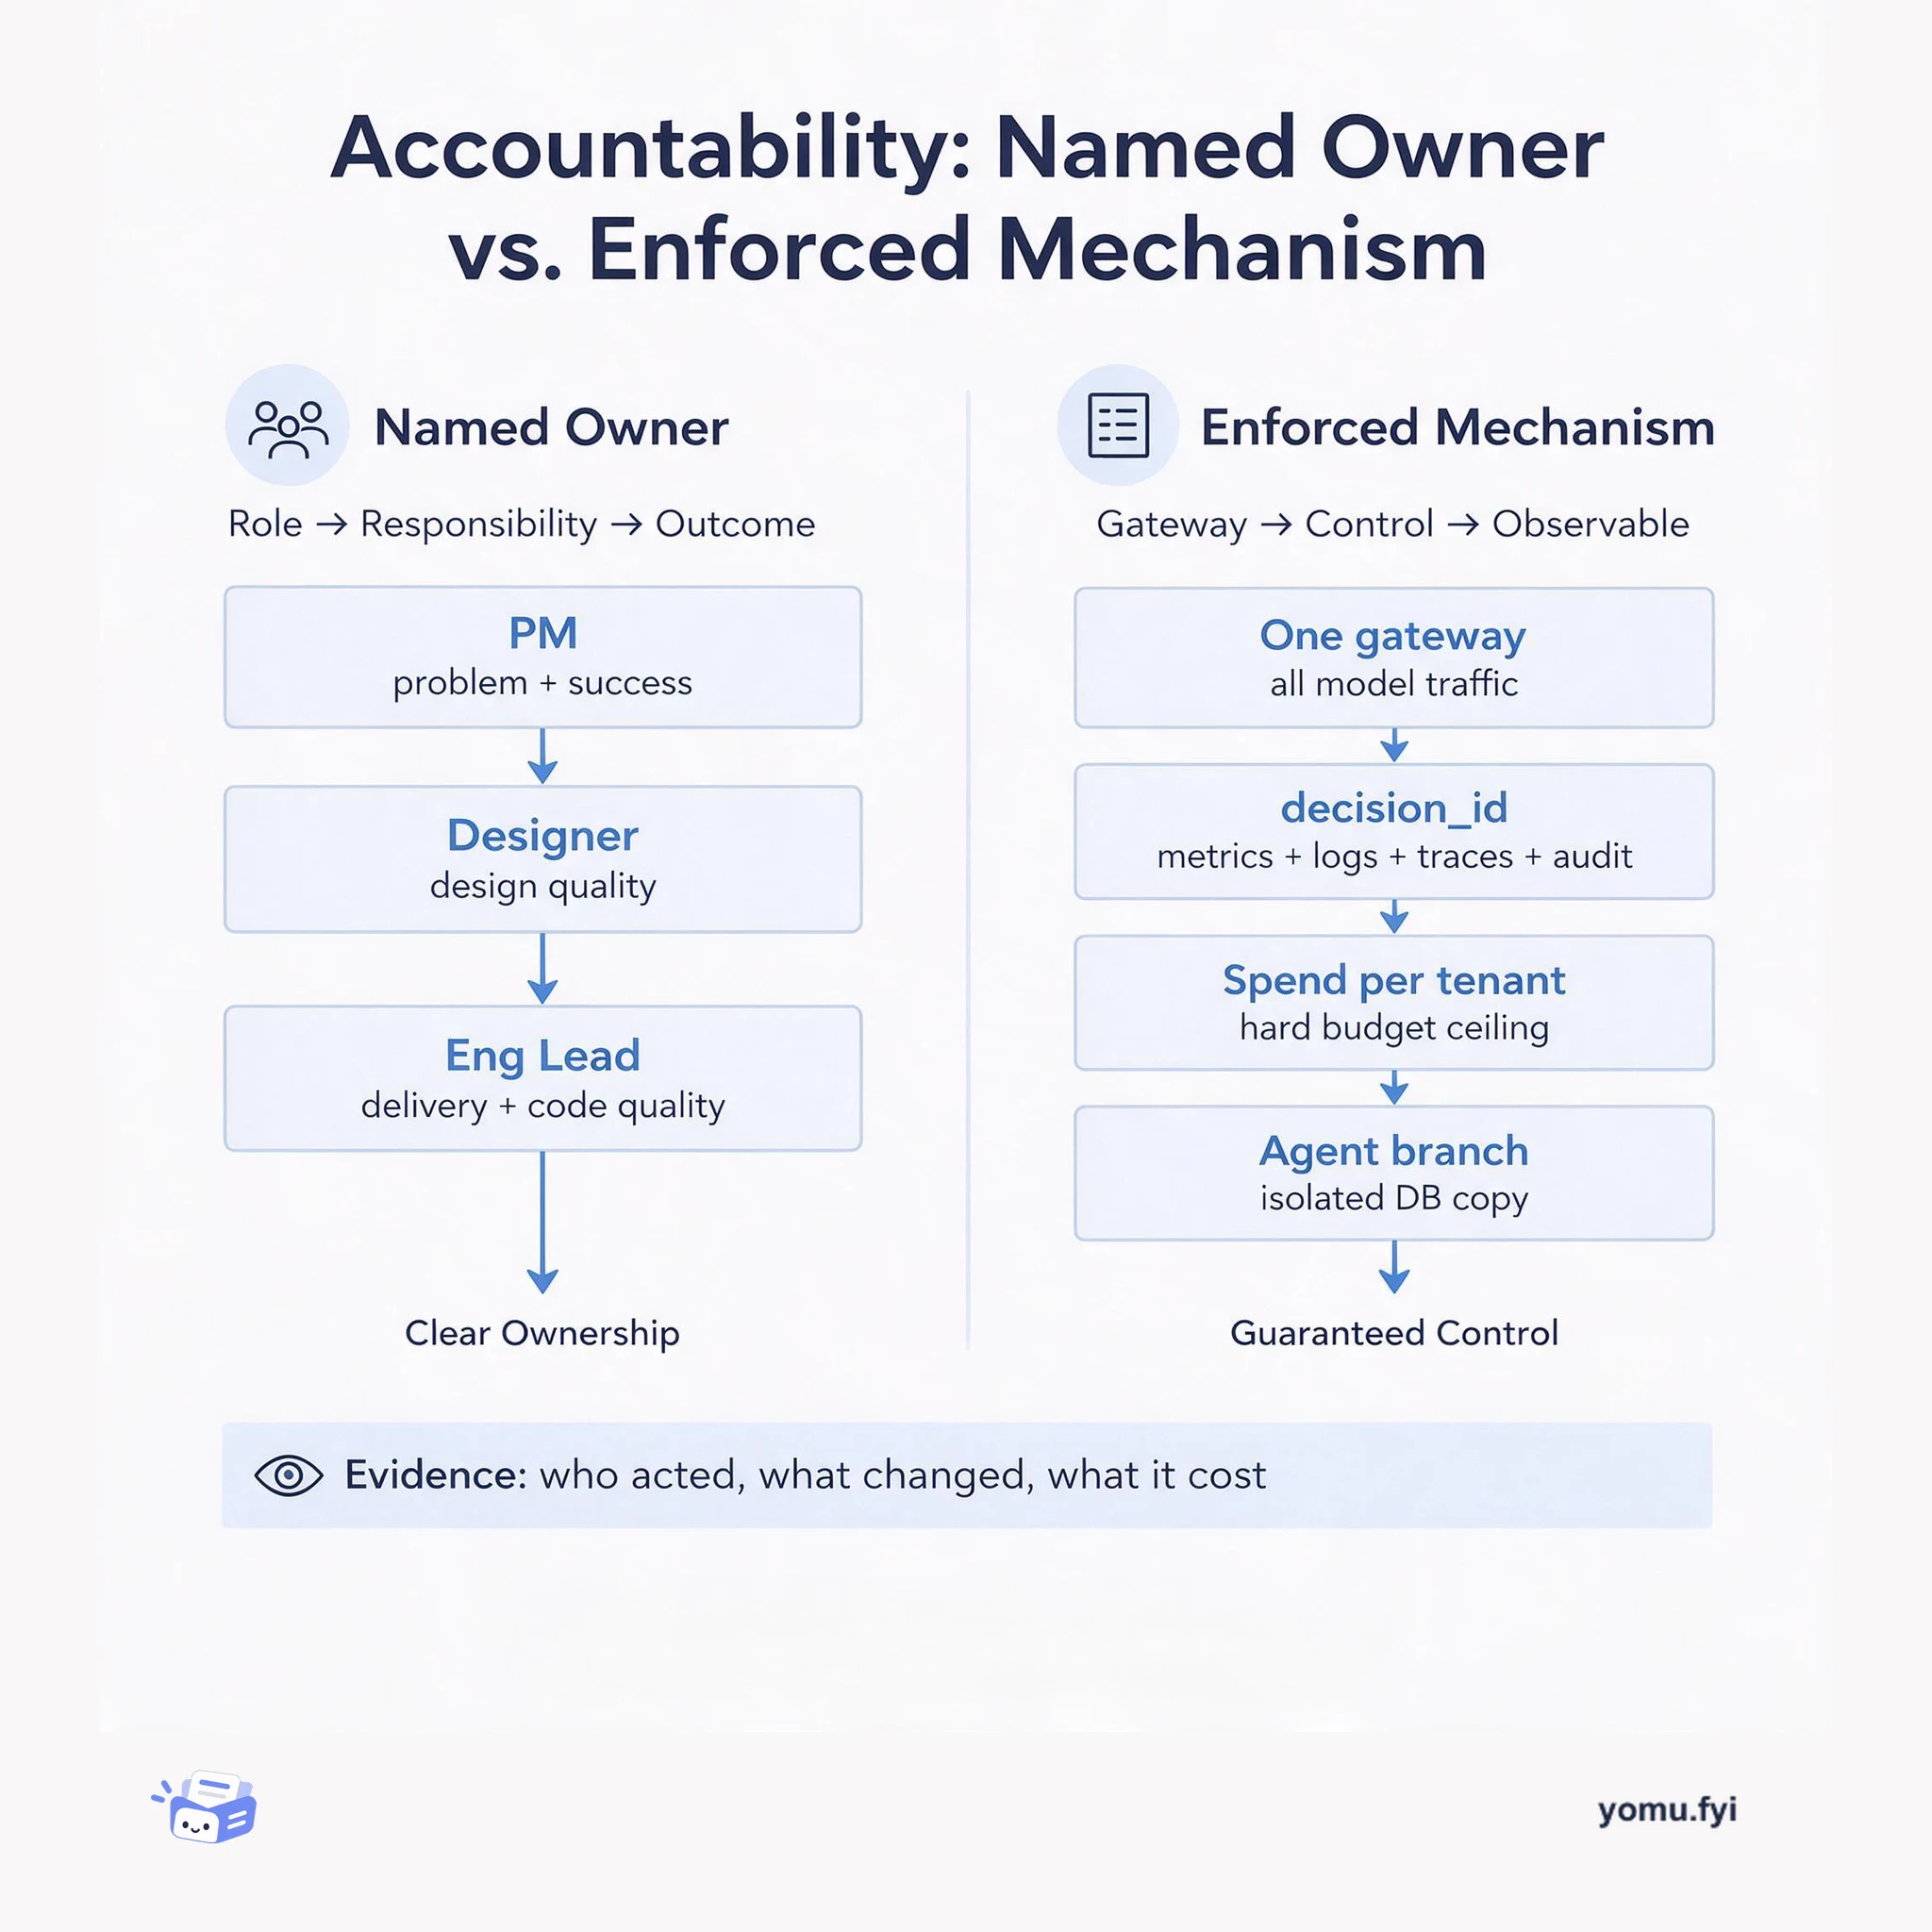
A side-by-side comparison of the two accountability models engineers actually rely on: a named human owner per outcome, and system-enforced traces, budgets, and isolation.
Loading…
Topic
250 posts about Observability. Every summary links to the original.
See the idea
A side-by-side comparison of the two accountability models engineers actually rely on: a named human owner per outcome, and system-enforced traces, budgets, and isolation.
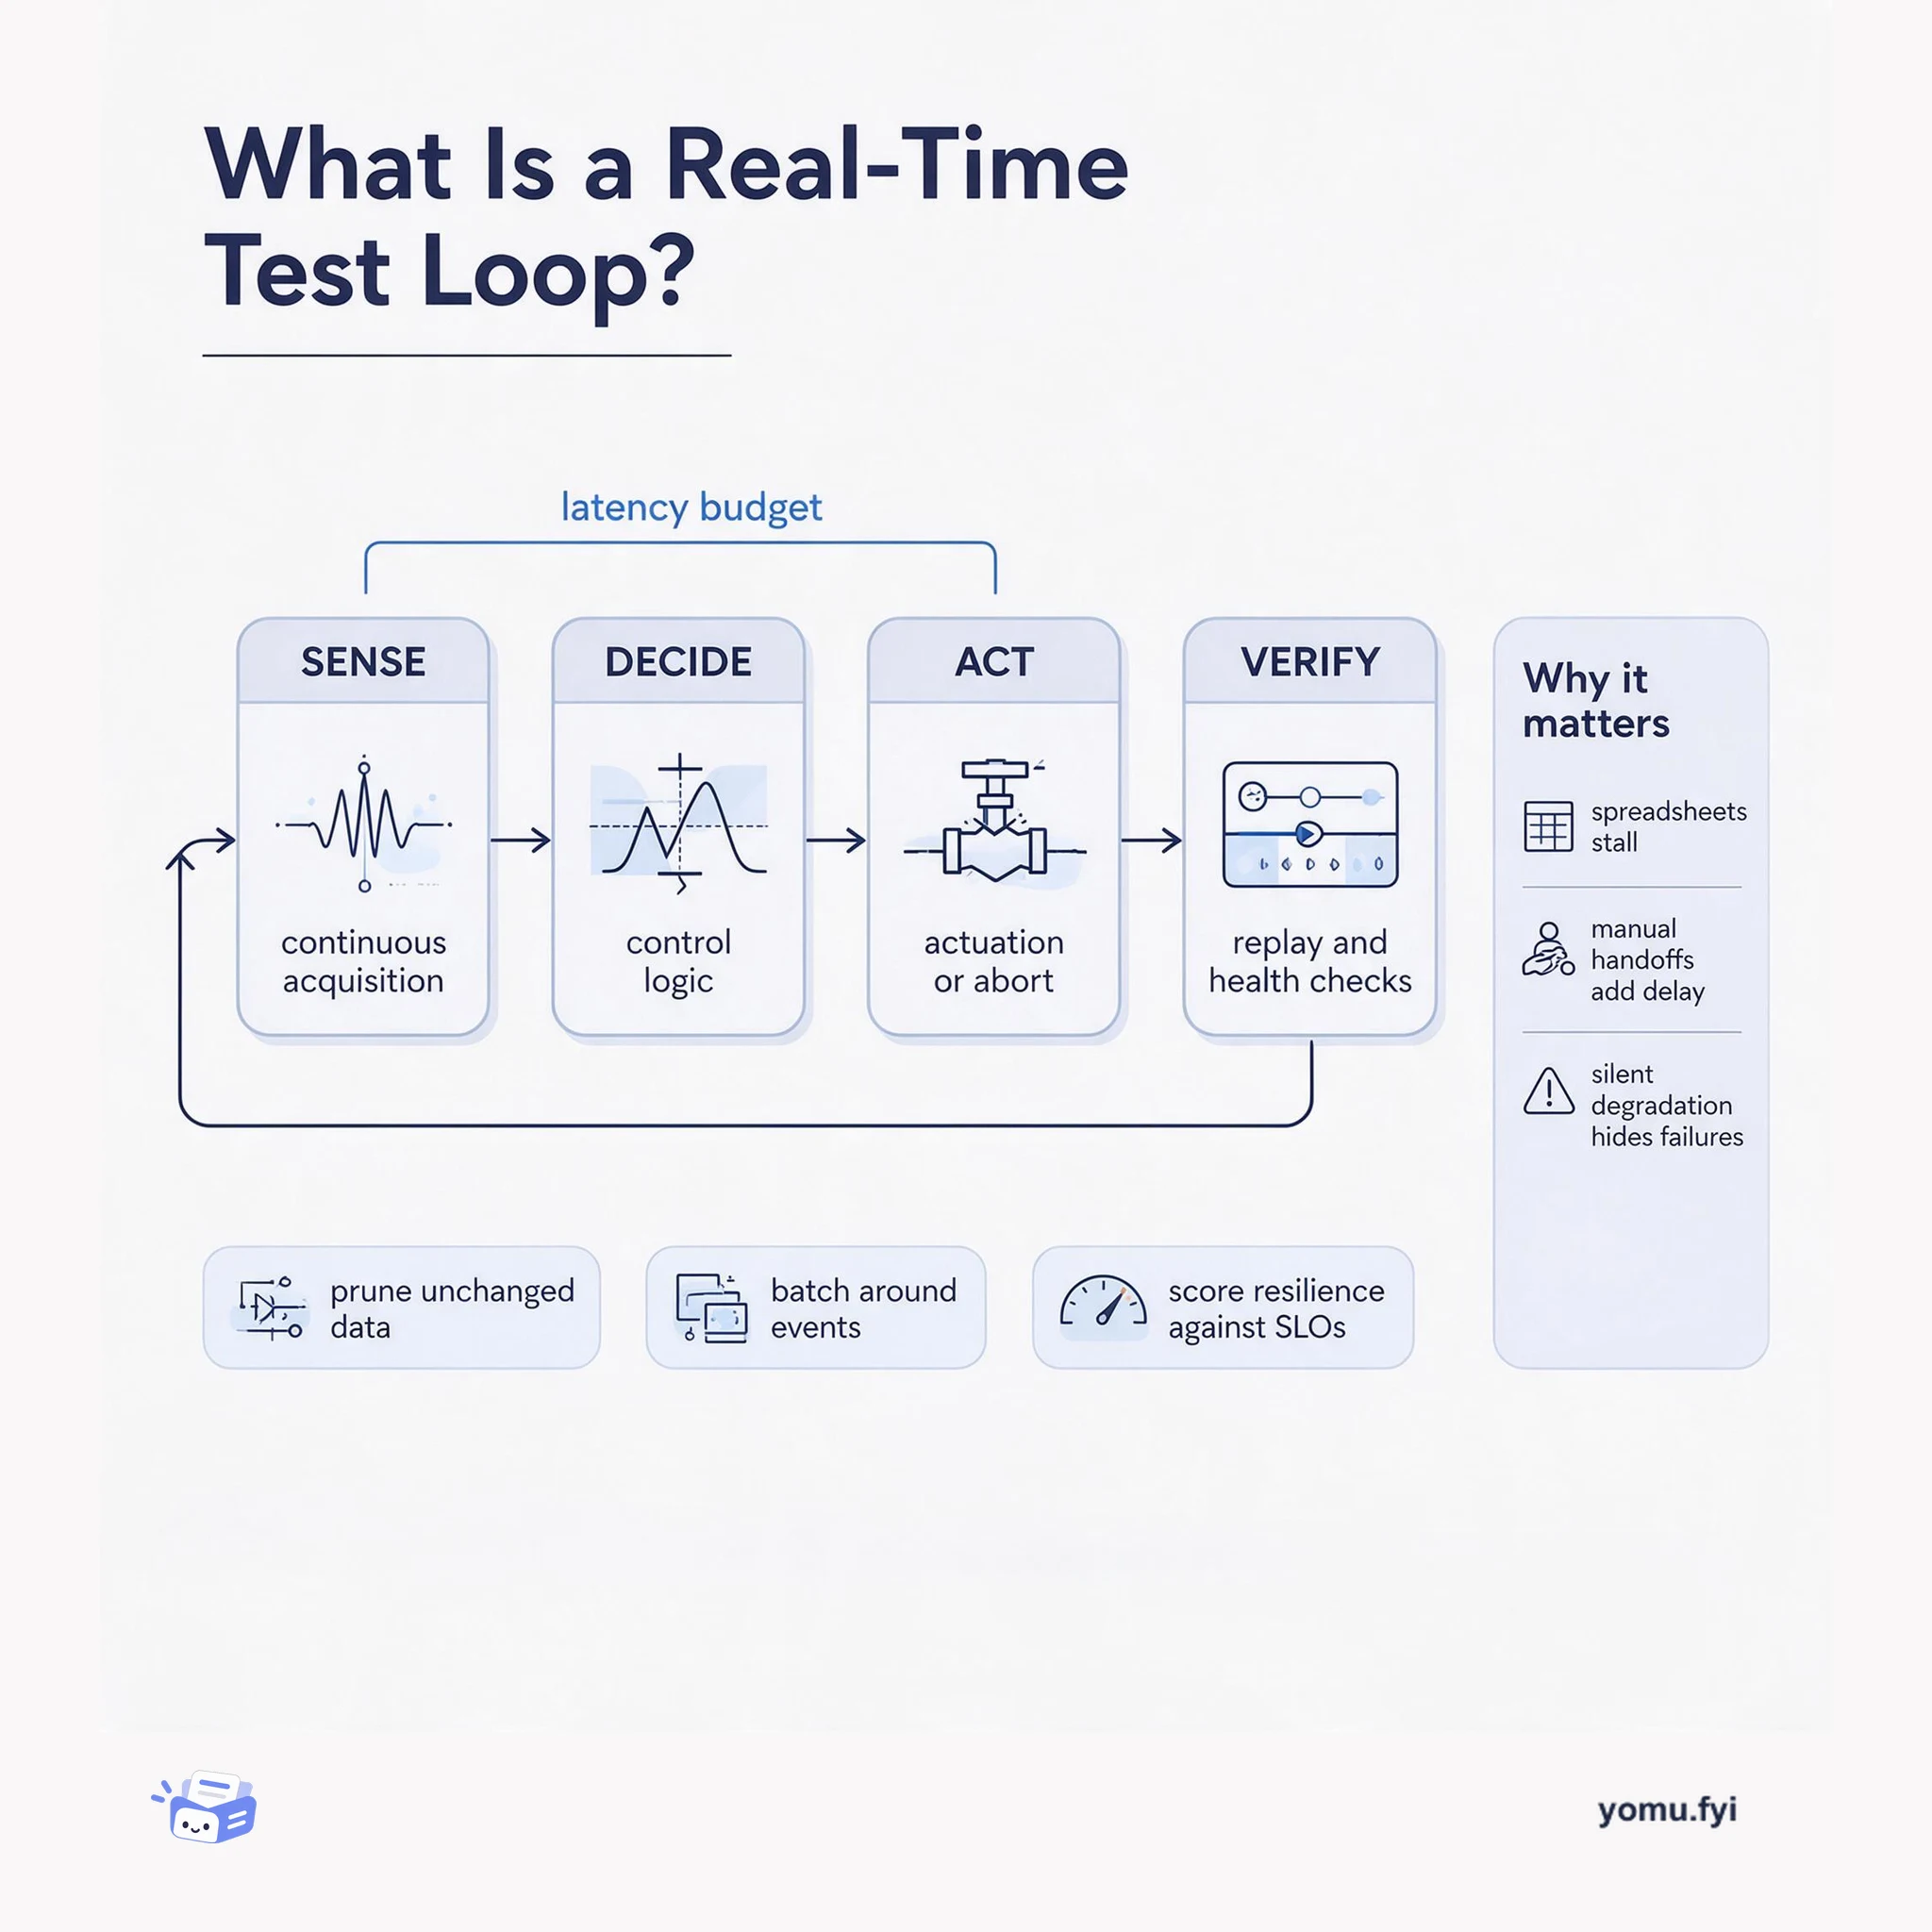
A real-time test loop is the closed path from sensor acquisition to control action and back to verification. This explainer maps its four parts and the latency budget that binds them.
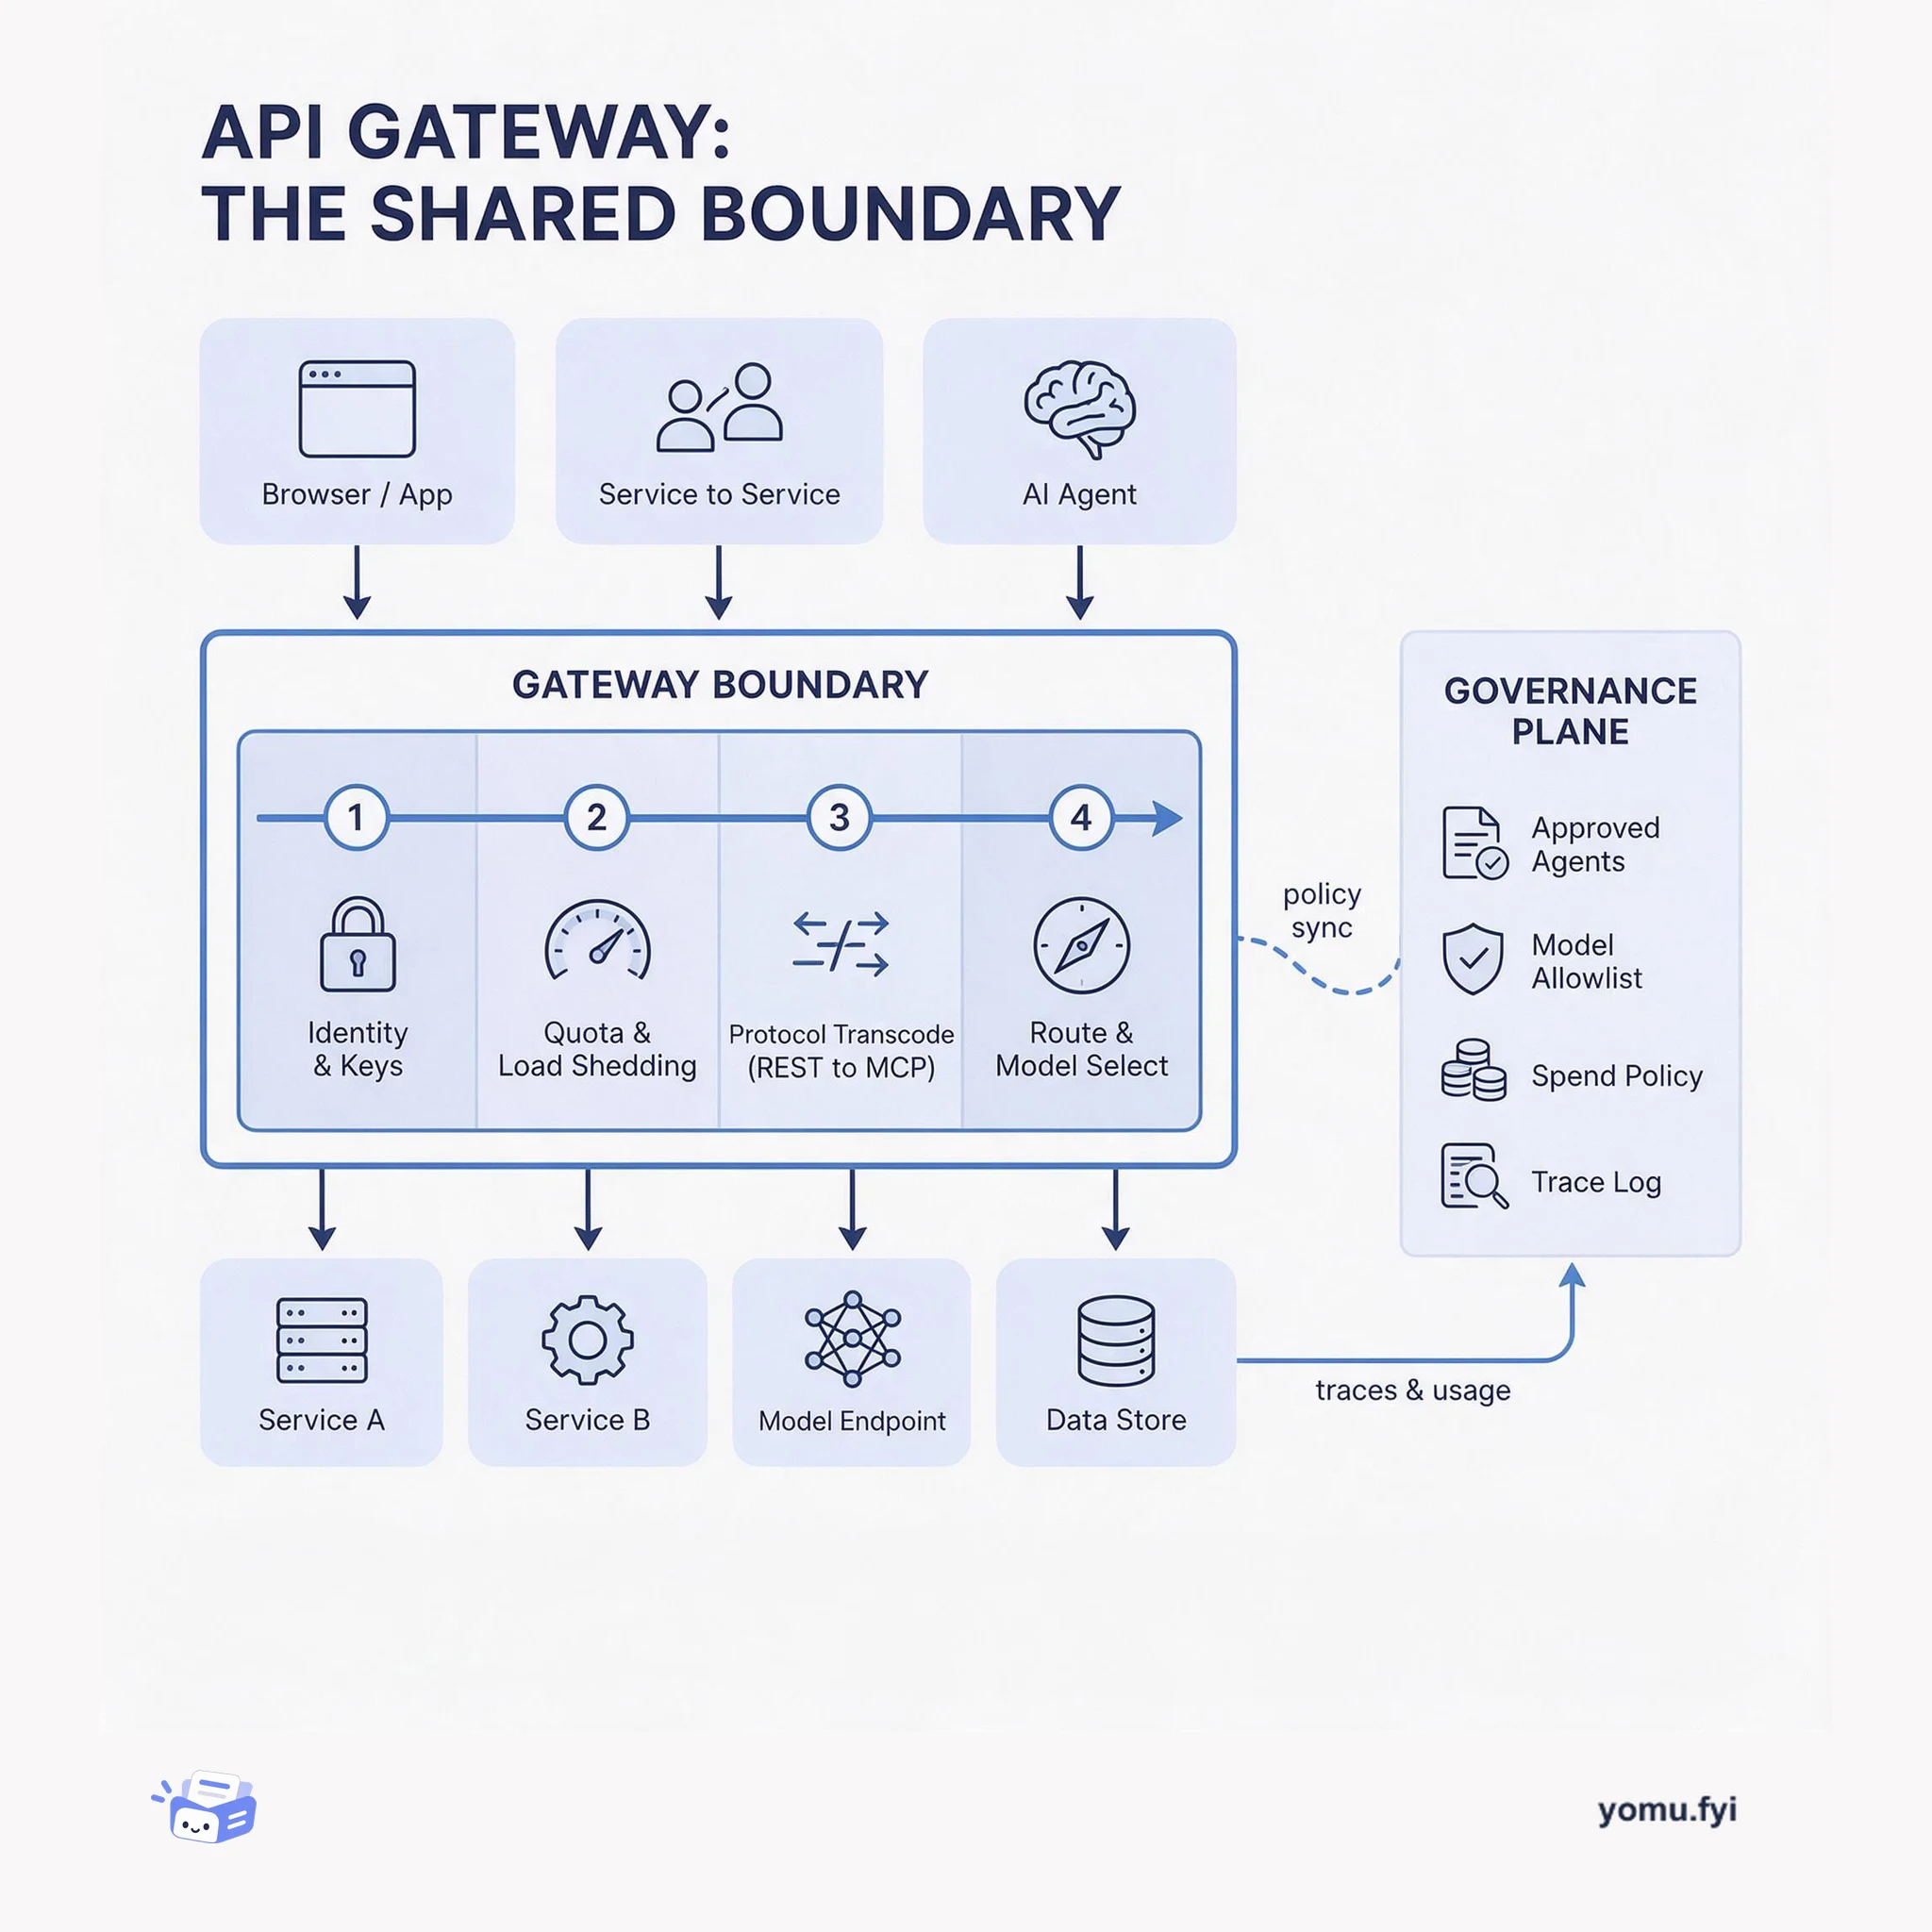
The API gateway is the single boundary where protocol translation, auth, quotas, and routing become shared policy instead of per-service code. This layered diagram shows what belongs there and why.
The Good Stuff
Paid picks we use ourselves. Links carry a referral code — a subscription through one earns us a commission at no extra cost to you.
Newest first
Managed ClickStack has introduced Role-Based Access Control (RBAC) to replace a legacy model where all users shared identical instance-wide permissions or required duplicate HyperDX instances for isolation. Integrated with ClickHouse Cloud for identity management, the new system allows administrators to assign users to roles governed by three access tiers: no access, read, and manage. Permissions apply across platform resources including dashboards, saved searches, sources, alerts, webhooks, and notebooks, with support for fine-grained rules matching names, IDs, or tags. While table-level source restrictions work through ClickStack, row-level access currently depends on separate ClickHouse SQL console roles, which the team intends to unify directly inside ClickStack in future releases.
Industry perspectives on AI coding agents remain divided between dismissal and excessive automation claims. ClickHouse integrated agentic coding across internal workflows, progressing from simple boilerplate scripts to active backend C++ development. Engineers primarily use command-line agents such as Claude Code with Claude Opus 4.5 and Codex CLI alongside observability platforms like Langfuse and Librechat. While agents effectively investigate continuous integration logs, generate internal dashboards, and assist with small C++ tasks, they lack architectural competence and require rigorous code review. ClickHouse treats agents as pair programmers for contained tasks, retaining human ownership over product strategy, attention to detail, and core code quality.
HyperDX introduced AI Summarize, a feature designed to translate raw logs, traces, and log patterns into narrative summaries directly within its observability interface. Instead of relying on backend large language models, the tool runs entirely client-side using OpenTelemetry-aware data extraction combined with hand-written phrase pools. The generation logic inspects Kubernetes and OpenTelemetry attributes—such as service names, endpoints, exception details, and query durations—to tailor tone across detective noir, Shakespearean drama, and nature documentary themes. Because processing occurs inside the browser tab without external API calls, the system avoids third-party latency, token expenses, model hallucinations, and data privacy risks. Users can access summaries across logs, spans, and pattern drawers or re-enable the interface toggle via URL parameter through April 2026.
Slack encountered a lack of client-side observability when introducing HTTP/3 at its edge. Because HTTP/3 runs over QUIC on UDP instead of TCP, neither existing commercial SaaS tools nor the internal Prometheus Blackbox Exporter could probe the new endpoints. To address this gap, an engineering intern integrated the open-source quic-go library into Prometheus Blackbox Exporter to build a native, configurable HTTP/3 probe. Slack deployed an internal implementation using the upstream functionality while waiting for pull request reviews, ultimately landing the contribution upstream. The resulting setup provides a unified view of HTTP/1.1, HTTP/2, and HTTP/3 metrics within Grafana, enabling reliable alerting and faster correlation with other telemetry.
AI agents are emerging as autonomous database users that generate SQL, execute queries, and iterate in seconds. Because traditional analytics workflows built for human analysts cannot keep up with these rapid loops, ClickHouse is adapting its platform for agentic workloads. The proposed Agentic Data Stack combines LibreChat for conversational interfaces, ClickHouse with Model Context Protocol servers for the data layer, and Langfuse for observability. Supporting developer tooling includes chDB 4 with a Pandas-like API, IDE integrations, and ClickHouse Agent Skills to enforce database design best practices. Platforms like Anthropic and Character.AI already leverage ClickHouse's high-concurrency aggregation and real-time ingestion capabilities to handle massive data scales required by modern AI applications.
ClickHouse Cloud released new monitoring capabilities and dashboards to give platform administrators deeper visibility into deployment health and server behavior. A newly introduced Overview page consolidates critical signals into a unified view for rapid health checks. Additionally, an updated Infrastructure page tracks service scaling over time, presenting CPU and memory utilization with new aggregation options alongside modals explaining automatic scaling decisions. The platform now sends automated email and Slack notifications when deployments encounter risks such as excessive parts, failed mutations, or query concurrency saturation. These additions allow administrators to proactively identify operational bottlenecks and configure scaling limits without spending excessive time searching for telemetry data.
ClickHouse Cloud required a vertical auto-scaling mechanism that preserves rapid scale-ups while avoiding prolonged over-provisioning after traffic drops. Operating on a single 30-hour lookback window forced scale-downs to take up to 30 hours, whereas an earlier fixed-factor CPU algorithm caused severe oscillations. The engineering team deployed a dual-window recommender pairing a 3-hour window for responsive scale-downs with a 30-hour window for single-step scale-ups. Alongside a trend-based hunting check to resolve conflicting window recommendations, the team introduced target-tracking CPU scaling using geometric mean watermarks and 10-minute median smoothing. This dual-window architecture reduced scale-down latency to 3 hours, prevented scaling oscillations, and significantly reduced infrastructure costs for variable database workloads.
Traditional logging solutions like Seq, ELK, and cloud platforms often face scaling bottlenecks, including slower queries, higher operational costs, and complex pipeline management. To address this, an ASP.NET service can write structured logs directly to ClickHouse using Serilog and the Serilog.Sinks.ClickHouse library. The sink transmits data over HTTP and provides a fluent C# builder to configure table schemas, typed JSON columns, full-text indexes, and MergeTree engine parameters. ClickHouse stores log data in a columnar format that delivers 10 to 20 times compression while enabling direct SQL queries, JSON property filtering, and real-time aggregations through materialized views. Furthermore, the sink includes an in-memory buffer to handle transient network drops with configurable batching, retry mechanisms, and callback hooks for failure alerting.
ClickHouse delivers high performance for telemetry data, but unoptimized queries on high-cardinality observability workloads can bypass pruning, inflate intermediate state, and exhaust cluster resources. ClickStack addresses this challenge by embedding engine-specific optimization best practices directly into how queries are generated, structured, and executed. For search workflows, the platform executes progressive queries across bounded time windows using optimize_read_in_order to return initial rows rapidly without scanning entire historical ranges. ClickStack also segments large chart aggregations into parallel bucket-aligned queries, automatically redirects map attribute filters to pre-materialized columns, and extends lazy materialization thresholds to minimize runtime input-output overhead. These query formulation strategies are being packaged into specialized analytical endpoints to power notebooks and external tools without requiring manual SQL tuning or exposing raw database interfaces.
ClickHouse has launched AI Notebooks for Managed ClickStack in private preview to assist site reliability engineers during system investigations. Instead of isolating interactions in a standard chat window, the platform embeds Anthropic's Claude models directly into a cell-based notebook canvas. The system connects the model to internal ClickStack APIs, translating natural language questions into structured queries that leverage ClickHouse optimizations like materialized views and query chunking. Engineers can inspect reasoning, edit generated SQL queries, add manual visualizations, and branch investigations to evaluate multiple hypotheses independently. While currently utilizing a last-write-wins model for shared canvases, the roadmap includes true concurrent editing, customizable context, and external tool integration via an MCP server.
Emerging artificial intelligence workloads are fundamentally transforming data platform requirements across real-time analytics, data warehousing, and observability. Conversational analytics and autonomous agents replace periodic batch queries with rapid bursts of concurrent, low-latency requests, exposing the architectural limits of traditional cloud data warehouses and standalone transactional databases. To resolve these constraints, architectures are converging on engine-level integrations between Postgres for transactions and ClickHouse for analytical scale, while unifying operational observability and business event storage. ClickHouse also incorporates turnkey agent interfaces through its acquisition of LibreChat alongside dedicated execution tracing from tools like Langfuse. These combined capabilities ensure organizations can reliably support interactive agentic workflows without incurring severe latency penalties or compounding infrastructure costs.
ClickHouse version 26.2 introduces twenty-five new features, forty-three performance optimizations, and one hundred eighty-three bug fixes across the database engine. This release graduates both the text-index and the QBit vector embedding data type to production-ready status for search and retrieval workloads. For streaming ingestion pipelines where row arrival rates are low, the engine adds time-based block flushing configurations to write data parts before hitting default row or byte thresholds. The update also embeds the ClickStack observability user interface directly into the standard binary distribution, accessible through the local HTTP server port. Further enhancements include automatic min-max indexing for temporal columns in MergeTree tables, interactive time-based one-time password authentication in the client, and a high-performance prime number generator function.
Heroku applications combine dynos, databases, third-party APIs, and user interactions, making fragmented logs, metrics, and dashboards costly to correlate during production incidents. The expanded SolarWinds Papertrail add-on addresses this “swivel-chair” workflow by unifying real-time log management, metrics dashboards, and alerting in one interface. It supports live tailing and contextual search through the web, CLI, or API, while ingesting native Heroku metrics for dyno CPU, memory, load averages, application throughput, response times, error rates, and database performance. Custom thresholds based on minimum, maximum, average, or summary values can filter transient-noise alerts, with notifications sent to Slack, PagerDuty, and Microsoft Teams. The post’s incident example correlates a response-time spike with R14 “Out of Memory” errors from Dyno worker.1, identifying an oversized batch job; Librato and AppOptics were deprecated at the end of January 2026.
During database latency spikes or unexpected outages, operations teams frequently waste valuable time downloading compressed archives and manually inspecting log files to isolate root causes. MongoDB Atlas resolves this operational friction by introducing a direct log integration feature for dedicated M10+ clusters. The system routes mongod, mongos, and audit logs directly to third-party tools such as Datadog, Splunk, Amazon S3, Google Cloud Storage, and Azure Blob Storage. Furthermore, built-in support for the OpenTelemetry standard enables teams to pipe database logs into any OTel-compatible logging backend. This setup eliminates operational silos, streamlines security auditing, and correlates database query diagnostics with application traces and infrastructure metrics in real time.
ClickStack introduced several platform updates and query performance enhancements across both open-source and Cloud environments for February 2026. ClickHouse Cloud OpenAPI now exposes ClickStack resources including dashboards, alerts, sources, and webhooks to support automated configuration-as-code workflows. In addition, ClickHouse 26.2 embeds the ClickStack UI directly into the database binary with a 4.1 MB footprint for local exploration and diagnostics. Visualizations now support native SQL mode for tables, allowing users to join disparate datasets like logs and traces across injected dynamic time variables. Finally, query execution speeds improve through streaming skip indexes, index pruning on disjunctions, and an expanded 100,000-row lazy materialization limit alongside new threshold alerting on number charts.
ClickHouse has reached general availability for its native Full-text Search feature, designed to accelerate token-based text filtering across large datasets. The capability relies on deterministic inverted indexes rather than probabilistic Bloom filter skip indexes, mapping individual tokens directly to row numbers. It supports plain strings, string arrays, and map keys or values while allowing configurable pre-processing and tokenization using standard SQL expressions. The system does not implement relevance scoring or store positional data for ranking, focusing instead on rapid filtering paired with large-scale analytical aggregations. Testing shows significant reductions in scanned granules alongside substantial latency improvements, though text indexes require more storage than Bloom filters.
Supabase has launched Log Drains for its Pro tier, allowing users to send Supabase logs to their own logging backend and investigate them alongside the rest of their stack. The feature addresses the separation between Supabase logs and external observability tools by exporting events from Postgres, API Gateway, Auth, Storage, Edge Functions, and Realtime. Logs are sent over HTTP in batches of up to 250 entries or every second, whichever comes first, with Gzip compression when supported by the destination. Supported destinations include Sentry, Grafana Loki, Datadog, AWS S3, Axiom, and generic HTTP endpoints; users configure drains in the dashboard and can create multiple drains, with pricing of $60 per drain per project, $0.20 per million events, and $0.09 per GB of egress.
Supabase Storage has shipped updates live in all regions for projects using Storage, targeting performance at scale, security vulnerabilities, and reliability issues. As projects reached tens of millions of objects, concurrent uploads exposed write bottlenecks, certain SQL deletes could orphan files, and a crafted path could escape the file backend’s storage root. The object-listing rewrite removes the prefixes table, six triggers, and twelve helper functions, derives folder structure from the objects table with a hybrid skip-scan algorithm, and uses cursor-based pagination; deep pagination on 60 million rows is up to 14.8 times faster without a write penalty. Direct SQL deletes are blocked by default through a statement-level trigger, while a configurable 30-second timeout supports cancellation of disconnected clients via native Postgres protocol. Idempotent migrations, TUS lock-race prevention, orphan-scanner fixes, OpenTelemetry metrics, and adapter and API bug fixes are included, with no code changes required.
ClickHouse 26.2 introduces an embedded distribution of the ClickStack observability UI packaged directly inside the ClickHouse binary. Designed for local exploration and instance inspection, this distribution allows developers to visualize internal query logs, traces, and system metrics without deploying external services. To preserve build integrity and keep the added binary footprint around 4.1 to 4.2 MB, the team avoided a Node.js dependency by embedding a pre-built static Next.js application using CMake-generated C++ structs. Supporting components such as MongoDB, Express, and the Pyodide WebAssembly runtime were omitted, disabling alerting and persistent dashboards in favor of simplicity. Users can access the interface directly over HTTP to monitor local databases and query performance out of the box.
IBM Research and UC Berkeley analyze how agentic LLM systems fail in enterprise IT automation, including incident triage, logs and metrics queries, and Kubernetes actions across long-horizon tool loops. To move beyond benchmark success rates, the analysis applies MAST (Multi-Agent System Failure Taxonomy) to execution traces, converting failures into structured signatures across system design, inter-agent misalignment, and task verification. It covers 310 ITBench SRE traces from Gemini-3-Flash, Kimi-K2, and GPT-OSS-120B, whose mean recalls were 75.5%, 28.6%, and 12.4%, respectively. Gemini averaged 2.6 failure modes per failed trace, compared with 4.7 for Kimi and 5.3 for GPT-OSS-120B, while FM-3.3, Incorrect Verification, was identified as the strongest predictor across models; the analysis recommends external verification, explicit termination controls, and clarification branches.
The best engineering reads, once a week.