What Is a Real-Time Test Loop?
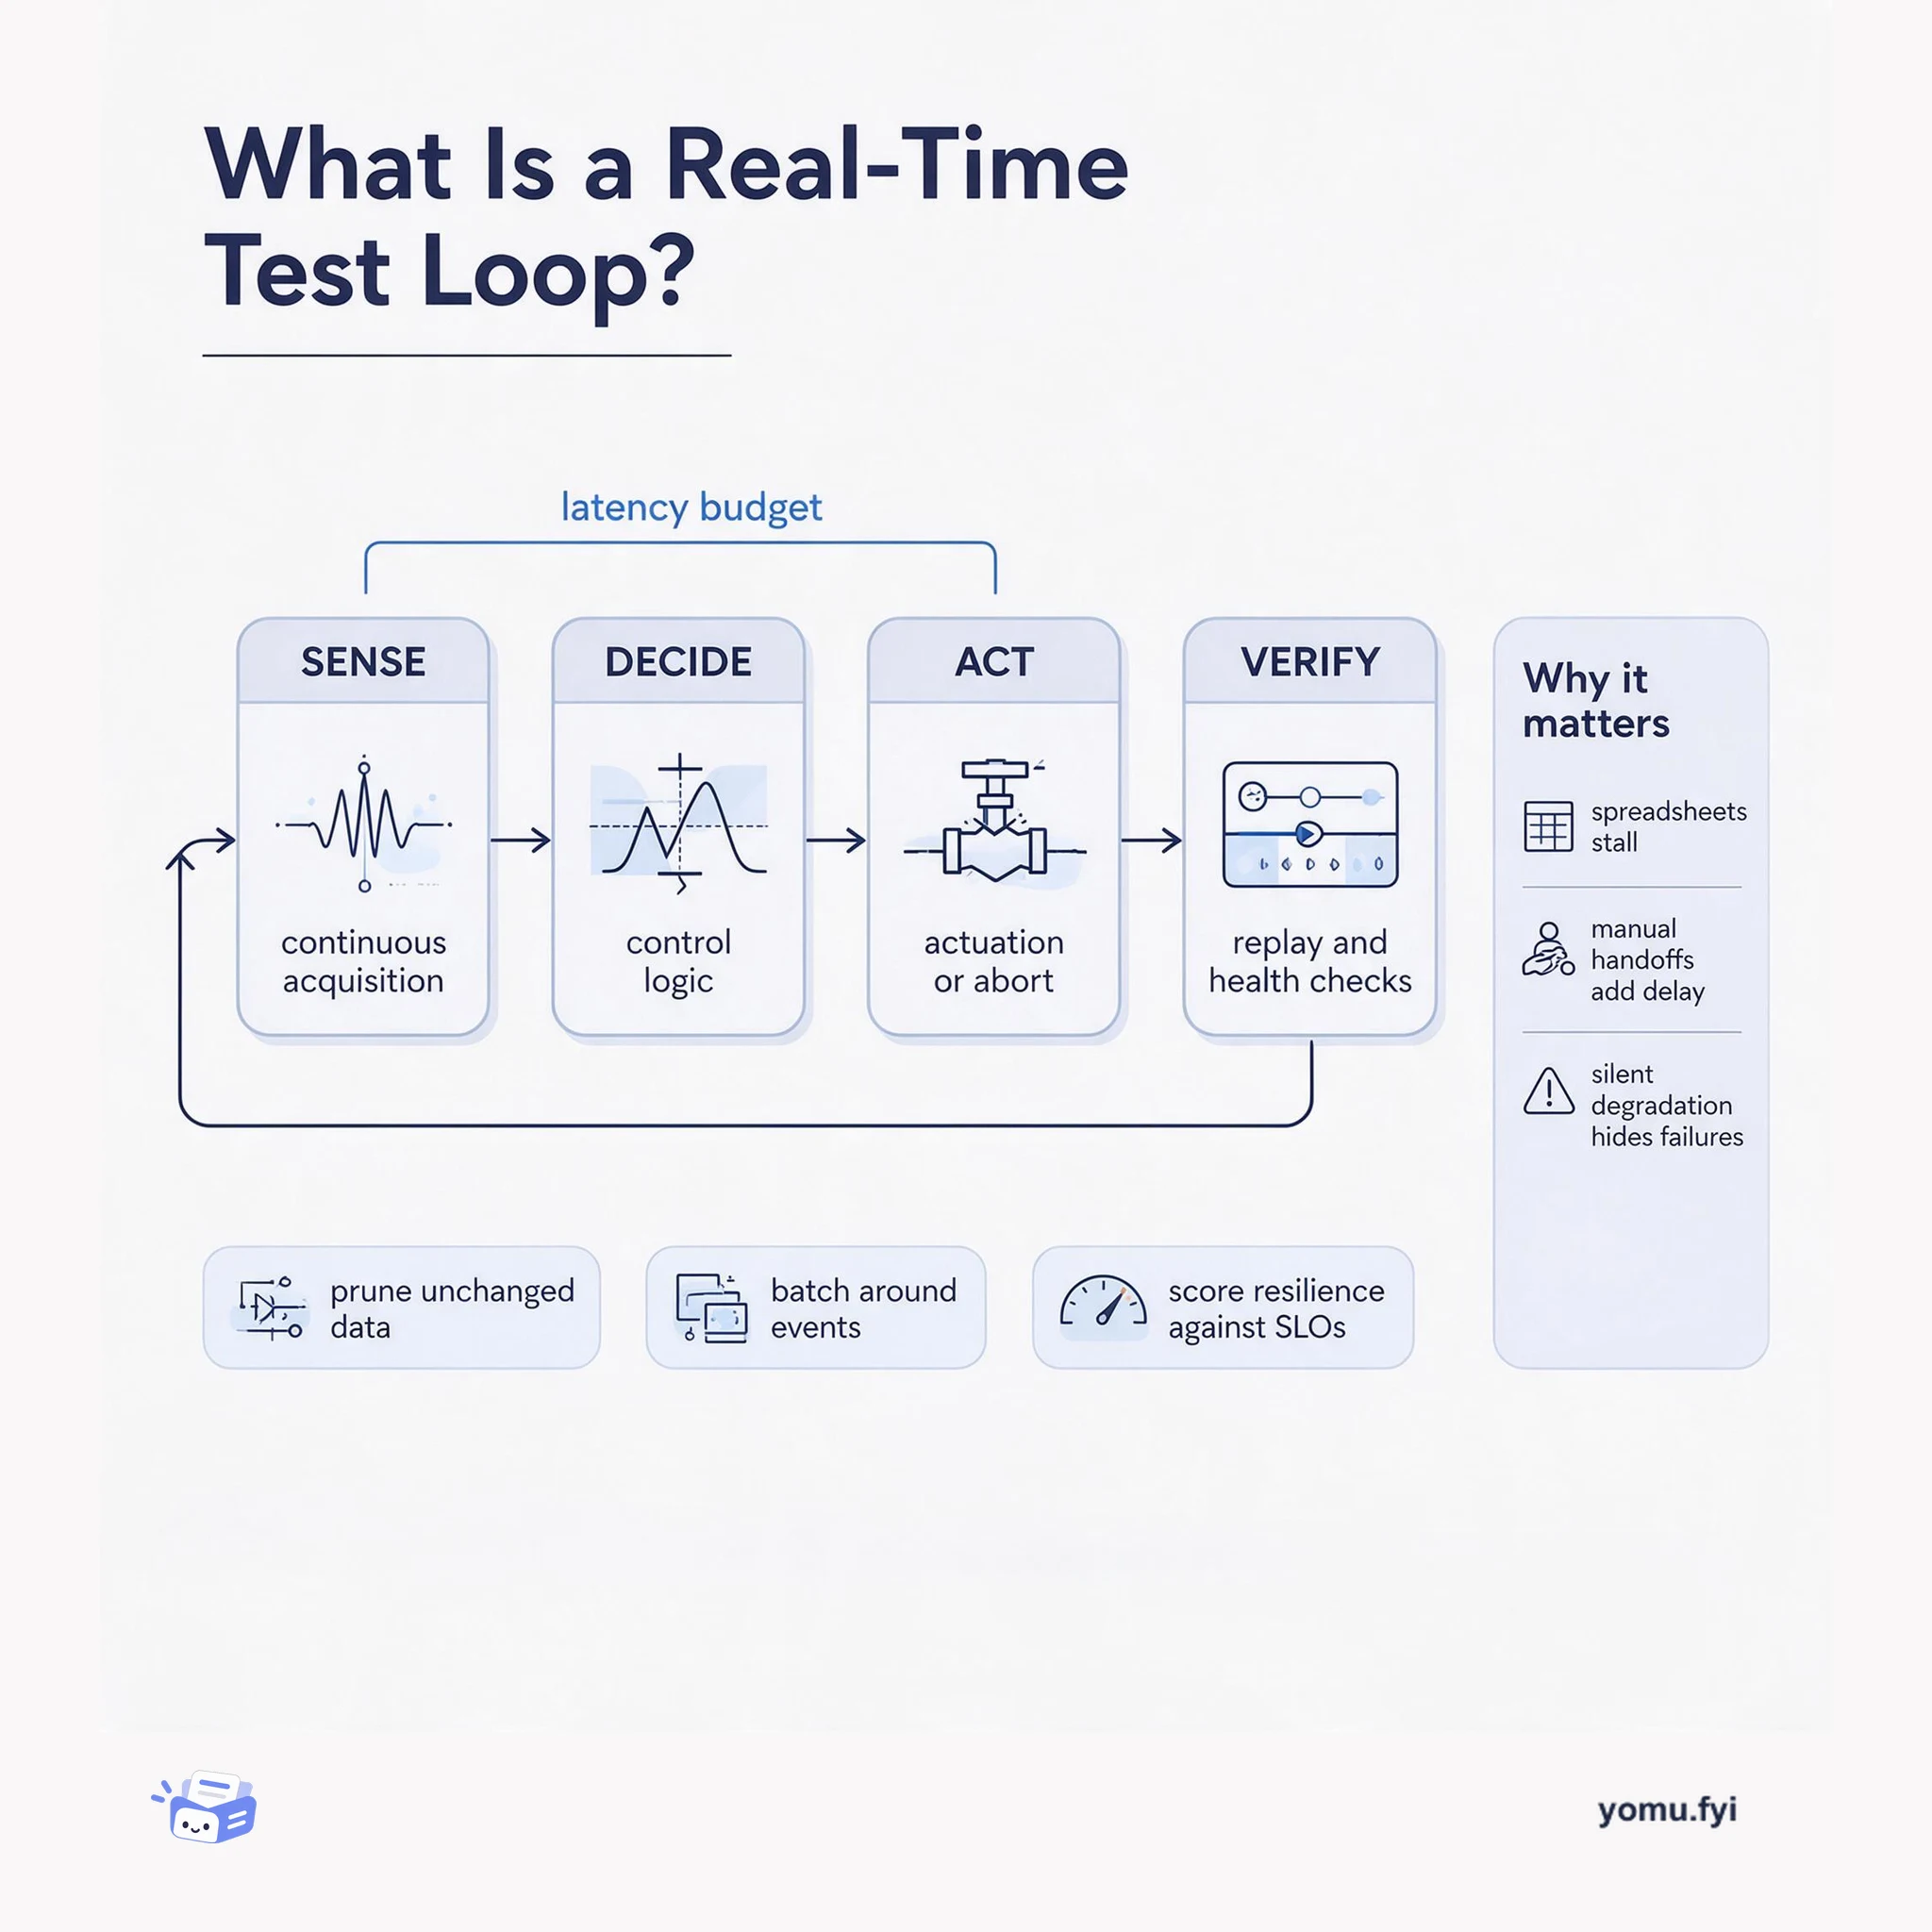
A real-time test loop is the closed path from sensor acquisition to control action and back to verification. This explainer maps its four parts and the latency budget that binds them.
Loading…
Topic
244 posts about Observability. Every summary links to the original.
See the idea
A real-time test loop is the closed path from sensor acquisition to control action and back to verification. This explainer maps its four parts and the latency budget that binds them.
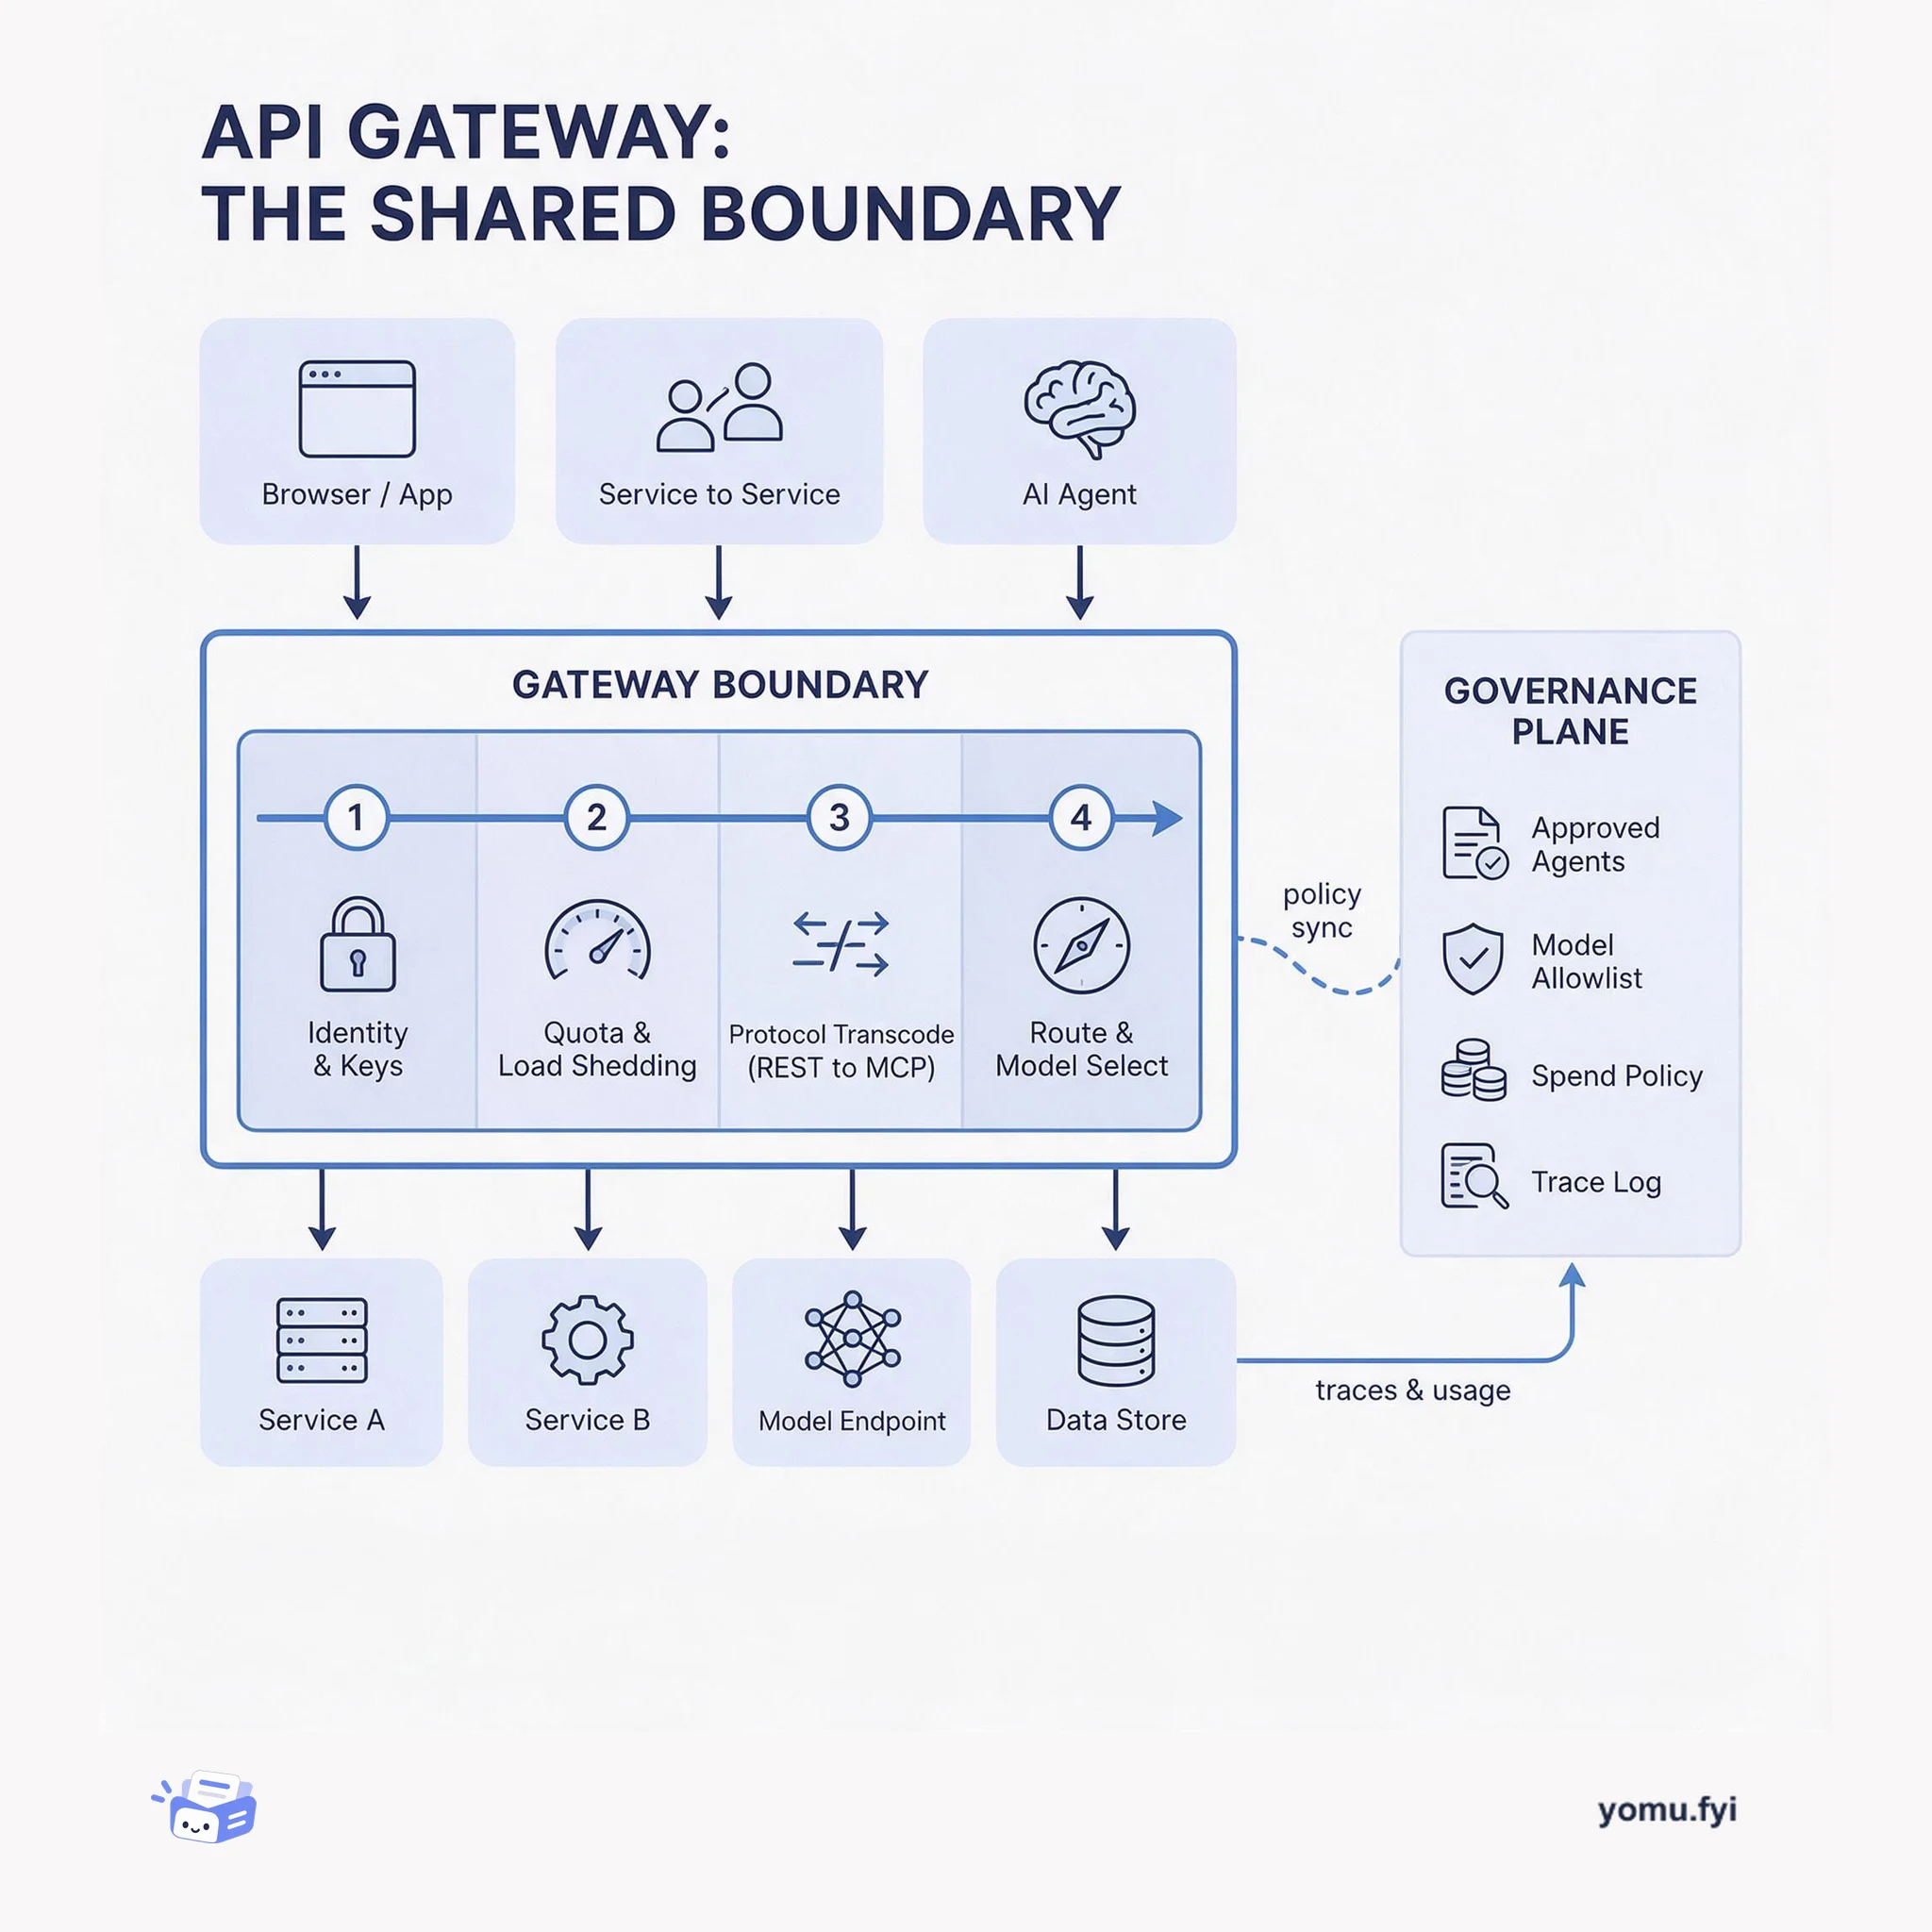
The API gateway is the single boundary where protocol translation, auth, quotas, and routing become shared policy instead of per-service code. This layered diagram shows what belongs there and why.
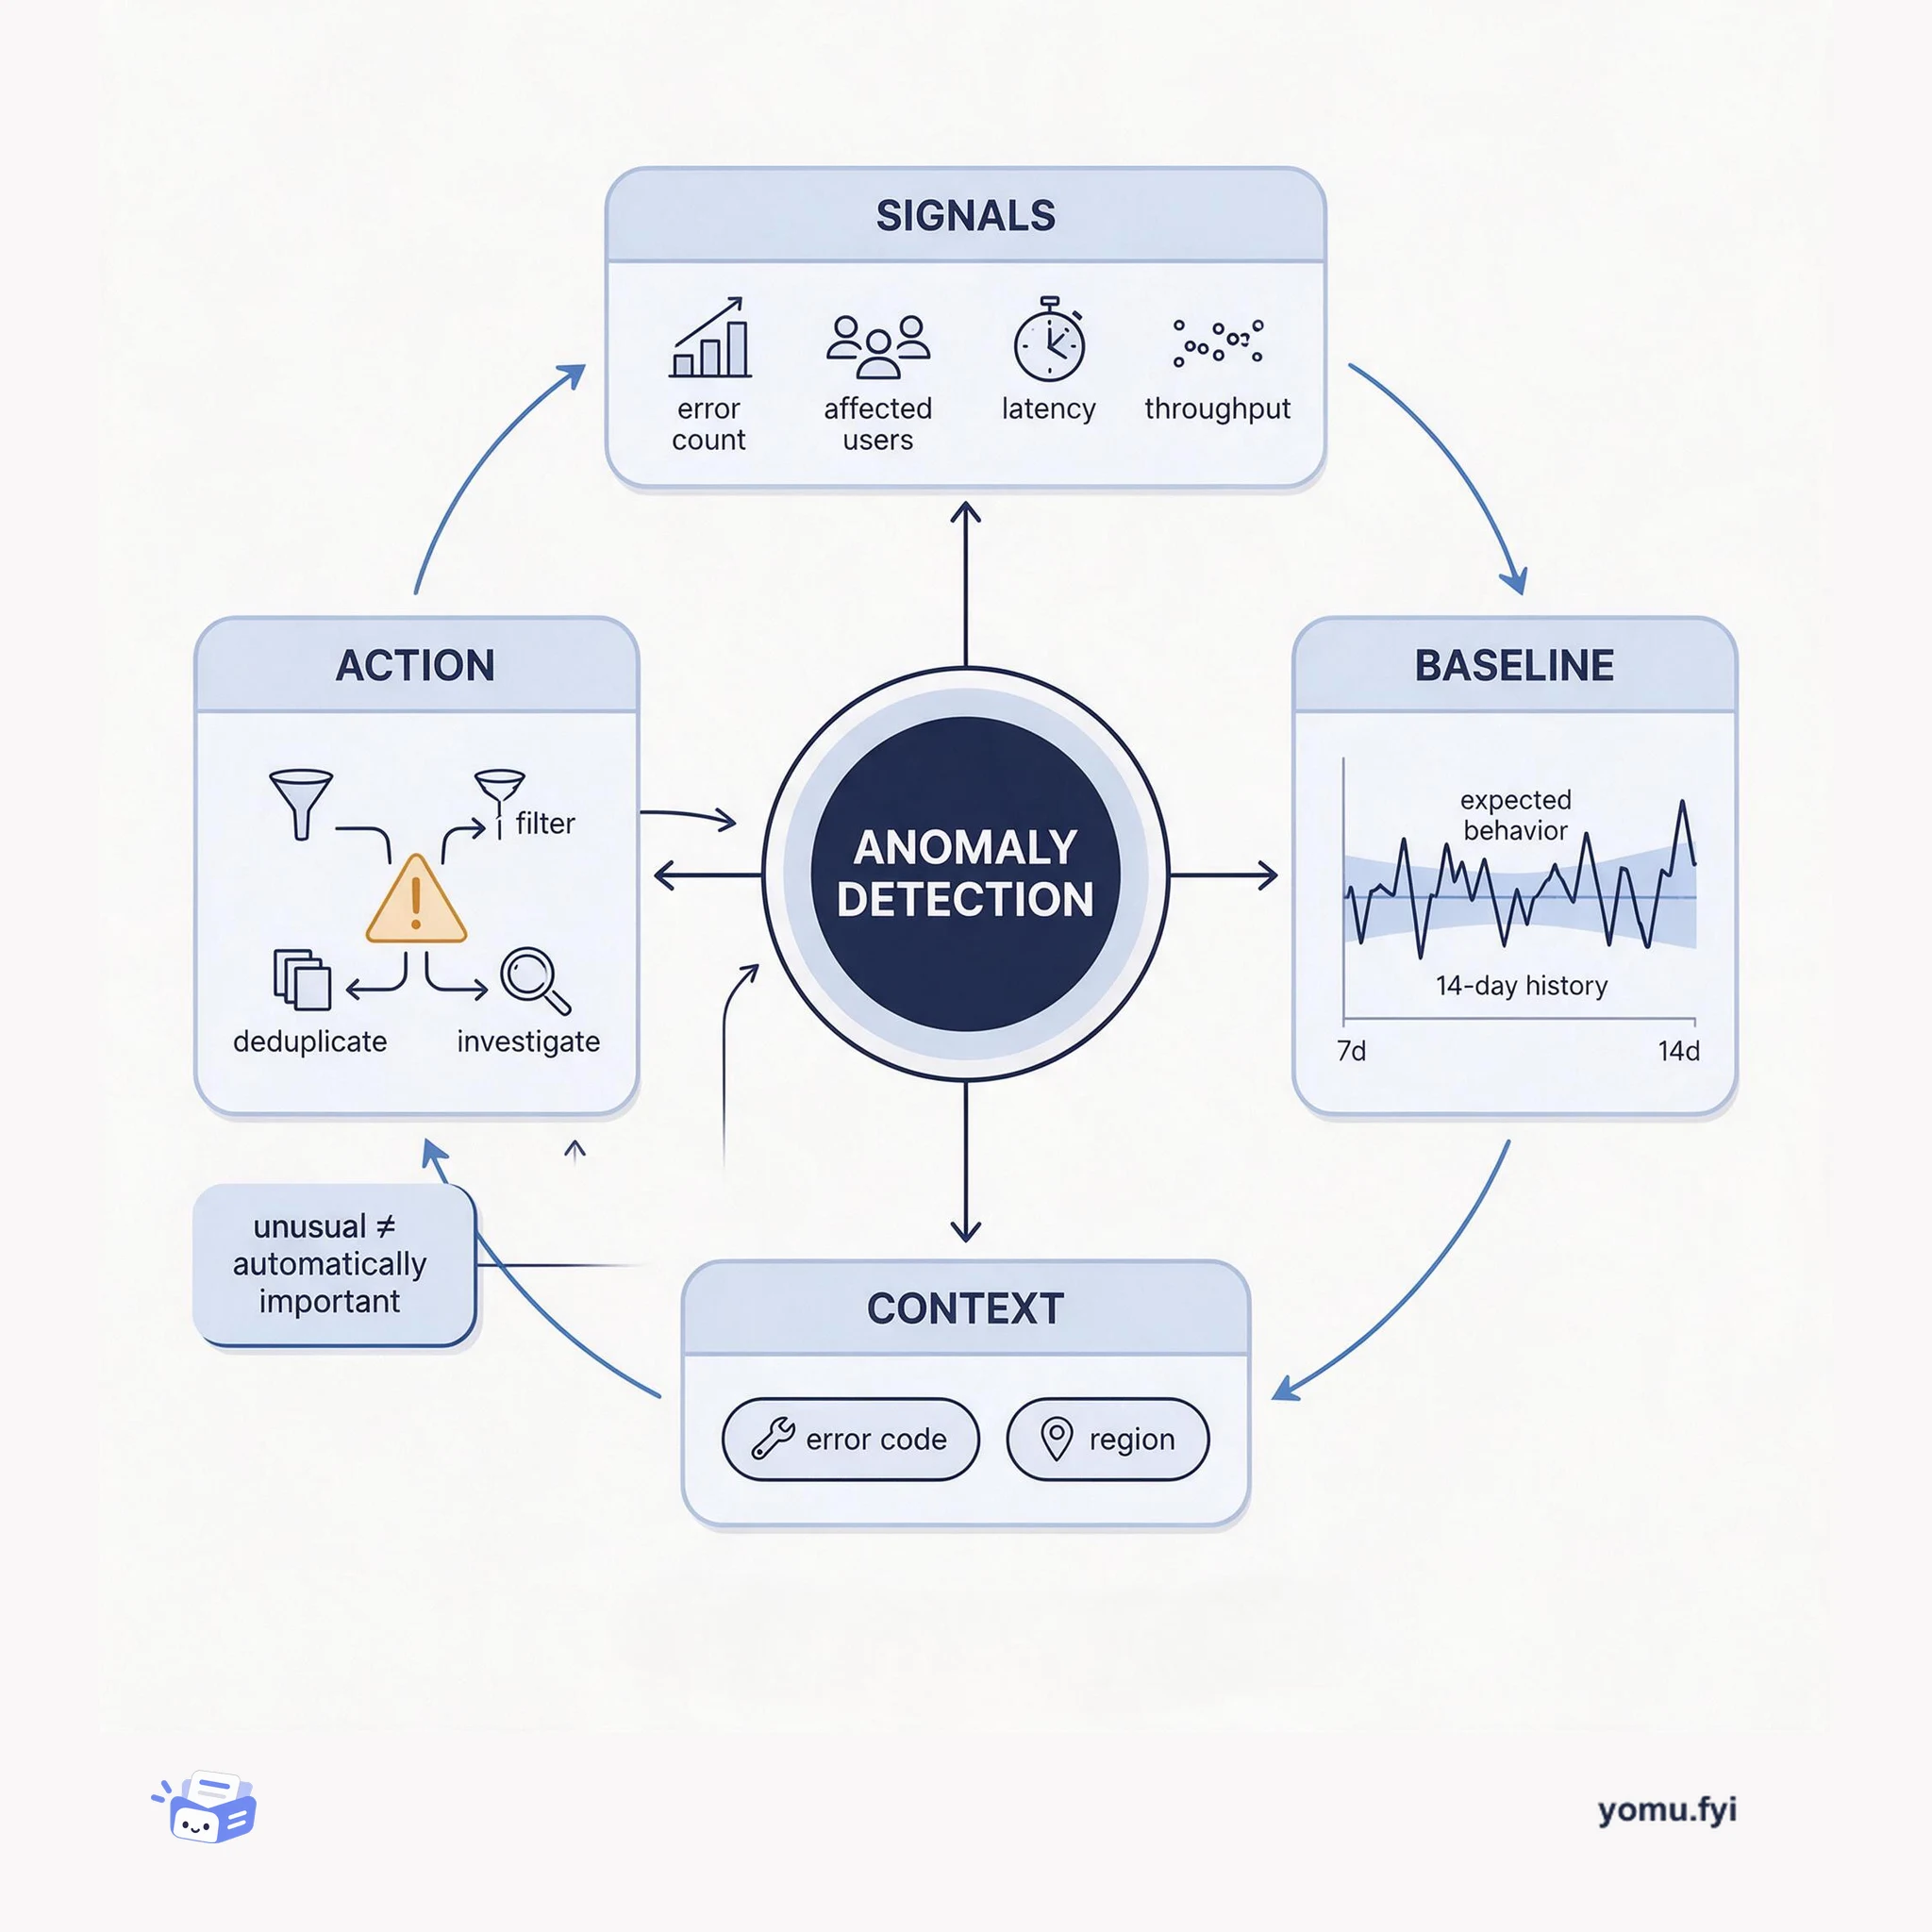
Anomaly detection identifies meaningful departures from expected behavior. This explainer shows how signals, baselines, context, and alert routing turn unusual measurements into engineer-ready findings.
The Good Stuff
Paid picks we use ourselves. Links carry a referral code — a subscription through one earns us a commission at no extra cost to you.
Newest first
Scaling research and trading platforms across thousands of data sources created bottlenecks at Two Sigma, where reliance on database snapshots and fragmented infrastructure slowed dataset delivery to data scientists. To address operational costs and architectural complexity, the data engineering team adopted software development principles by treating data as code. The organization migrated to Google BigQuery's serverless architecture, standardized SQL transformations using dbt, and defined declarative pipelines with Terraform under continuous integration workflows. Internal tooling was introduced to track directed acyclic graph dependencies, automate anomaly detection, and streamline data discovery. These shifts eliminated manual data movement routines, reduced operational overhead, and enabled formal data contracts to safeguard downstream consumers and emerging language model integrations.
Cursor is introducing enterprise features intended to make its coding agents more capable, transparent, and secure for organizations already using the product. Hooks expose the agent loop to custom scripts that can log actions and tool calls, enforce compliance or command allowlists, scrub sensitive material, connect external systems, and trigger automations; they can be distributed through MDM or Cursor’s cloud option. Team Rules provide shared context and can recommend or require standards such as API schemas, conventions, and workflows, while upgraded analytics report activity, adoption, AI lines of code, directory-group filters, and exportable data with updates every two minutes. The release also adds an Audit Log covering 19 event types and Sandbox Mode, which restricts network and file access by default, with administrators controlling availability and team-wide Git and network access.
BharatPE, an Indian fintech processing over ₹12,000 crore monthly across 450 cities, operated a 45-terabyte self-hosted MongoDB Community Edition deployment. Managing three sharded three-node clusters resulted in uneven data distribution, high maintenance costs, scaling friction, and disaster recovery gaps under strict regulatory requirements. To modernize infrastructure, the database operations team partnered with MongoDB to execute a structured five-stage migration to MongoDB Atlas. The initiative utilized mongosync for secure data transition alongside environment mirroring and automated integrity validation scripts. Transitioning to MongoDB Atlas yielded a 40 percent improvement in query response times and provided automated failover backed by a 99.995 percent uptime SLA.
Heroku Fir addresses production troubleshooting when a release causes failures, such as a background worker breaking after a database schema change, without requiring access to a live formation dyno. Its interactive heroku run command launches a dedicated one-off dyno with the application code and environment variables, relaying terminal input and output for tasks such as rake db:migrate; using it requires a public SSH key and a deployed application. The platform’s native OpenTelemetry (OTel) signals add router request-duration summaries and percentiles, represent heroku.router.connect and heroku.router.service as floats, and attach heroku.app.name to application signals. Together with service.name filtering for first-party services, these capabilities support identifying affected applications, applying isolated fixes, and verifying latency and errors through an observability platform.
Heroku Fir includes OpenTelemetry as a built-in observability capability, addressing the need to monitor increasingly distributed and complex applications. The post introduces OpenTelemetry’s logs, metrics, and traces, while noting that events and profiles are under development. It distinguishes application-embedded SDKs, which generate and process telemetry, from standalone collectors that receive, process, and export data, although Fir acts as the central hub for telemetry pipelines. The walkthrough uses the Go getting-started app in a Fir space, creates Grafana Cloud credentials and environment variables, converts OTLP headers to JSON, and adds an HTTP Heroku Telemetry Drain with the CLI. After deployment and browser refreshes, application metrics appear in Grafana Cloud, followed by traces and logs.
Heroku applications can add the Moesif API Observability add-on to analyze API traffic and support monetization. The setup uses either the Heroku CLI or Dashboard: the CLI command is heroku addons:create moesif, while the UI path goes through Resources, Find more add-ons, and Metrics and Analytics. Provisioning creates a MOESIF_APPLICATION_ID config variable, and the application then requires the Moesif SDK initialized with that value. The guide also covers copying the variable into a local .env file with Heroku Local and excluding that file from Git through .gitignore. Once configured, API events should flow into Moesif for live logs, time-series metrics, funnels, retention, alerting, and billing features, while Heroku handles add-on billing and user management.
Hugo, Grab’s data-ingestion platform for a data lake with more than 4,000 user-onboarded pipelines, faces failures that can leave users with limited visibility and on-call teams handling ad-hoc diagnosis, unclear resolution steps, and DPIs without clear RCA. The proposed automation architecture combines Signal, Diagnosis, RCA Table, Auto-resolution, Data Health API, and Data Health Workbench modules to monitor table health, identify root causes and assignees, execute fixes, and expose status to users and other platforms. Signals come from Airflow failure callbacks and Genchi’s SLA and data-completeness checks; diagnosis avoids parsing extensive logs, runs analysers in parallel according to signal type, and supports asynchronous custom handlers such as retry with backoff for transient errors. Reported outcomes include improved data visibility, faster issue resolution, reduced Hugo on-call workload, scalable handling of transient failures, and more precise data-contract incident management, while next steps include runtime optimisation, richer workbench details, and Flink diagnostics.
Grab’s Iris project replaces a fragmented Spark observability stack with a centralised platform for real-time and historical analysis. The previous setup split data between Grafana, Superset, InfluxDB, and a data lake, creating usability, access-control, pipeline, metadata, and high-cardinality query challenges. The new architecture uses StarRocks as a unified store, ingesting Kafka directly, serving a custom Iris web application and Superset, and backing up to S3. Its relational data model links worker metrics through worker_uuid and Spark event metrics through app_id, while materialised views and dynamic partitioning support responsive queries and data retention as volumes grow. The resulting system consolidates metrics and metadata, simplifies ingestion and offline processing, and supports job-level showback/chargeback; the roadmap includes recommendations, advanced analytics, machine learning, and scalability improvements.
Stripe events notify account owners about changes such as successful charges, failed invoice payments, and available reconciliation reports. Because Stripe retains events for 13 months but exposes older events than 30 days only as summaries, Amazon EventBridge can route them into an AWS account and Amazon CloudWatch Log Groups can provide longer-term monitoring and analysis. The setup uses CloudWatch metric filters to match event types such as invoice.payment_failed, convert matches into custom metrics, and support alarms, Amazon SNS notifications, dashboards, and Logs Insights queries. For example, a failed-invoice alarm can use a five-minute observation period, Sum statistics, and a threshold based on expected failure volume or anomaly detection. The resulting setup supports near-real-time visibility into successful charges and failed payments, historical trend analysis, troubleshooting, and responses to unusual activity.
Grab migrated its stream-processing (write) functionality from an existing service into a separate service while handling 20,000 reads per second from 16 Kafka streams and writing to output streams and DynamoDB tables. The migration required gradual stream-by-stream rollout, production validation, and a no-downtime switchover; feature flags were rejected because deployment timing could cause loss, duplication, or inconsistent values. The team moved processing into shared /commons code, created temporary validation sinks, and scheduled each switchover with a shared map[string]time.Time, allowing both services to change writers at the same time. During each cutover, both services consumed streams, the old service stopped writing to resources, and monitoring continued before old consumption was removed; the result was zero data loss or duplication, no downtime, and completion in about three weeks. It was temporary and tested, but rolling back either service could create inconsistency if systems fell out of sync.
Stripe integrations can appear healthy while API and webhook failures accumulate unnoticed when applications lack robust logging and alerting. The post demonstrates Stripe Workbench, a Dashboard view that stores available information by default, obfuscates sensitive data, and provides searchable logs without code changes or additional software. In the example, about 50% of daily API calls fail; the Errors tab groups failures and connects each type to sample requests and related logs, revealing repeated card-verification errors and a request associated with an “Attacker Engineering Test Key” whose Go user-agent conflicted with the stated .NET backend. The investigation identifies a team testing attack-like API calls in production and recommends stopping production-key testing, avoiding test requests in production, and using Sandboxes.
Tinder’s rapid growth and expansion into domain-centric teams produced inconsistent API practices across services, including mixed error conventions, fragmented schemas, uneven versioning, unclear URIs, and weak API contracts. Part 1 presents standards for the RESTful APIs used across the platform, beginning with the URI pattern https://service-mesh-host-name/[version]/[service-name]/[resource]/[sub-resource] and guidance on concise, plural, kebab-cased paths. It defines path-prefix versioning, retaining the previous version until clients migrate and creating new versions only for breaking changes such as removing fields, changing types, or renaming fields. The guide also covers HTTP methods, standard and custom request headers, the X-Tinder- naming convention, and request tracing through MDC-populated identifiers and centralized logging. Request and response bodies, status codes, and enforcement tools are reserved for Part 2.
Stripe Workbench addresses the difficulty of finding and understanding errors produced by Stripe API invocations. It gives developers a view of recent errors, groups repeated failures, shows their frequency, and links summaries to request logs and actionable resolution guidance. The article describes Stripe error categories such as StripeCardError, StripeInvalidRequestError, and StripeConnectionError, then demonstrates Node.js try/catch handling that branches on the error type. It also covers webhook responses for payment_intent.payment_failed events, including retrieving event.data.object.last_payment_error, and explains how objects such as PaymentIntents, Setup Intents, Invoices, Setup Attempts, Payouts, and Refunds retain failure information for later inspection. Combined, these mechanisms support targeted responses, troubleshooting through detailed request and response data, and more reliable Stripe integrations.
The post demonstrates how Stripe Workbench’s Inspector can be used to examine a PaymentIntent throughout its lifecycle and diagnose payment workflow issues. It maps states including requires_payment_method, processing, requires_action, succeeded, and canceled, showing how the status property changes as inputs and decisions move the object through a state machine. The walkthrough creates and confirms test PaymentIntents with Stripe Shell commands, including a 3DS-required card that produces a requires_action state and a use_stripe_sdk next_action. It also describes reacting to state changes through webhook endpoints or Amazon EventBridge, using the Inspector to identify friction such as PaymentIntents stalled at requires_action and to debug abandoned payments.
The post demonstrates how to debug and fix Stripe Invoicing integration errors with Workbench, a context-aware tool available throughout the Stripe Dashboard. It uses the Overview and Errors tabs to locate a recent parameter_missing error, then examines the failed Invoice create request and identifies the missing Customer object that prevented invoice creation. The Shell and API Explorer let developers list customers, supply a Customer ID, construct and run the corrected create command, and generate an SDK request from the configured fields. Workbench’s Inspector then exposes the invoice’s JSON data map, logs, and lifecycle events; the example confirms successful payment for a zero-dollar invoice and explains that non-zero charges require Invoice Items tied to products and prices.
Stripe Invoicing’s no-code workflow hides the API calls and invoice state transitions that developers may need to inspect when debugging payment failures. Using Stripe Workbench’s Inspector, Logs, and Events tabs, the walkthrough maps object hierarchies, requests, event payloads, and previous_attributes across an invoice lifecycle. Creating an invoice in the Dashboard produces a draft Invoice, a separate Invoice Item, an automatically generated Invoice Line Item, and related creation or update events. Sending it creates a Payment Intent and finalizes the invoice from draft to open; charging captures the Payment Intent, creates a Charge, and changes the invoice to paid. Draft invoices can be deleted, while open invoices can be voided, preserving the record and canceling the Payment Intent, and the same Workbench method can be applied to other Stripe API areas.
Stripe payment methods differ in how quickly they confirm attempted payments, with cards reporting status immediately and bank debits, bank transfers, and cash-based vouchers requiring additional processing time. The post uses Stripe Workbench and its in-browser CLI shell to create Checkout sessions in test mode, submit card and ACH Direct Debit payments, and inspect emitted events. For cards, charge.succeeded and payment_intent.succeeded signal successful payment, while integration code must inspect checkout.session.completed payment_status rather than confuse it with the session status. With delayed methods, checkout.session.completed can show unpaid before checkout.session.async_payment_succeeded or checkout.session.async_payment_failed arrives; the former changes payment_status to paid, and production processing can take days.
Mae Santos, Head of Critical Applications and Data Reliability Engineering at Two Sigma, leads a global team across New York, Houston, London, and Tokyo to support critical applications and data pipelines. While software teams frequently prioritize functional features over operational stability, designing systems with reliability in mind from the beginning allows for progressive enhancements without complete rewrites. System architecture should be guided by concrete goals across four key dimensions: availability, observability, scalability, and supportability. In addition, mapping out interconnections among systems, infrastructure, data, and human processes helps teams manage dependencies effectively. Applying automation across support and delivery workflows further reinforces reliability by minimizing human error and accelerating execution.
Grab's in-house risk management platform, GrabDefence, relies on ingesting large volumes of upstream data to drive real-time heuristic rules and data science models. To prevent data discrepancies and missing information from degrading fraud detection, the team implemented a real-time data observability pipeline. The solution uses Apache Flink SQL alongside custom table functions like JSONEXPLOAD to flatten nested JSON structures and aggregate metrics over 5-minute tumbling windows. Processed metrics are sent to Datadog, where counters are grouped by source stream and evaluated using anomaly detection algorithms. Alerts are routed directly to Slack, reducing anomaly detection latency from days or weeks down to within the same day or hour.
Standard infrastructure monitoring tools track CPU and memory usage at the host or container level, obscuring the precise resource consumption of individual Spark jobs on shared instances. To achieve granular observability, the Iris platform gathers job metrics directly at the Java Virtual Machine level without requiring changes to user application code. Data collection relies on Uber's JVM Profiler for deep JVM, thread, and memory pool diagnostics alongside sparkMeasure for stage and task execution statistics. Collected metrics route asynchronously through an Apache Kafka queue to avoid execution bottlenecks, feeding a Telegraf, InfluxDB, and Grafana stack for real-time monitoring while archiving to a data lake for offline analytics. This multi-tiered telemetry enables engineering teams to identify over- or under-provisioned jobs and optimize ETL resource allocations.
The best engineering reads, once a week.