Accountability: Named Owner or Enforced Mechanism?
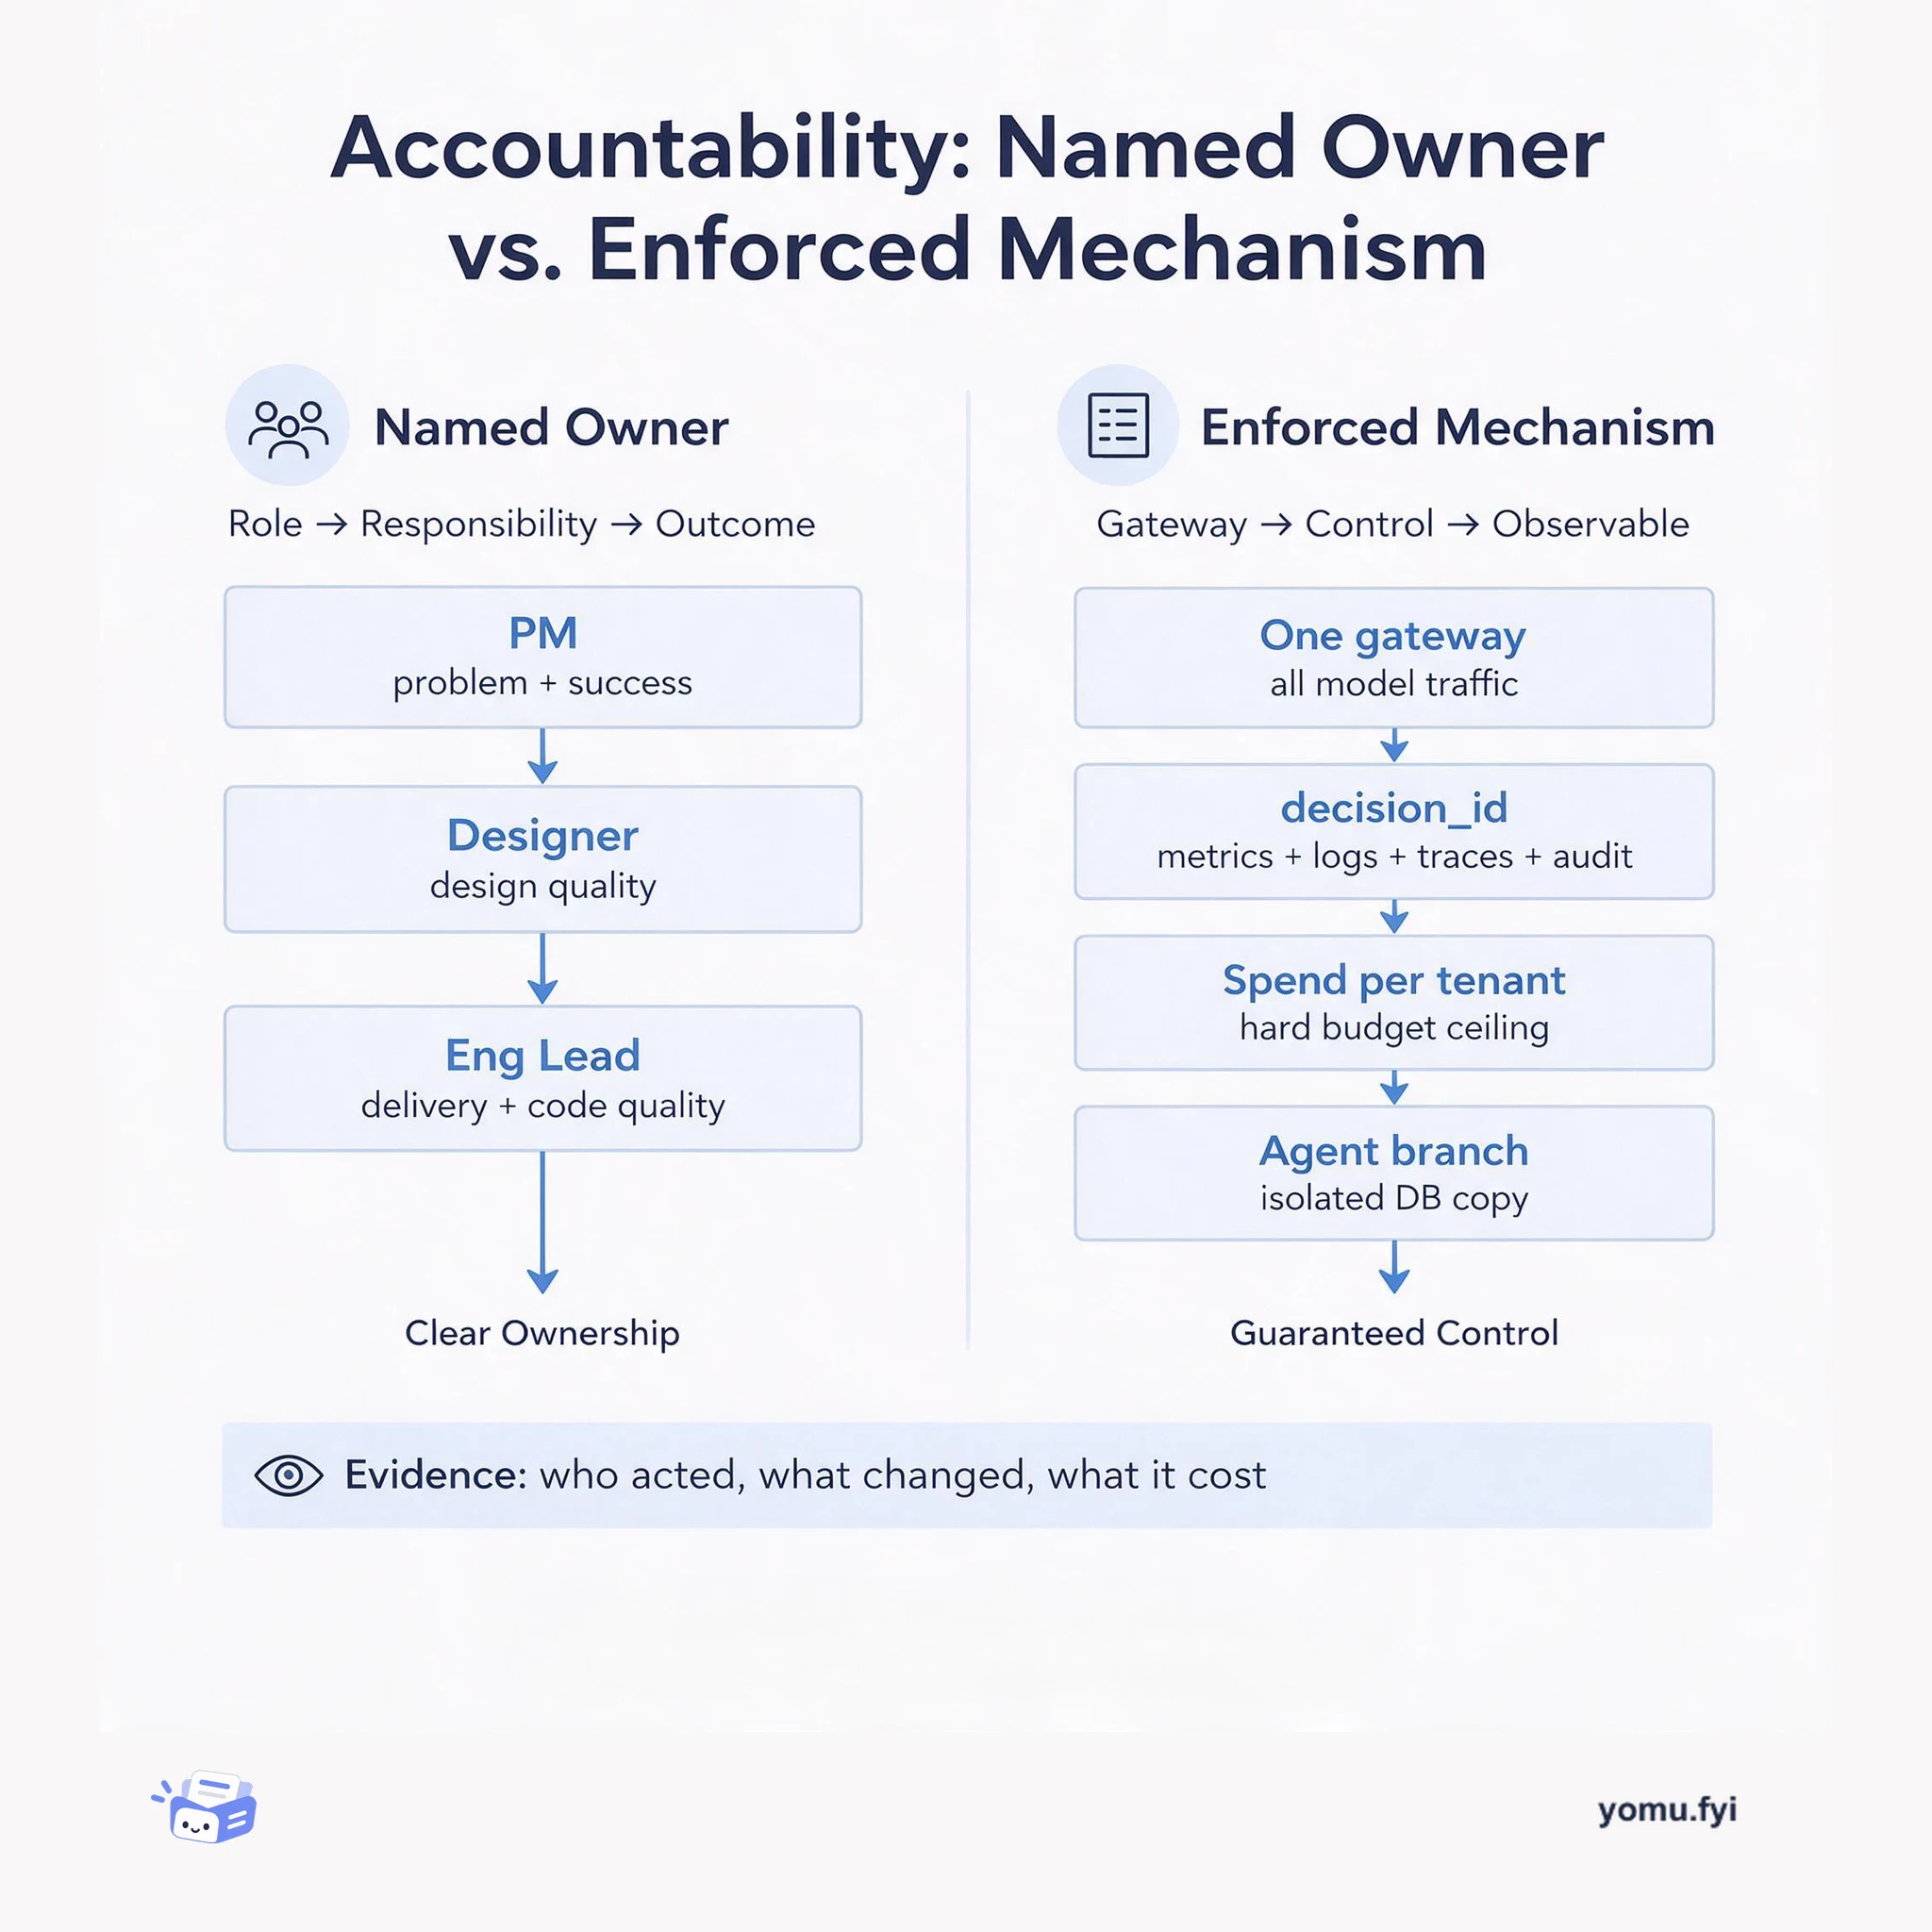
A side-by-side comparison of the two accountability models engineers actually rely on: a named human owner per outcome, and system-enforced traces, budgets, and isolation.
Loading…
Topic
248 posts about Observability. Every summary links to the original.
See the idea
A side-by-side comparison of the two accountability models engineers actually rely on: a named human owner per outcome, and system-enforced traces, budgets, and isolation.
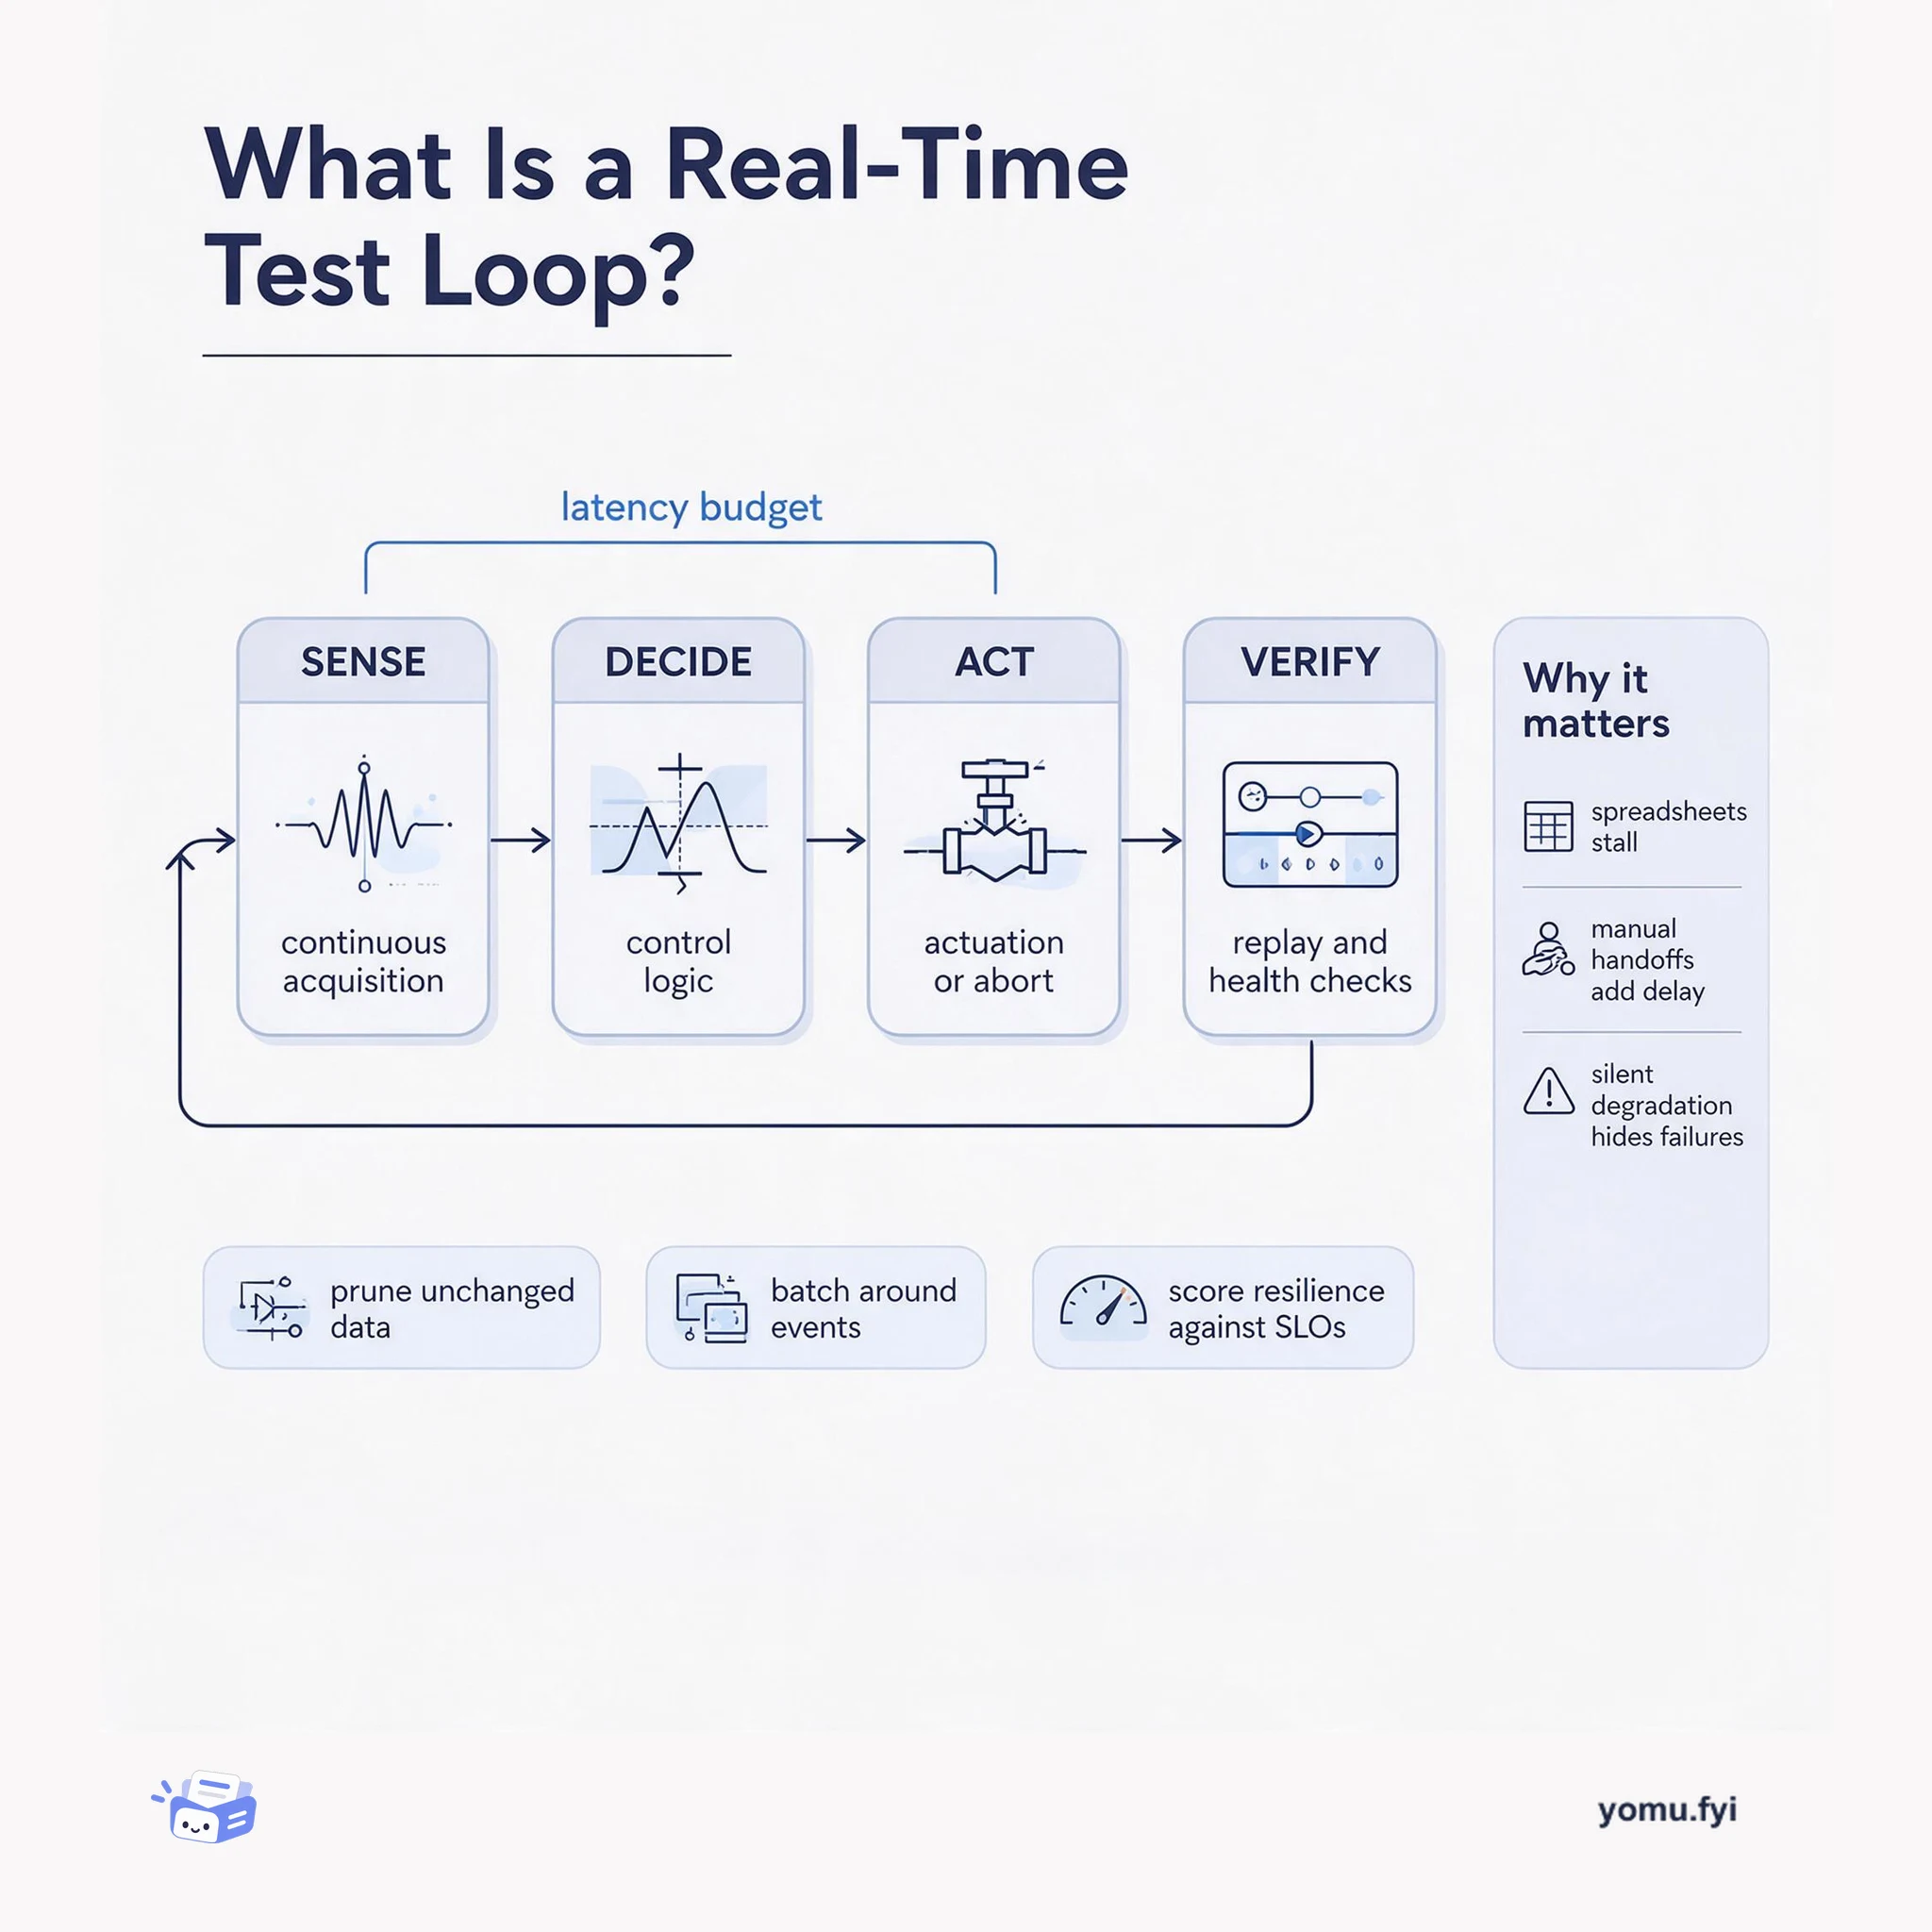
A real-time test loop is the closed path from sensor acquisition to control action and back to verification. This explainer maps its four parts and the latency budget that binds them.
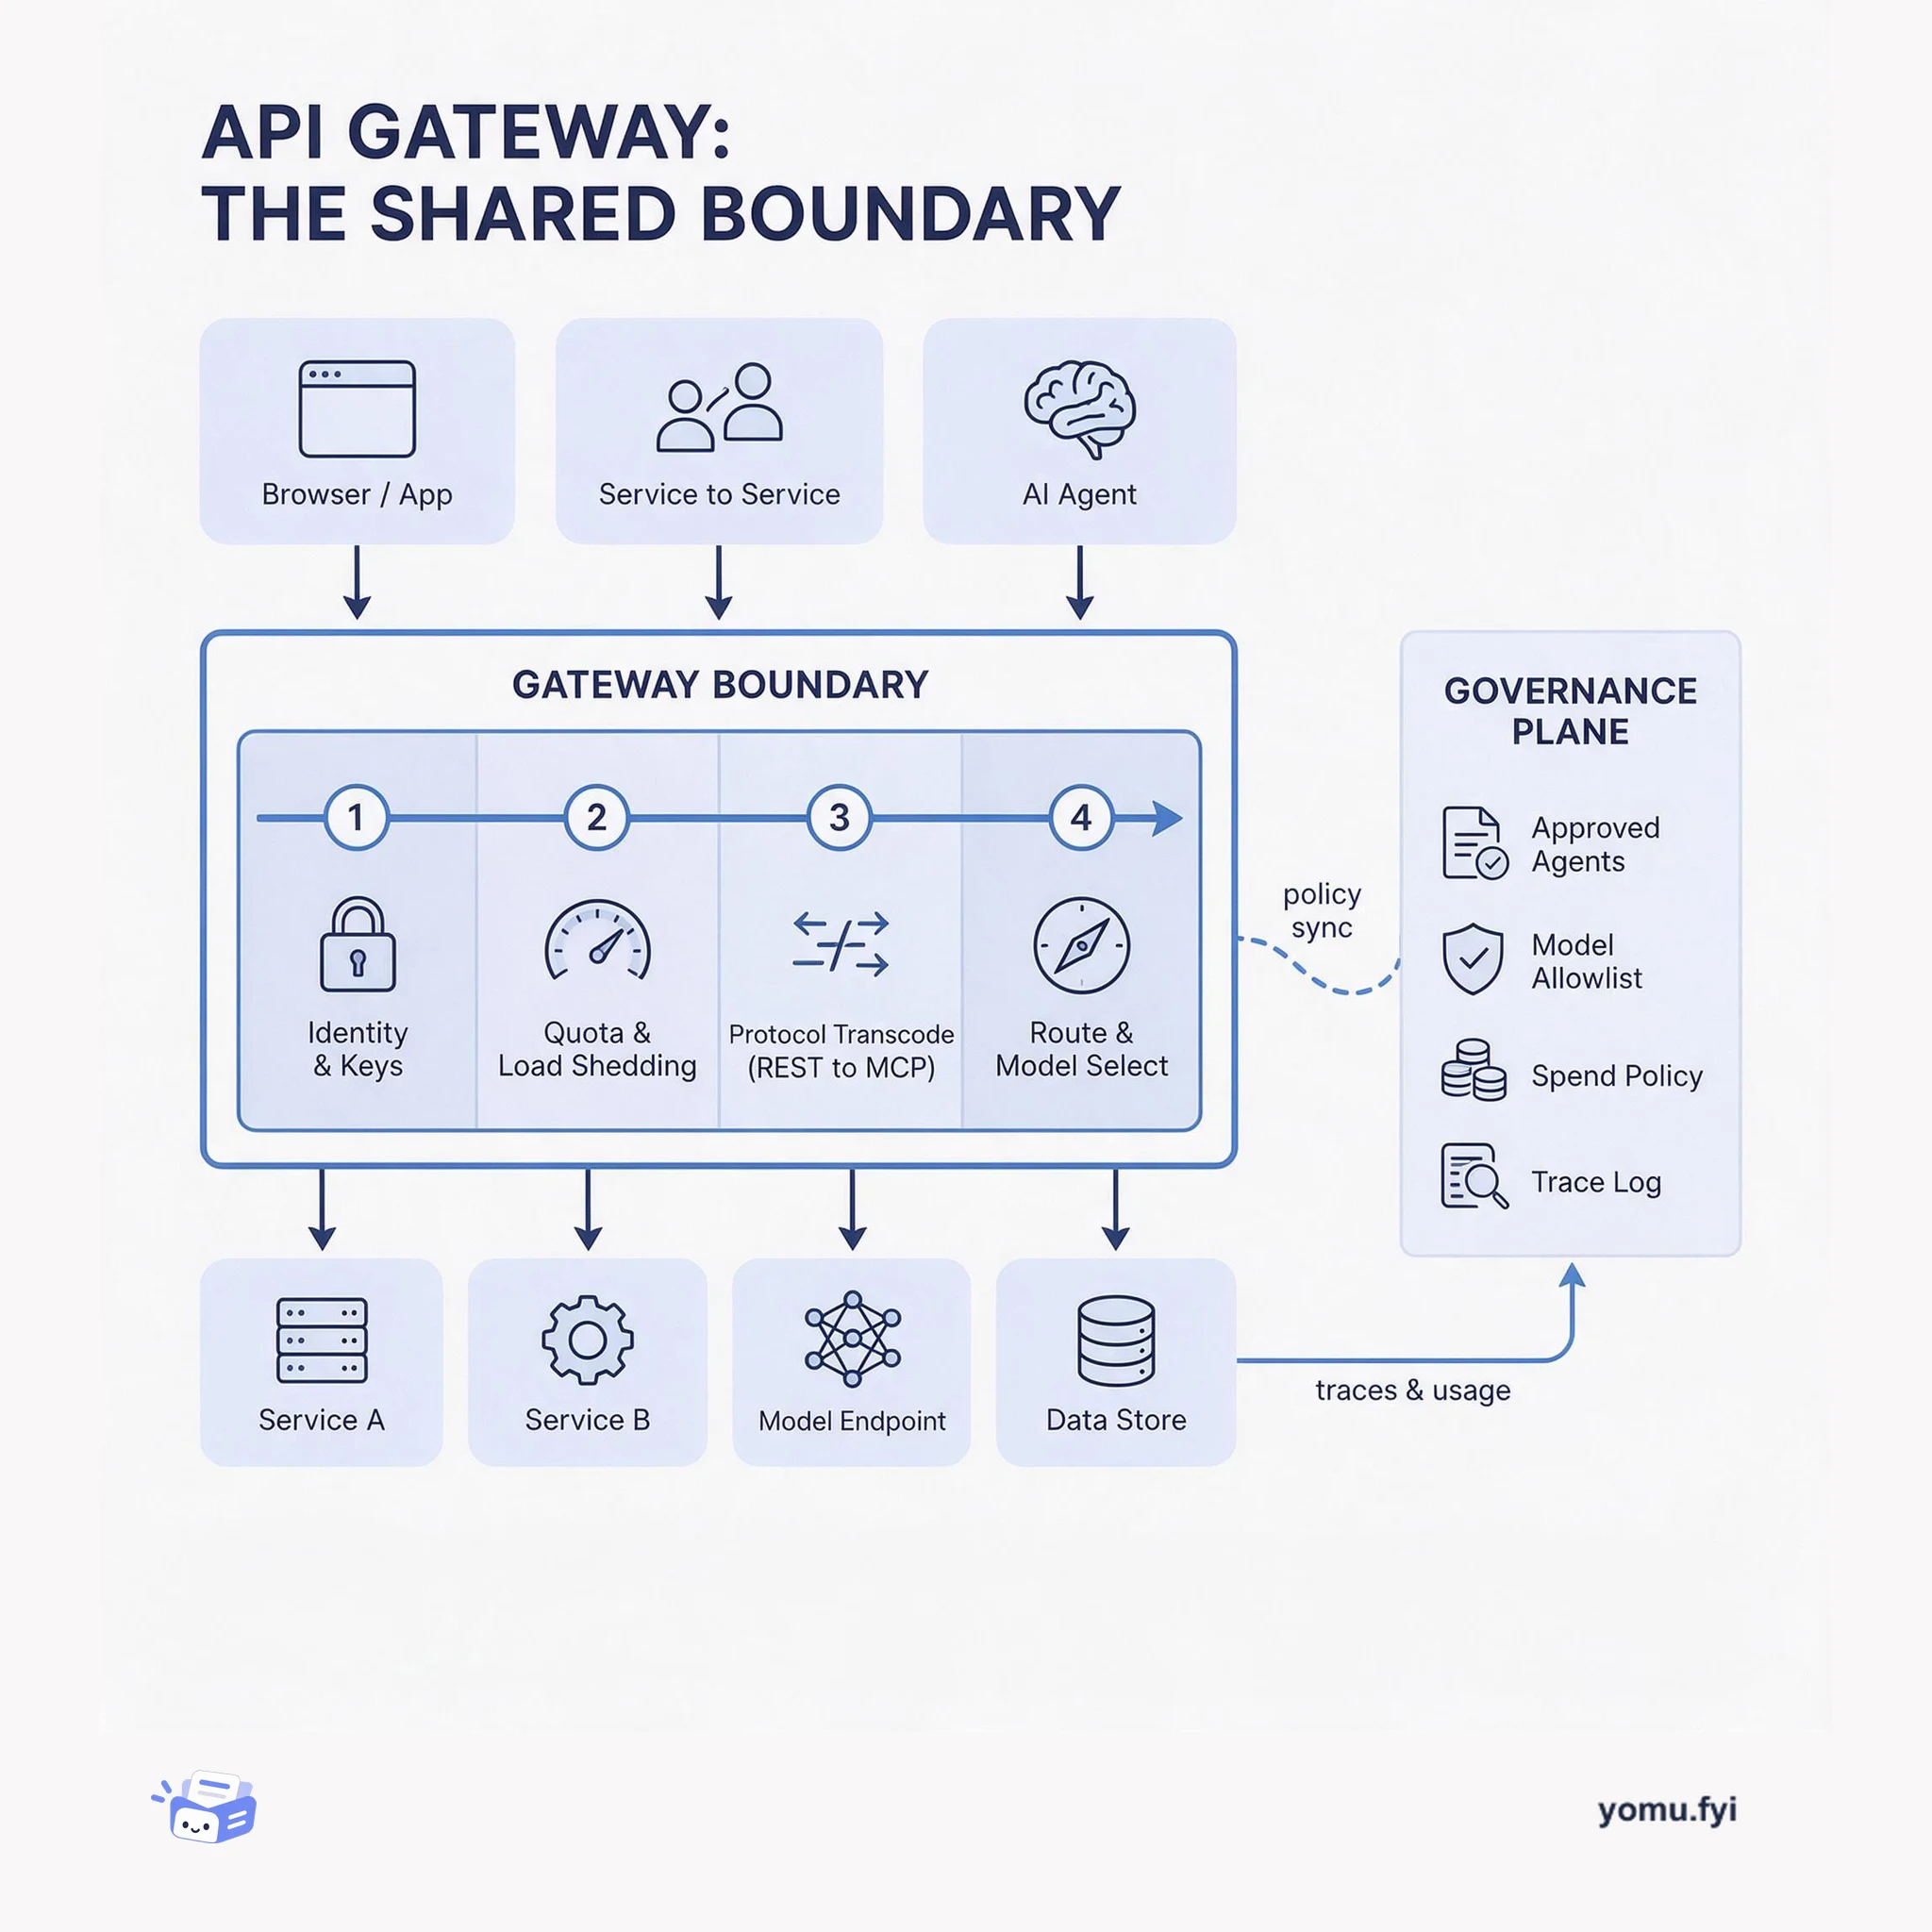
The API gateway is the single boundary where protocol translation, auth, quotas, and routing become shared policy instead of per-service code. This layered diagram shows what belongs there and why.
The Good Stuff
Paid picks we use ourselves. Links carry a referral code — a subscription through one earns us a commission at no extra cost to you.
Newest first
Sentry is now integrated into Stripe Projects, enabling developers and coding agents to discover, provision, and manage Sentry services directly through the command-line interface. Running initialization and addition commands automatically sets up accounts, generates necessary environment variables like auth tokens and DSNs, and scaffolds agent skill files for tools such as Claude Code and Cursor. The integration supports plan upgrades, downgrades, and the addition of the Seer AI debugging assistant with billing handled through existing Stripe payment methods. Additional CLI capabilities include minting single-use magic login URLs for the Sentry dashboard, managing multi-member team collaboration tied to Stripe organizations, and rotating project credentials directly into local environment files.
Thumbtack evaluates generative AI features across customer and service professional experiences to prevent unsupported claims, tone inconsistencies, and safety issues. The engineering organization transitioned from decentralized evaluation efforts to a dedicated cross-functional Evals team that provides shared infrastructure while preserving product team autonomy. System architectures combine rule-based checks, AI-as-a-judge scorers powered by DeepEval, trust and safety assessments, and crowdsourced human reviews. Teams leverage three parallel orchestration paths, including an MLflow-tracked stack, nightly Databricks batch jobs integrated with data warehouses, and multi-layer human-in-the-loop pipelines. Future milestones target centralized LLM judge registries, full task journey evaluations, automated judge-writing workflows, and cost-aware evaluation orchestration.
ClickHouse introduced a redesigned full-text search powered by inverted indexes that feeds matching documents directly into its vectorized analytical engine for observability and log analytics workloads. To evaluate this capability, the open-source versions of ClickHouse and Elasticsearch were benchmarked on single-node AWS EC2 instances across synthetic OpenTelemetry log datasets scaling up to 50 billion rows. The benchmark evaluated nine representative query patterns combining text search with filtering, grouping, counting, and time-series aggregations under both cold and hot cache conditions. ClickHouse achieved a roughly fivefold smaller storage footprint on disk while running cold queries four to six times faster and hot queries approximately 1.7 to 2.6 times faster than Elasticsearch. Furthermore, ClickHouse ingested the 50-billion-row dataset in under four hours out of the box, whereas the tuned Elasticsearch setup required approximately five days.
LLM applications are presented as production systems that extend beyond chatbots by connecting foundation models to external data, tools, APIs, memory and workflows. Modern categories include assistants and copilots, retrieval-augmented generation (RAG), autonomous agents, multi-agent systems and local or on-device inference, each with distinct capabilities and trade-offs. A typical RAG pipeline uses vector search over a curated knowledge base, then supplies retrieved passages to the model; chunking, source freshness and retrieval accuracy affect results. Production systems also require orchestration, evaluation, observability, governance, guardrails, audit trails and human-in-the-loop checkpoints, especially when agents can call tools or execute workflows. The source distinguishes prompt engineering, which guides behavior without changing model weights, from fine-tuning, which adapts models to domain-specific tasks, and describes a unified path combining data, models, retrieval, orchestration, evaluation and governance for production deployment.
OpenTelemetry Collector documentation is often fragmented across separate contrib repositories as individual README files, making component configuration difficult and time-consuming to navigate. To address this friction, the team created otel.fyi as a dedicated platform to aggregate, simplify, and structure documentation from across the ecosystem. The implementation parses contrib repositories to pull configuration examples and normalize metadata across receivers, processors, exporters, and extensions into a unified format. By surfacing structured component information upfront, the site allows practitioners to assemble working configurations rapidly without digging through multiple GitHub repositories. Originally developed for internal operational workflows, the platform has been released publicly to assist the broader community, with future plans to introduce an AI assistant.
AI token spend is volatile, consumption-based, and distributed across teams, making usage and cost difficult to monitor. Ramp's pipeline ingests LiteLLM and OpenRouter events through authenticated, tenant-scoped webhooks, Kafka, and ClickHouse, then aggregates them for REST dashboards and AI-generated forecasts. LiteLLM uses callbacks with token counts and metadata, while OpenRouter sends OTLP traces; ReplacingMergeTree deduplicates replayed events using business_id, source, and event_id. Customers can connect gateways with an API key, configure LiteLLM callbacks or OpenRouter Broadcast, and pass attribution metadata. The resulting visibility supports breakdowns by provider, model, department, user, project, and use case, and exposed phantom Gemini reasoning tokens after a LiteLLM upgrade, geo pricing premiums, runaway loops, and prompt bloat.
Deployment scripts can introduce dangerous circular dependencies when they rely on services or assets from platforms that are currently experiencing outages. Blocking network access at the host level is impractical because stateful nodes continue serving live traffic during rolling deployments. To solve this, GitHub isolates deploy scripts into dedicated Linux cGroups and attaches custom eBPF programs via the cilium/ebpf Go library. The system uses socket-address hooks to redirect DNS queries to a userspace proxy that checks a domain blocklist, while egress packet hooks map DNS transaction IDs to process IDs. This approach successfully prevents deploy-time circular dependencies, provides full command-line audit logs for blocked requests, and speeds up incident recovery.
Databricks Unity AI Gateway provides a governed way to connect agents to external Model Context Protocol (MCP) servers while integrating management with Unity Catalog. The post addresses provider-specific OAuth app registration, client secrets, token refresh, permission auditing, and the lack of centralized visibility into agent access. It describes registering an external MCP server, choosing per-user OAuth or a shared principal, selecting GitHub, and letting Databricks handle OAuth registration, token exchange, and refresh; connections can then be tested in AI Playground or with DatabricksMCPClient and deployed through Agent Bricks. Unity Catalog supplies permissions and audit records, while MLflow Tracing captures requests and tool interactions, and supported providers include Glean, GitHub, Atlassian, Google Drive, and SharePoint across AWS, Azure, and GCP.
Unity AI Gateway extends Unity Catalog’s permissions, auditing, and policy controls to agentic workflows involving LLMs, MCP servers, and APIs. The release addresses limited visibility across multi-step actions with on-behalf-of user execution for MCP calls, configurable guardrails, and consistent governance across model providers without separate configurations for each provider and model choice can vary by task. Guardrails can detect PII, prompt injection, unsafe content, and data exfiltration, while logs capture identities, timestamps, MCP details, dollar costs, payloads, latency, status codes, and errors. OpenAI-compatible APIs, fallback models, and endpoint-, user-, or group-level rate limits support production operation, although some capabilities are in Beta or rolling out and availability is limited to supported Databricks regions.
ClickHouse is widely used with Grafana for observability and real-time analytics, but requiring users to write raw SQL creates onboarding and exploration friction. To simplify the user experience, planned updates to the ClickHouse Grafana plugin introduce native interfaces such as click-to-filter actions, categorized OpenTelemetry attribute displays, and guided variable editors. A new compact search mode leverages the hasToken function for fast log filtering, while a visual metrics builder simplifies aggregating OpenTelemetry and Kubernetes metrics without manual queries. Prebuilt dashboards for logs and traces will accelerate initial setup alongside automated annotations derived from service version changes and Kubernetes lifecycle events. Future prototypes also explore bidirectional SQL AST parsing for seamless query editing, JWT user identity forwarding for fine-grained access control, and conversational query generation.
Cursor introduces canvases, allowing agents to represent information through interactive visual interfaces instead of chat text or markdown. In the Agents Window, these durable artifacts sit alongside tools including the terminal, browser, and source control, and agents can build dashboards, PR review interfaces, architecture diagrams, and eval-failure investigations. Canvases use a React-based UI library with first-party tables, boxes, diagrams, and charts, plus existing Cursor components such as diffs and to-do lists; skills can teach agents to create specific canvas types. Cursor reports that combining observability data from Datadog, Databricks, and Sentry MCPs with local debug files makes time-series analysis easier, while eval skills group rollout failures to expose hidden harness bugs. The company is also using canvases to visualize autoresearch progress and current hypotheses during client-performance experiments.
ClickStack announced several observability updates in its March 2026 release to improve root cause analysis, dashboard organization, and local development. The Event Deltas tool now displays baseline span distributions immediately, uses deterministic cityHash64 sampling for trace heatmaps, and applies proportional comparison scoring to accurately evaluate attributes across uneven sample sizes. Furthermore, users can directly include or exclude values from attribute comparison bars to streamline query creation during incident investigations. Dashboard capabilities expanded with a curated OpenTelemetry template gallery, multi-value filtering with optional lookup WHERE clauses, and broadened metric display units. Finally, local mode introduces browser localStorage persistence through createEntityStore, allowing developers to save dashboards and favorites without a running backend API.
A Solutions Architect at ClickHouse built ClickShop, a full-stack retail analytics platform, within a few days using Cursor to demonstrate production-level capabilities beyond static slides. The platform pairs ClickHouse for sub-second analytical queries across billions of rows with PostgreSQL for transactional workflows, using ClickPipes for real-time change data capture synchronization. LibreChat orchestrates 18 persona-tailored AI agents, while dual observability layers—ClickStack for OpenTelemetry infrastructure metrics and Langfuse for LLM prompt and cost tracking—store their telemetry directly in ClickHouse. Developing with an AI-assisted IDE was accelerated by open-source documentation and community skills, though it required continuous human review to handle unintended code refactoring and token consumption.
Ramp’s ML Platform team needed to separate flexible model development in ml-pipelines from the Intelligence Platform’s 99.9%+ uptime and low-latency requirements. The internship project, Bring-Your-Own-Model-Weight Serving (mw-serve), built a dedicated serving layer that pulls model weights from MLflow and a training-environment base image from ECR, then runs each model in an isolated instance. To protect uptime, it added deployment safeguards, pre-traffic liveness checks, and monitors, while latency work instrumented client TCP/TLS connections and server processing. The investigation traced extreme tail latency to connection churn, which improved with longer keepalives and startup warmups, and to garbage-collection pauses associated with memory drops; tuning thresholds and freezing objects removed more outliers. By the final day, one Intelligence Platform model was serving production traffic through mw-serve, with additional models in shadow testing.
The ClickHouse community and development team participated in FOSDEM 2026 in Brussels, hosting a community dinner and delivering technical presentations across multiple developer tracks. Presentations covered a range of engineering topics, including building geospatial analytical applications with Leaflet and ClickHouse, as well as integrating LLVM XRay to dynamically hot-patch production logging without redeployments. Additional ClickHouse sessions addressed the engineering challenges of integrating Rust libraries into large C++ codebases, optimizing low-level memcpy routines, and implementing specialized inverted indexes for large-scale text processing. Contributed community sessions detailed workflows for upstream patches in MariaDB and Postgres, alongside WebShield, an open-source Python daemon that streams web accelerator access logs into ClickHouse for bot analysis.
Observability practices increasingly depend on data sampling, short retention windows, and rollups to control storage costs. While human operators historically compensated for these compromises with intuition, AI agents lack implicit operational context and require full-fidelity telemetry to diagnose issues and justify conclusions. Head sampling drops unobserved spans early, tail sampling risks missing implicit non-error anomalies, and aggressive log expiration prevents long-term cyclical trend analysis. Addressing these constraints requires decoupling storage and compute via high-compression object storage and dedicated compute pools. Deploying real-time analytical databases such as ClickHouse enables high-concurrency, low-latency SQL querying, log clustering, and structured in-database summarization necessary for automated reasoning loops.
ClickHouse 26.3 delivers twenty-seven new features, forty performance optimizations, and over two hundred bug fixes. Common table expressions can now be materialized into temporary tables via the MATERIALIZED clause when enabled, evaluating subqueries once to reduce query execution times and peak memory usage. The query optimizer expands join reordering beyond inner and left or right joins to include anti, semi, and full joins when table statistics are available. In addition, user-defined functions can run compiled WebAssembly code inside sandboxed Wasmtime runtimes. Storage for the Map data type also introduces hash-based bucketing during background merges, accelerating single-key lookups by two to forty-nine times without slowing initial inserts.
Respan scaled its LLM gateway and observability platform from hundreds of daily requests to 50 million daily events, causing its original Django and Postgres architecture to stall under transaction contention at 50 to 100 requests per second. To overcome Postgres write-ahead logging bottlenecks, the team migrated the ingestion and analytics pipelines to ClickHouse Cloud. Engineers minimized row sizes by truncating large prompt text and writing structured metrics to MergeTree tables, then built incremental minute- and hour-level materialized views alongside scheduled refreshable views for user metadata. Distributed tracing spans are ingested asynchronously with analytical parent-child resolution, utilizing functions like argMax rather than the FINAL modifier to prevent costly table merges. This architectural shift allows Respan to achieve sub-second search across tens of millions of records and support customer dashboards with predictable query performance.
Managed ClickStack has introduced Role-Based Access Control (RBAC) to replace a legacy model where all users shared identical instance-wide permissions or required duplicate HyperDX instances for isolation. Integrated with ClickHouse Cloud for identity management, the new system allows administrators to assign users to roles governed by three access tiers: no access, read, and manage. Permissions apply across platform resources including dashboards, saved searches, sources, alerts, webhooks, and notebooks, with support for fine-grained rules matching names, IDs, or tags. While table-level source restrictions work through ClickStack, row-level access currently depends on separate ClickHouse SQL console roles, which the team intends to unify directly inside ClickStack in future releases.
Industry perspectives on AI coding agents remain divided between dismissal and excessive automation claims. ClickHouse integrated agentic coding across internal workflows, progressing from simple boilerplate scripts to active backend C++ development. Engineers primarily use command-line agents such as Claude Code with Claude Opus 4.5 and Codex CLI alongside observability platforms like Langfuse and Librechat. While agents effectively investigate continuous integration logs, generate internal dashboards, and assist with small C++ tasks, they lack architectural competence and require rigorous code review. ClickHouse treats agents as pair programmers for contained tasks, retaining human ownership over product strategy, attention to detail, and core code quality.
The best engineering reads, once a week.