Accountability: Named Owner or Enforced Mechanism?
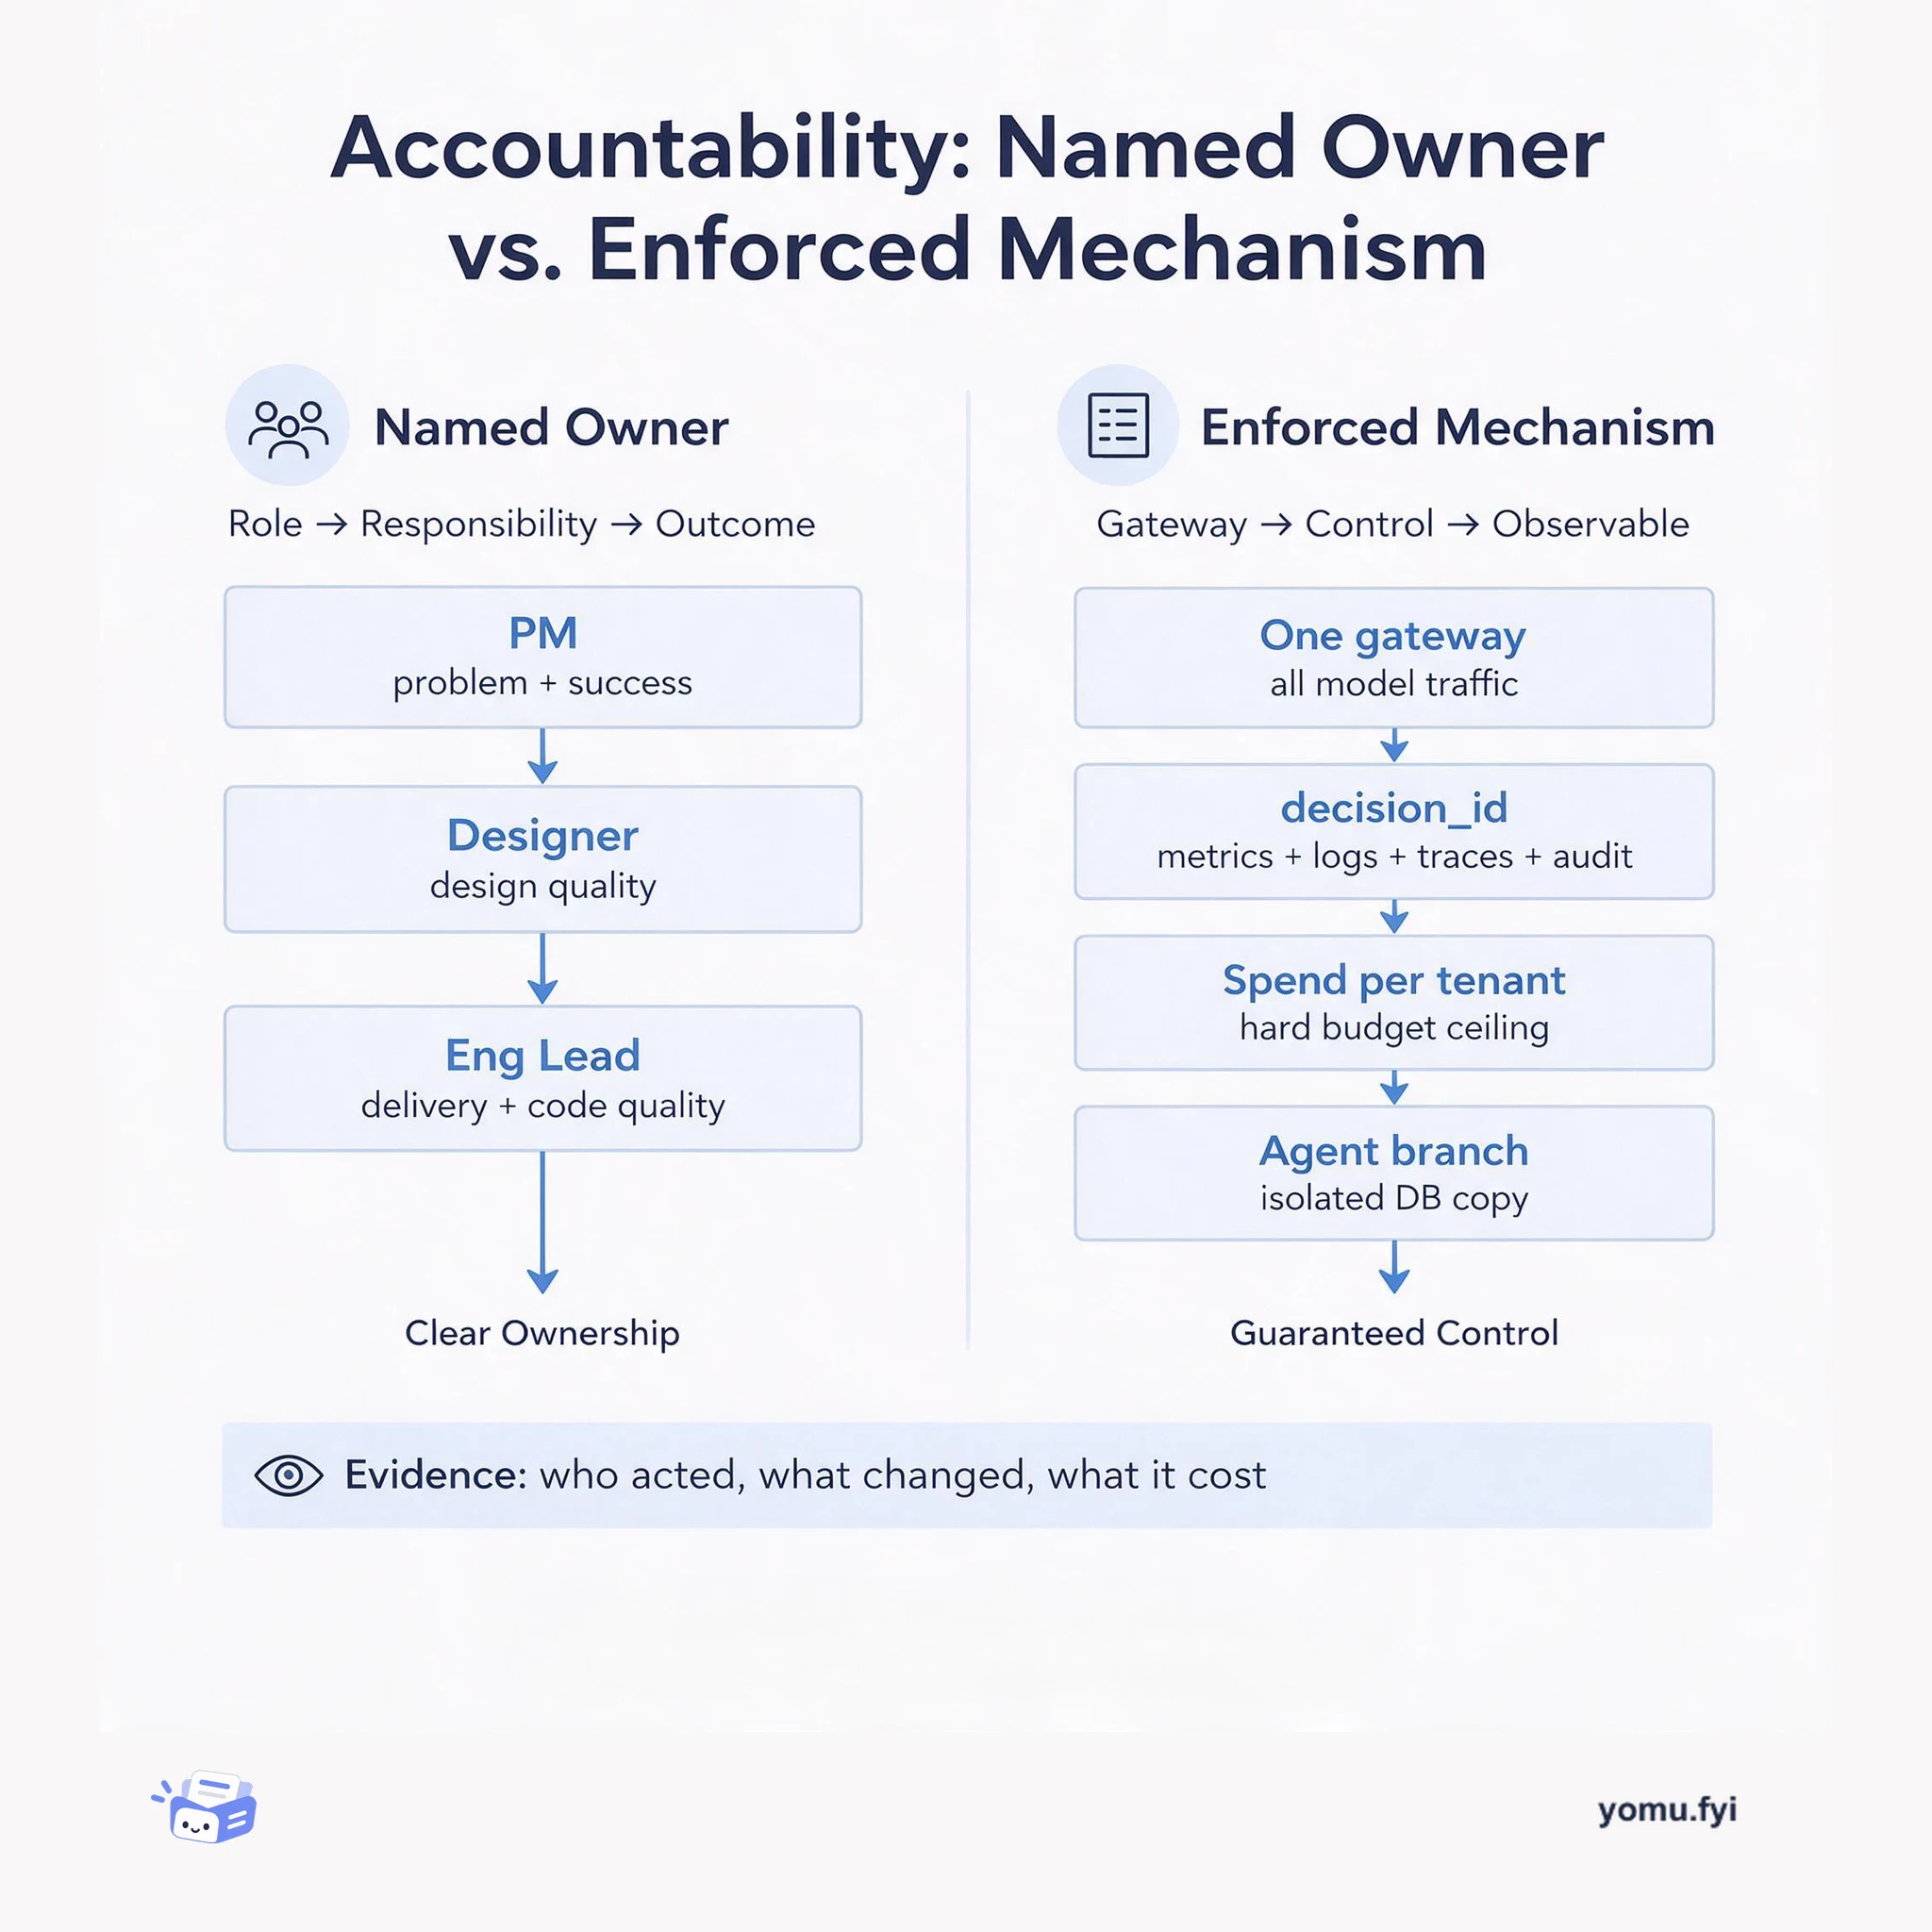
A side-by-side comparison of the two accountability models engineers actually rely on: a named human owner per outcome, and system-enforced traces, budgets, and isolation.
Loading…
Topic
248 posts about Observability. Every summary links to the original.
See the idea
A side-by-side comparison of the two accountability models engineers actually rely on: a named human owner per outcome, and system-enforced traces, budgets, and isolation.
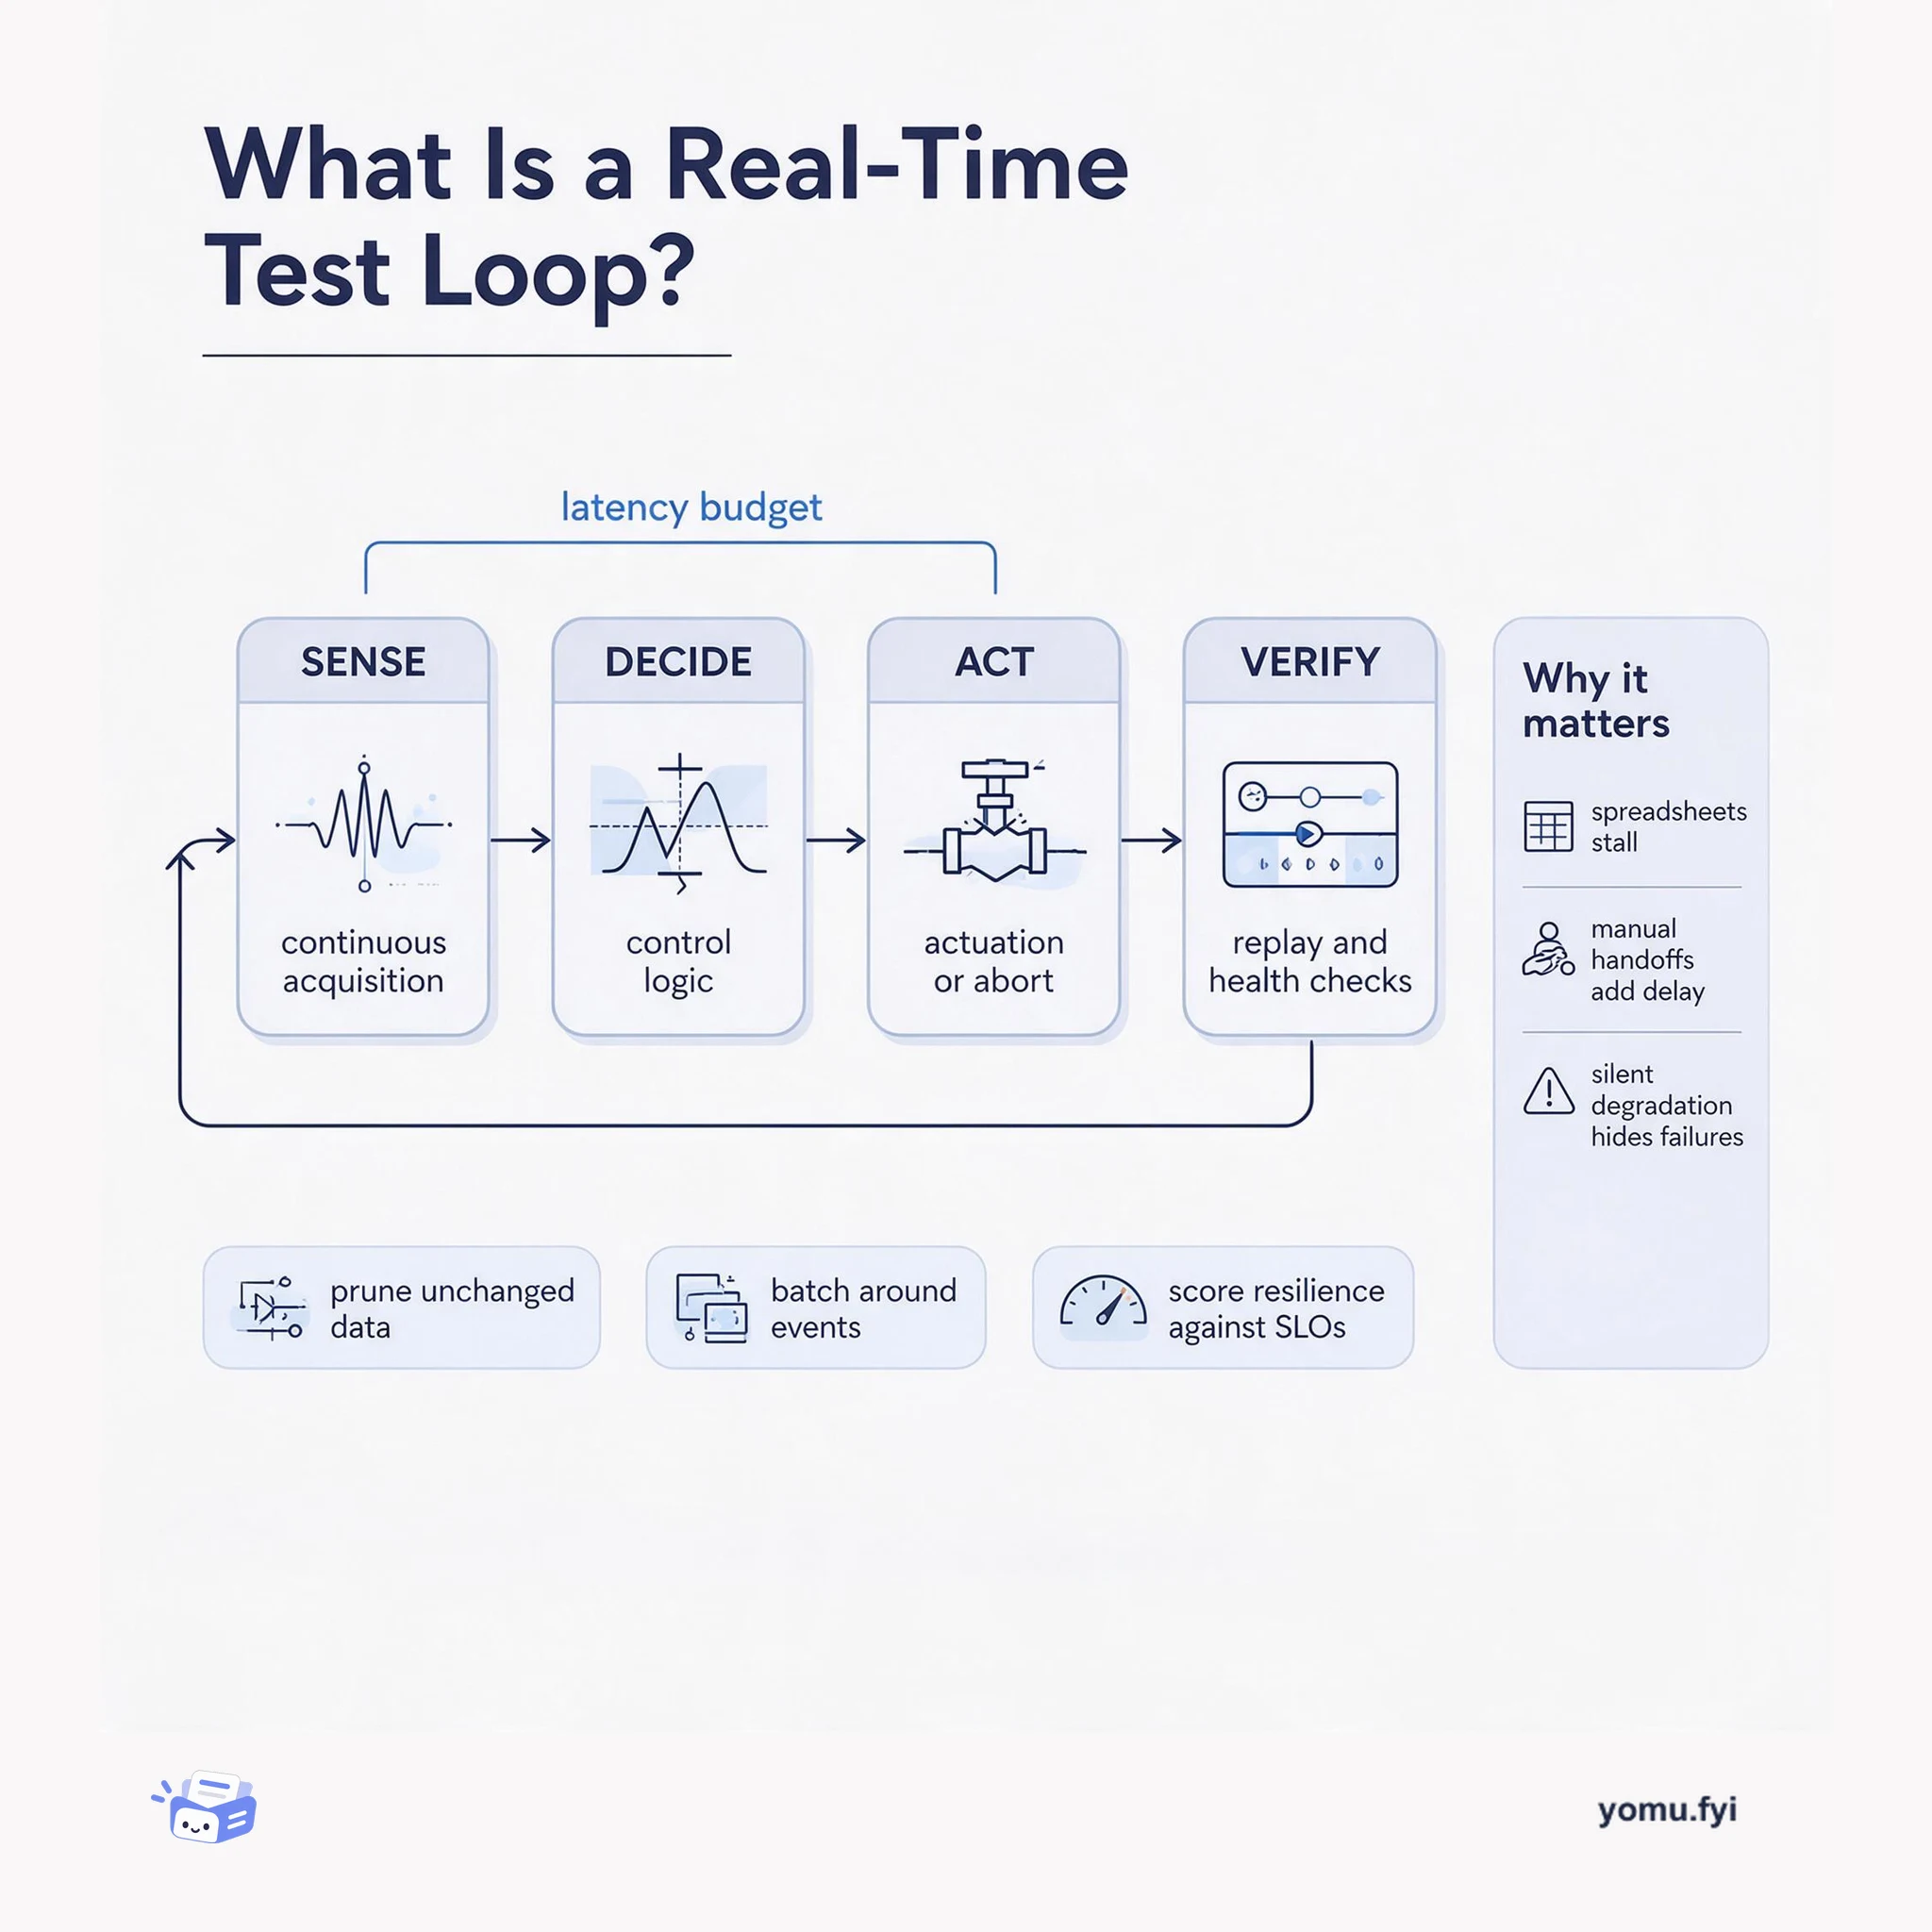
A real-time test loop is the closed path from sensor acquisition to control action and back to verification. This explainer maps its four parts and the latency budget that binds them.
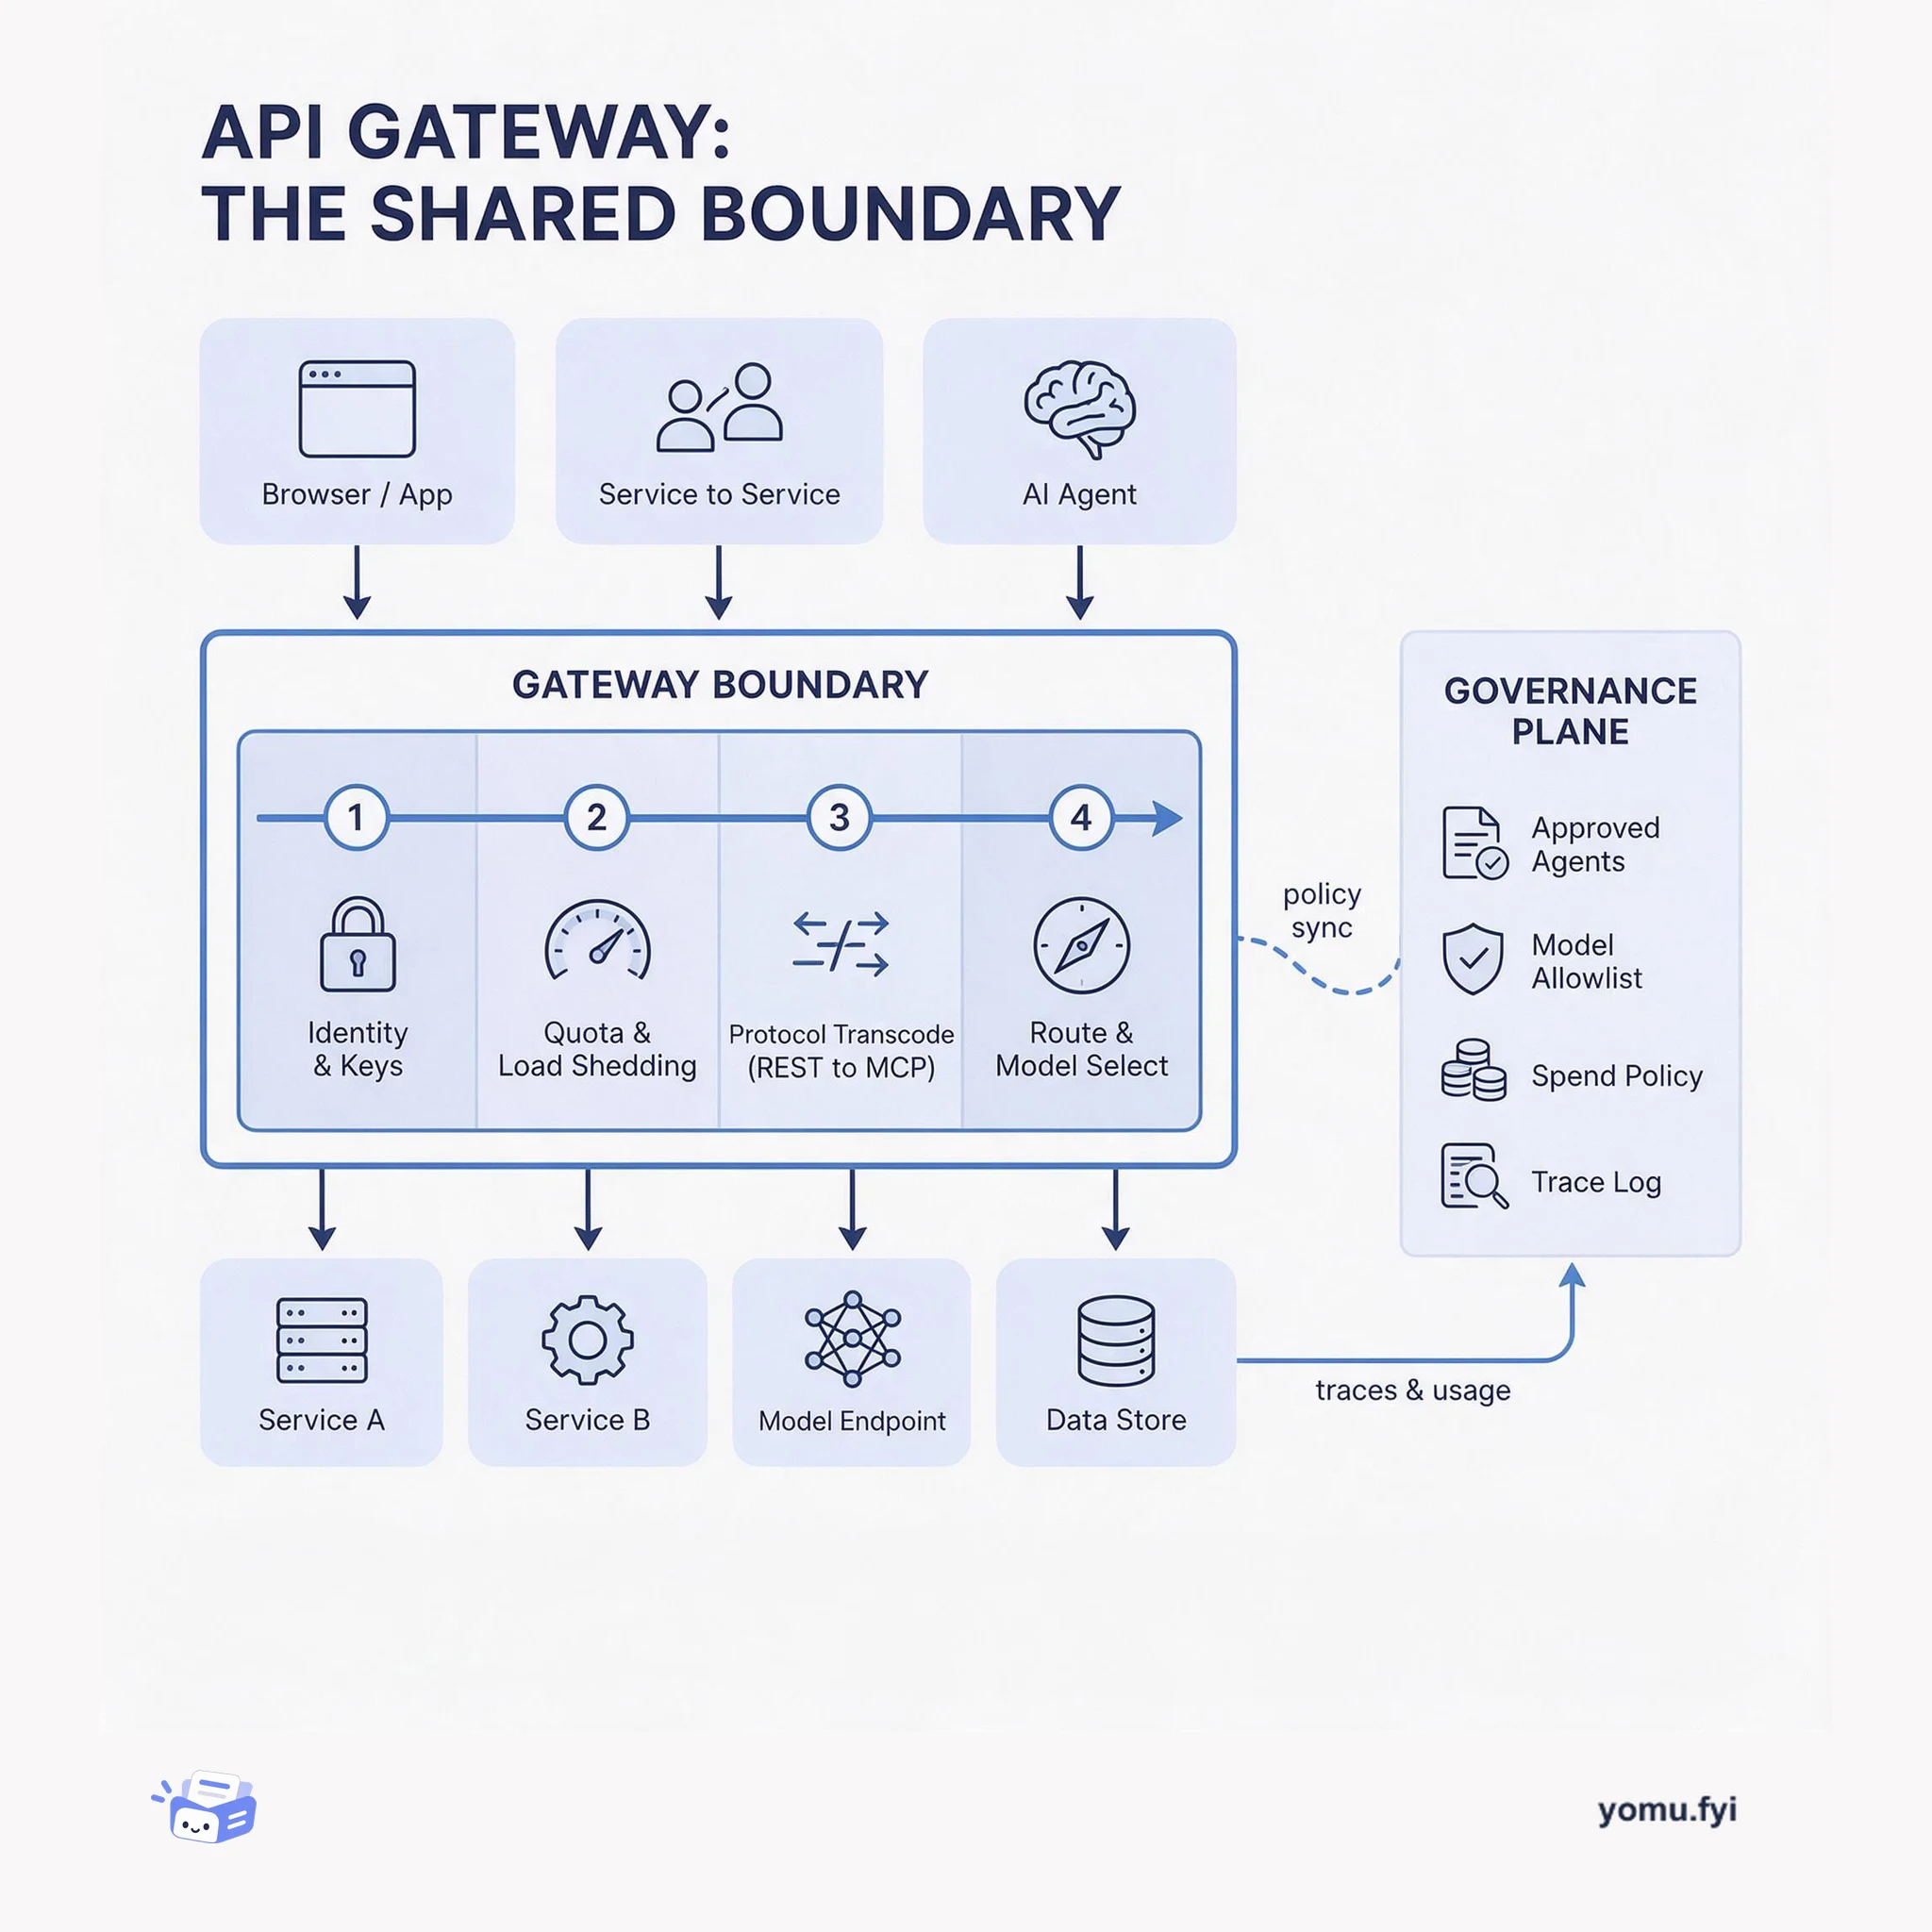
The API gateway is the single boundary where protocol translation, auth, quotas, and routing become shared policy instead of per-service code. This layered diagram shows what belongs there and why.
The Good Stuff
Paid picks we use ourselves. Links carry a referral code — a subscription through one earns us a commission at no extra cost to you.
Newest first
ClickStack's April release introduces several core enhancements across querying, alerting, and dashboard visualization capabilities. The platform added SQL-powered alerting, allowing teams to express complex statistical rules like rolling baselines and anomaly detection using native ClickHouse SQL and window functions without external pipelines. To improve search and filtering performance across common observability workloads, the default otel_logs schema was redesigned with ClickHouse text indexes and adjusted ordering keys. Furthermore, heatmaps transitioned into a first-class chart type inside the shared visualization system for latency distribution tracking. The update also delivers persistent alert execution error reporting, expanded threshold comparison operators, and per-series number formatting across dashboards.
Unity AI Gateway is expanding runtime governance for production AI agents, model calls, and MCP tool interactions as teams face rising costs, unclear behavior, and limited control. The Beta adds LLM-based guardrails, token-level cost attribution with per-user alerts and hard budget limits, payload logging, and MCP service policies. Guardrails use a model and prompt to evaluate inputs, outputs, or both in real time, while inference tables and Unity Catalog system tables centralize governed records of usage and interactions. For MCPs, administrators can define SQL policies as Unity Catalog functions using agent identity, user context, and request parameters to constrain tool access and sensitive actions. The capabilities are available in Beta, with payload logging and service policies offered through gated enrollment, and are intended to improve observability, compliance, and cost control.
Inside D. E. Shaw group, a global investment and technology development firm, millions of compute workloads run monthly across its high-performance computing infrastructure. To support capacity planning and resource allocation, it collects task-level metrics for requested and utilized compute, producing millions of distinct time series that its previous observability platform could not accommodate. Engineers benchmarked databases on identical hardware and datasets; ClickHouse ingested approximately 3.5 million samples per second on one node versus roughly 480,000 for a competing solution, while similar queries completed in seconds instead of timing out. They retained InfluxDB line protocol, batched messages into ClickHouse, and built disk-based tooling to transform and stream historical data; the resulting four-server NVMe cluster stores about 68 TB compressed and sustains 530k records per second on average. Materialized views support capacity-planning dashboards, while OpenTelemetry tracing extends the platform to other observability workloads, with SQL migration and data modeling requiring engineering effort.
Traditional time-series databases like Prometheus experience write amplification, memory overhead, and operational challenges when high-cardinality label combinations churn rapidly. ClickHouse alters these economics by abandoning dedicated series objects in favor of a wide events model, storing telemetry as rows in columnar tables with dynamic Map attributes and metric measurements. Dynamic attributes can be handled using sharded Map types alongside materialized columns and text indexes for frequently queried labels. This design trades ingestion overhead for query-time processing, relying on columnar compression, partition pruning, and parallel scans to compute aggregations on demand. ClickHouse avoids the ingest-side bottlenecks of high cardinality, though Prometheus remains preferable for moderate cardinality, native PromQL semantics, and single-series lookups.
Observability systems frequently encounter high cardinality when metrics contain numerous unique label combinations across multidimensional cloud infrastructure. In Prometheus, every unique label combination instantiates an independent time series that incurs metadata overhead, requires in-memory memSeries registration, and continually expands inverted index posting lists. The ingestion engine stores samples in two-hour Head blocks using compressed 120-sample chunks with XOR-based encodings, but rapid series creation and elevated scrape frequencies multiply chunk allocations and memory consumption. When executing read operations, broad aggregations and regular expressions require intersecting expansive posting lists and decoding entire chunks sequentially because the engine cannot push value predicates directly into compressed storage blocks. Consequently, managing high-cardinality workloads in series-oriented architectures forces operational trade-offs between system stability and granular visibility into ephemeral components.
Pre-configured monitoring templates often fail to meet organization-specific needs, forcing developers to manually build dashboards widget by widget. Sentry introduced AI-agent-powered dashboard creation and editing in open beta, alongside CLI management tooling and template revisions. Users can prompt an AI chat interface to build or adjust dashboards, duplicate and customize uneditable Sentry-built templates, or execute dashboard commands directly in their terminal. Dashboards leverage issue, tracing, and application metric data across frontend, backend, mobile, and framework-specific views like Next.js and Laravel. Edits made through the UI, CLI, or AI agent are automatically tracked in a revision history that supports one-click rollbacks.
ClickStack introduced SQL-based visualizations and SQL-based alerting to allow users to build charts and alerts using arbitrary ClickHouse SQL queries. Traditional query builders trade analytical flexibility for simplicity, preventing teams from easily expressing multi-stage computations like rolling baselines, anomaly detection, or dynamic SLO calculations. To maintain interactivity within dashboards, the system supports ClickHouse query parameters and macros that inject active time ranges, interval sizes, dashboard filters, and source tables. Furthermore, SQL-based alerting evaluates the numeric columns output by these queries, such as returning binary flags when values exceed statistical boundaries. By shifting computational logic directly into SQL, teams can implement complex operational checks without relying on static external thresholds.
The post explains how foundation-model scaling now spans pre-training, post-training, and test-time compute, creating shared infrastructure requirements rather than a single pre-training curve. It examines how AWS infrastructure and open-source tools support these workloads across accelerated compute, networking, storage, orchestration, ML frameworks, and observability. Technical detail includes NVIDIA H100, H200, B200, and B300 GPU characteristics, NVLink/NVSwitch scale-up communication, and EFA-based scale-out networking for distributed collectives. The architecture also incorporates EC2 P instances, tiered storage, Slurm, Kubernetes, SageMaker HyperPod, CUDA, NCCL, PyTorch, Prometheus, and Grafana. The conclusion presents integration points between these layers as the basis for diagnosing bottlenecks and making scaling decisions across the foundation-model lifecycle.
AI-assisted software development often generates functional code that lacks proper instrumentation, leading to unindexed database queries, N+1 patterns, and fragmented connection strategies. While Supabase provides built-in query analytics, security advisors, and subsystem logs, it cannot trace distributed requests across the entire application stack. Integrating Sentry bridges this visibility gap by establishing distributed traces across Next.js frontends, Deno-based Supabase Edge Functions, and Postgres databases. Teams can forward Supabase logs into dedicated Sentry projects and configure runtime integrations to automatically detect performance bottlenecks such as slow spans and Web Vitals regressions. Furthermore, integrating Model Context Protocol servers allows Sentry's Seer debugger to identify root causes and generate automated fixes for emerging issues.
Unreal Engine games frequently experience performance issues such as frame-rate drops, hitches, and network degradation that do not register as application crashes. To address the lack of live production telemetry, the Sentry Unreal SDK introduces automatic performance metrics. The integration periodically samples frame times, network health, active UObject counts, physical memory usage, and garbage collection pause durations across desktop, console, and Android platforms. Telemetry entries attach contextual hardware and environment attributes alongside trace IDs to connect aggregate latency spikes directly to underlying traces and spans. Enabled by default in Unreal SDK version 1.11.0, this telemetry provides developers with fleet-wide visibility into hardware-specific bottlenecks across game releases.
ClickHouse Cloud introduced Query Insights in preview for Managed Postgres to help teams diagnose slow database queries. Powered by the open-source extension pg_stat_ch, the tool streams per-statement telemetry directly into ClickHouse to enable fast aggregations across billions of execution rows. Postgres normalizes query literals into placeholders during the parse-analyze phase before telemetry leaves the database, preventing sensitive data exposure. Telemetry emission maintains around three percent producer overhead by utilizing a non-blocking try-lock on a shared-memory ring buffer. Users can examine high-level database health metrics, rank query patterns by runtime or latency percentiles, and inspect execution flyouts detailing disk spills, cache hits, and parallel worker behavior.
JavaScript application performance monitoring tools rely on monkey-patching via require-in-the-middle and import-in-the-middle, which breaks with ECMAScript Modules, bundlers, and non-Node runtimes. To solve this, an initiative is replacing monkey-patching with Node's built-in diagnostics_channel TracingChannel API across server-side JavaScript libraries. Under this pattern, libraries publish structured events while monitoring vendors subscribe to them with zero overhead when unlistened. The author leveraged Claude Code workflows alongside direct maintainer communication to draft proposals, implement code, and manage reviews across 44 target packages. Ten libraries including mysql2, node-redis, ioredis, and unjs modules have merged support, while active efforts continue on shared OpenTelemetry mapper registries and remaining ecosystem packages.
Expo applications generate approximately 75% of the total event volume received from React Native applications in Sentry. In response, Sentry updated its React Native SDK starting in version 8.10 to improve Expo debugging and performance monitoring workflows. The update automatically enriches events with Expo constants and over-the-air update context, including channels, runtime versions, and emergency launch warnings when an OTA update fails. Developers can track remote EAS Build lifecycle failures and successes using dedicated hooks configured in package.json. Performance instrumentation now supports span generation for Expo Router route prefetching as well as asset and image loading through wrapper functions around expo-image and expo-asset.
An Economist survey of 1,220+ executives across eight industries finds that digital native companies lead in ambition and breadth of AI deployment, but not in full operational maturity. At 18%, they are the most likely group to prioritize embedding AI across core processes at scale, and nearly 92% report AI ROI ahead of plan. Yet they lead fully embedded AI—defined as use by 100+ users, SLAs, and performance and impact monitoring—in only one of eight functions, R&D/product development; they rank seventh in finance and sixth in operations and supply chain. Telecom, media and entertainment, manufacturing, and energy outperform them in selected functions despite lower stated scaling priority. The proposed response is to build shared, production-grade foundations for data, governance, workloads, models, agents, and applications, with security, lineage, monitoring, and performance measurement treated as reusable capabilities.
Databricks’ monitoring infrastructure now tracks 5 billion active timeseries in real time and ingests more than 10 trillion samples daily, exposing scalability, reliability, cost, and operability limits in its older stack. The replacement, Pantheon, is a fork of CNCF Thanos deployed across more than 160 instances in about 70 regions and three cloud providers; tiered storage, differentiated memory retention, isolated replicated Receive groups, multitenancy, and a custom control plane support automated scaling and recovery. Pantheon’s largest instance holds about 300 million in-memory timeseries and handles nearly 1,000 PromQL queries per second, while migration reduced annual cloud costs by millions and monitoring downtime by roughly five times. For high-cardinality troubleshooting, Hydra preserves raw metrics in Delta tables, exposes them through Grafana and SQL, and unifies metric semantics across aggregated and raw paths, with freshness improvements planned.
Distributed tracing frequently suffers from visibility gaps, broken context across asynchronous boundaries like Kafka, and high operational overhead from manually configuring OpenTelemetry SDKs and collectors. To resolve these issues, Odigos provides zero-code instrumentation via eBPF probes that dynamically attach to running workloads without modifying application code. An intelligent control plane within Odigos dynamically adjusts trace sampling and attribute enrichment based on real-time latency and error rates. The resulting telemetry exports over OTLP into ClickStack, an all-in-one backend featuring an OpenTelemetry Collector, ClickHouse storage, and the HyperDX query interface. This unified pipeline preserves end-to-end trace continuity, captures deep application and database context, and enables fast SQL-based trace analysis.
Sentry launched Application Metrics to capture application signals without pre-aggregating counters or discarding high-cardinality attributes like user IDs, project IDs, and regions. The system supports counters, distributions, and gauges within the existing SDK while linking each metric event directly to trace IDs for integrated debugging. Engineers demonstrated the feature by troubleshooting a Session Replay failure that triggered silently when sessions exceeded 1,000 video segments. By instrumenting distributions for replay event counts with project and replay attributes, the team isolated seven affected occurrences, navigated to connected traces and log lines, and reproduced the issue. Application Metrics comes enabled in recent SDK versions with 5GB included per plan.
Qonto struggled with slow queries, system instability, and aggressive data sampling when handling distributed traces in Grafana Tempo. To enable wide-event querying without strict cardinality limits, the team migrated their telemetry storage to ClickHouse Cloud. Telemetry from applications, Kubernetes, and GitHub routes through OpenTelemetry collectors over AWS PrivateLink into ClickHouse, while Grafana remains the primary dashboard interface. By compressing 231 TB of uncompressed trace attributes down to 376 GB, Qonto achieved substantial storage savings and integrated an AI incident companion using the ClickHouse Model Context Protocol. The new architecture eliminated cardinality policing, allowed product and support teams to self-serve incident investigations, and enabled real-time streaming pre-aggregations using Apache Flink.
Cursor describes its agent harness as an iterative product process: vision-driven hypotheses are tested through offline evals, real-world A/B experiments, and instrumentation. Its context strategy has shifted from static codebase context and guardrails toward dynamic retrieval as models improve, while model-specific prompts and tools match training conventions. Quality measurement combines CursorBench with latency, token efficiency, tool-call errors, cache behavior, code Keep Rate, and language-model analysis of user responses. The team classifies expected and unknown tool errors, uses per-tool and per-model anomaly baselines, and automates log investigations and backlog tickets; one sprint reduced unexpected tool-call errors by an order of magnitude. The harness also supports model switching and subagents, although switching can cause cache misses and summary information loss, and the post argues that multi-agent orchestration will make harness engineering increasingly central.
Telecommunications network operations centers monitor extensive performance telemetry, but the source describes a gap between technical network events and the customers, contracts, and revenue they affect. A degraded tower serving 12,000 postpaid customers averaging $85 per month presents a different business problem from one affecting 12,000 prepaid customers with high churn propensity, while enterprise SLA exposure can remain hidden from the NOC. Databricks Genie connects network elements, serving areas, customer records, contract terms, SLA thresholds, and churn-risk scores so leaders can query commercial impact in seconds. It also supports proactive alerts based on defined commercial thresholds, enabling restoration and investment decisions to account for customer impact rather than technical severity alone.
The best engineering reads, once a week.