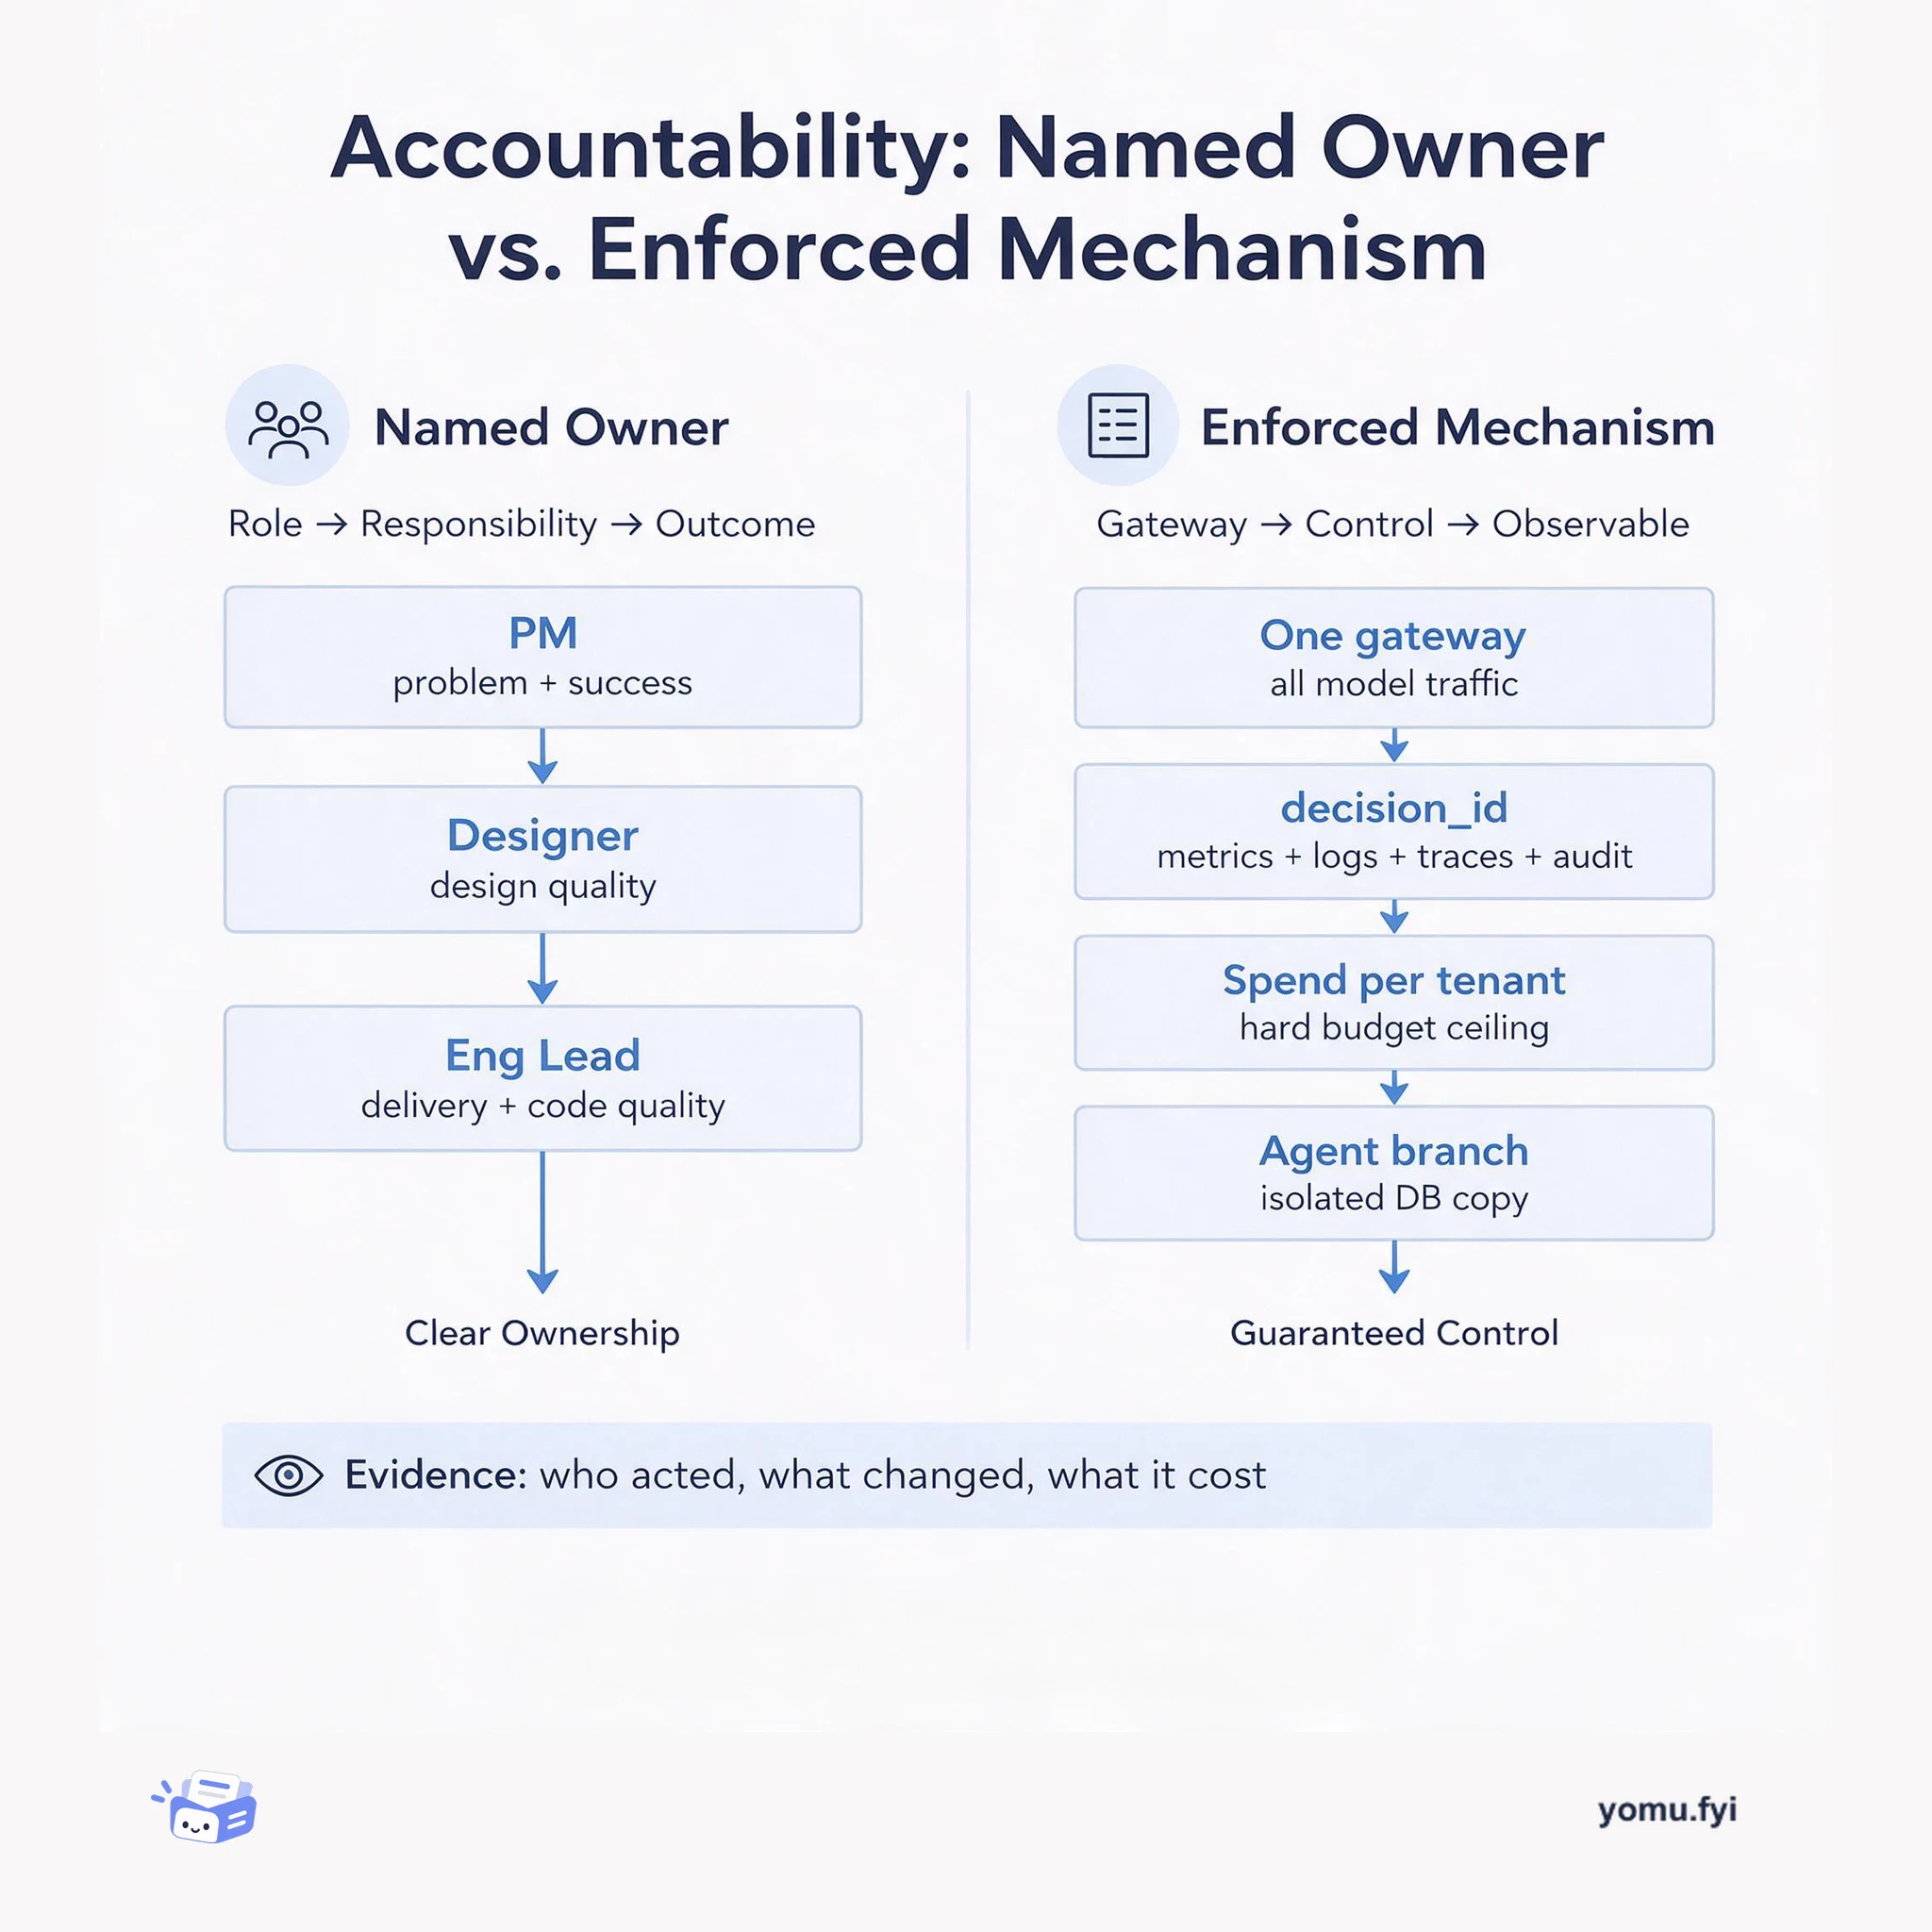
Accountability: Named Owner or Enforced Mechanism?
A side-by-side comparison of the two accountability models engineers actually rely on: a named human owner per outcome, and system-enforced traces, budgets, and isolation.
Loading…
Topic
248 posts about Observability. Every summary links to the original.
See the idea
A side-by-side comparison of the two accountability models engineers actually rely on: a named human owner per outcome, and system-enforced traces, budgets, and isolation.
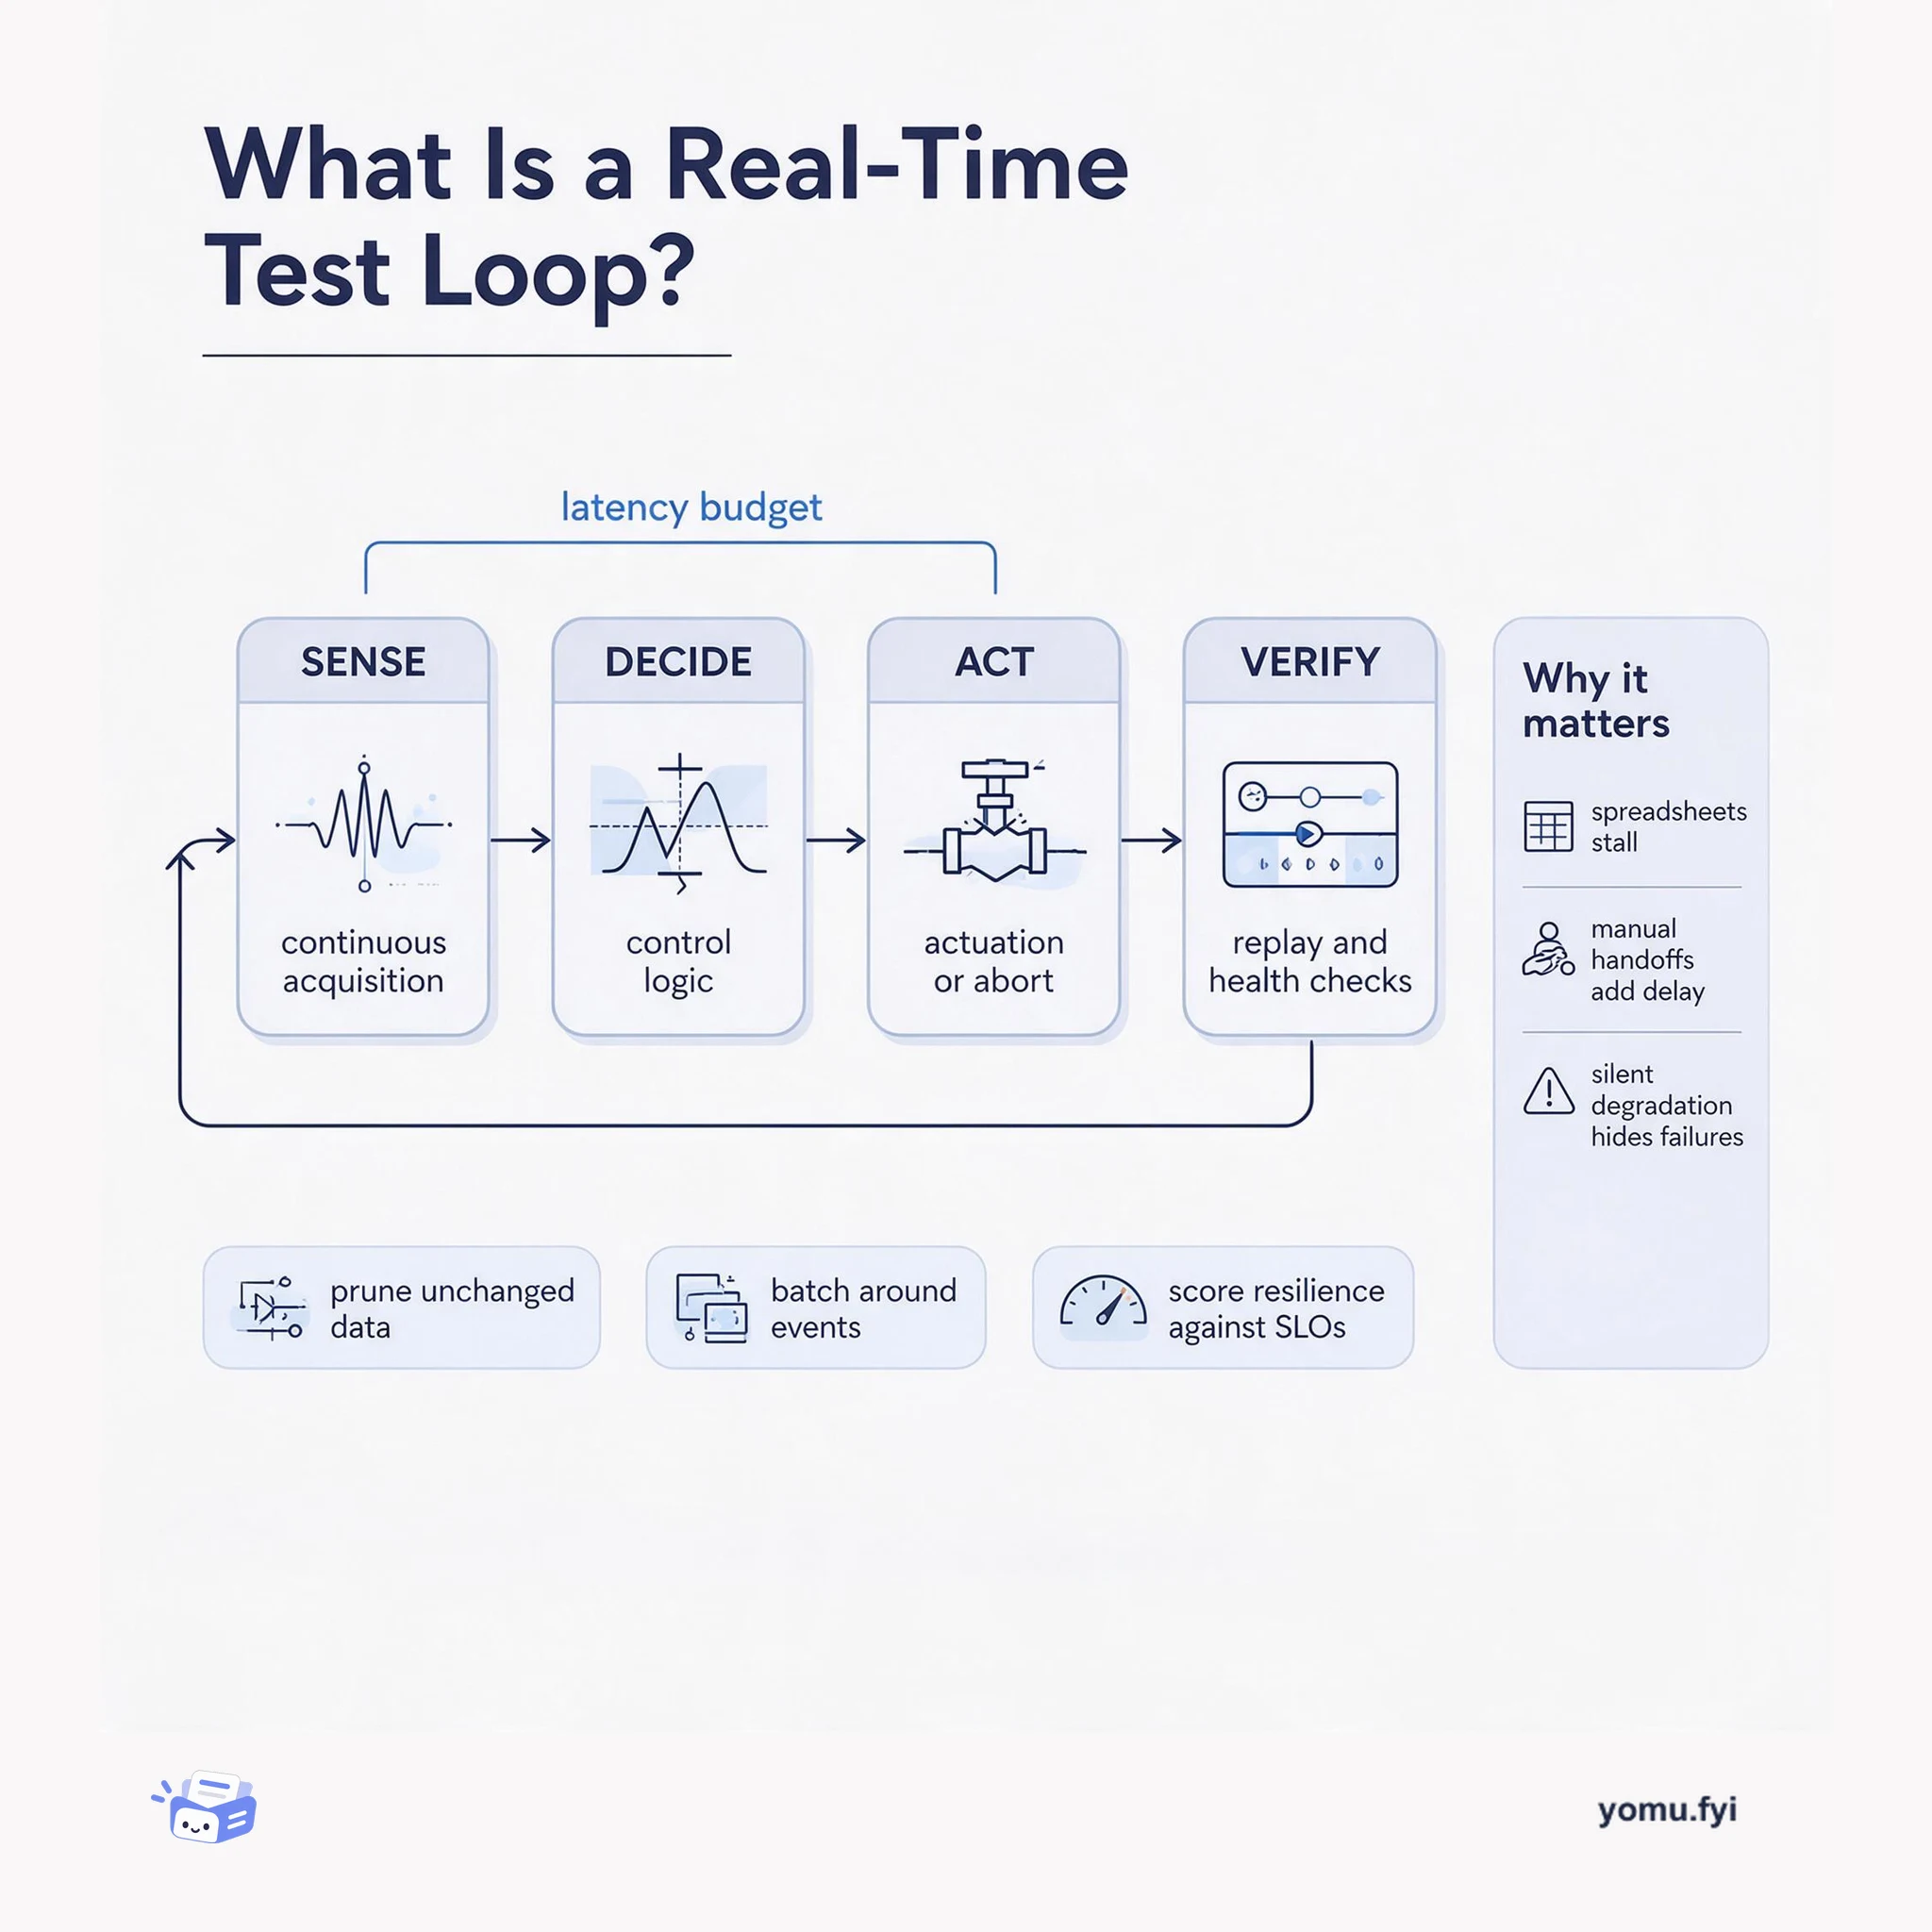
A real-time test loop is the closed path from sensor acquisition to control action and back to verification. This explainer maps its four parts and the latency budget that binds them.
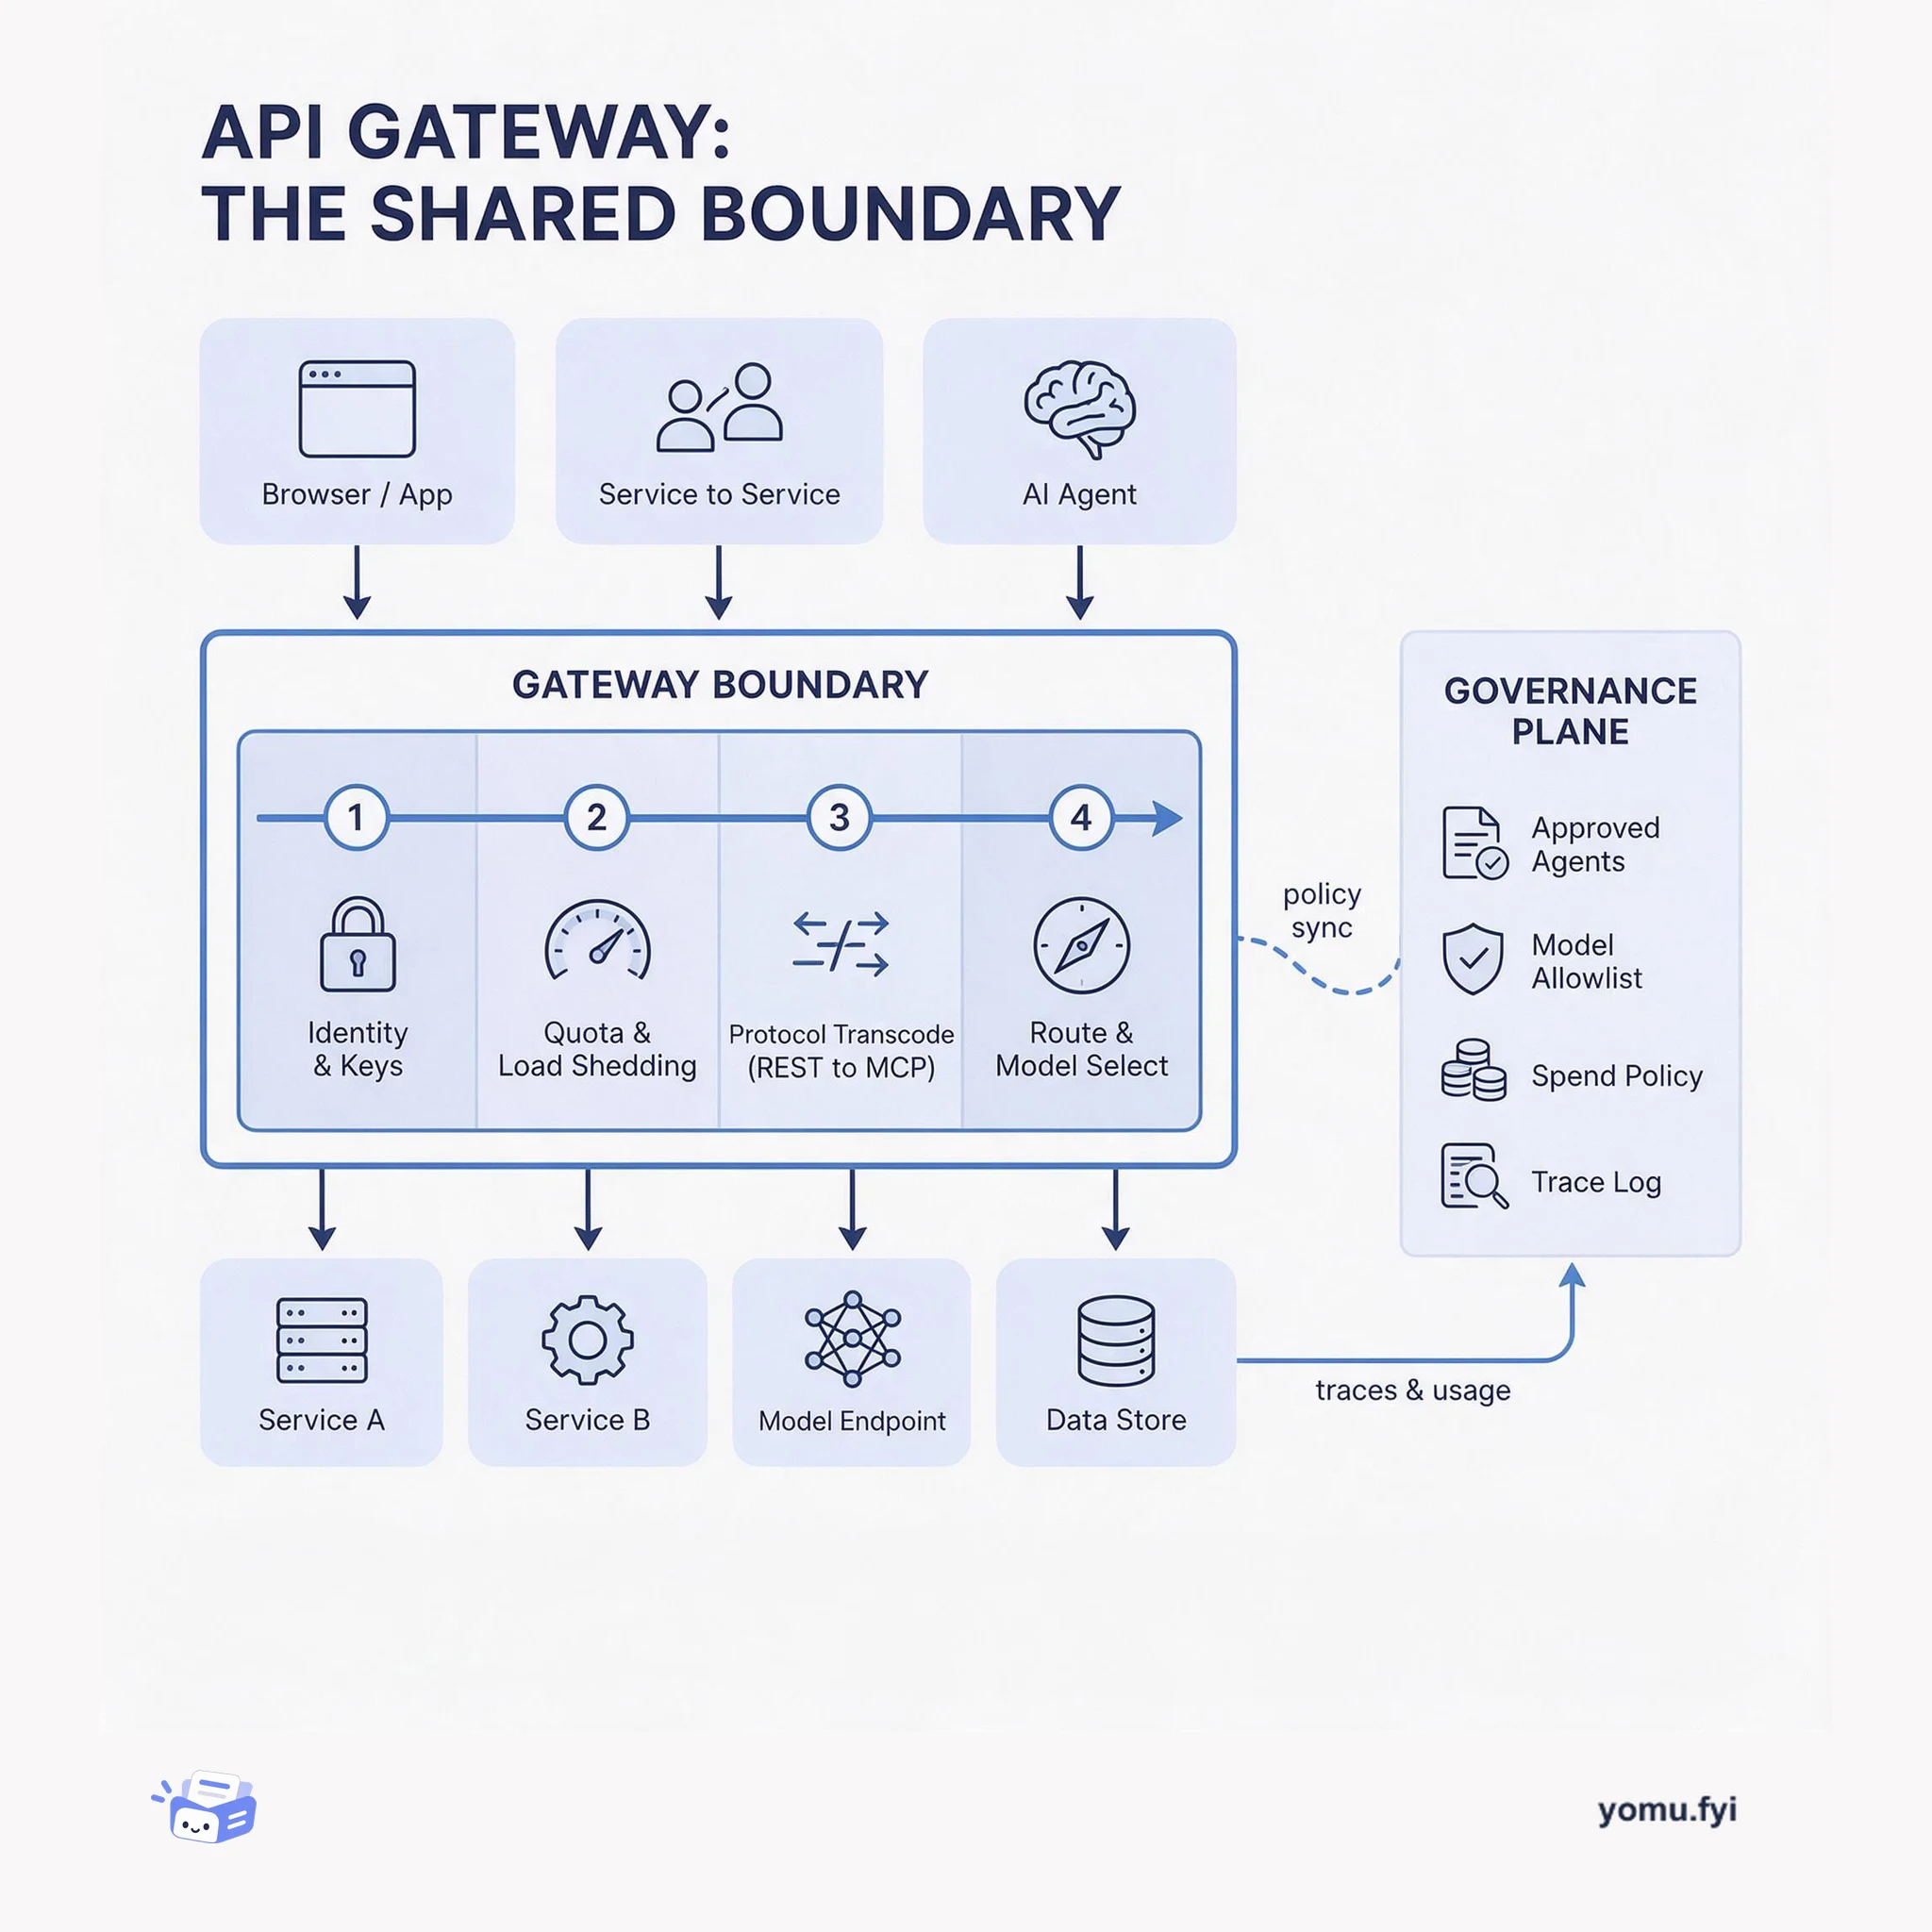
The API gateway is the single boundary where protocol translation, auth, quotas, and routing become shared policy instead of per-service code. This layered diagram shows what belongs there and why.
The Good Stuff
Paid picks we use ourselves. Links carry a referral code — a subscription through one earns us a commission at no extra cost to you.
Newest first
LogHouse’s OpenTelemetry pipeline ingests 50 million events per second and stores 177 PiB of uncompressed data, but its initial agent-to-gateway design could not reliably absorb ClickHouse backpressure. In-memory queues caused instability during short-lived spikes or database outages, while local collector write-ahead logs made gateways stateful, slowed recovery, delayed fresh telemetry behind FIFO backlogs, and took about four hours to drain 1 TiB. The team rejected adding Kafka because operating a new tier-zero service across cloud regions was not justified for this use case, then designed a custom architecture using blob storage, the OTel failover connector, overflow notifications, and a catchup collector. In staging, failover redirected 120,000 events per second to S3 without changing gateway resource usage, and recovery resumed ClickHouse writes while the catchup collector drained the queue; the design scaled from 10 million to 50 million events per second, with added regional setup and less precise recovery visibility.
The Postgres VM described here runs PgBouncer instances, a backup agent, metrics exporters, a local Prometheus, a log collector, and watchdog timers alongside the database. Those processes share machine-wide resources outside Postgres’s huge-page-backed shared_buffers, so leaks, CPU saturation, or disk exhaustion can threaten database availability. ClickHouse Managed Postgres places supporting services in a cgroup v2 slice and combines Go runtime GOMEMLIMIT targets with systemd memory.high and memory.max enforcement. GOMEMLIMIT encourages earlier garbage collection, memory.high applies reclaim and throttling, and memory.max provides a hard ceiling whose OOM scope excludes Postgres because it uses a separate cgroup. CPU weights, bounded buffers, log and metric controls, disk thresholds, and exemptions for replication and monitoring sessions extend isolation across other failure modes; these controls are enabled by default.
During major infrastructure incidents, critical system logs and diagnostic evidence are frequently overwritten, lost, or erased by emergency recovery efforts before engineers can investigate. To solve this visibility gap in multi-cluster environments, an open-source event-driven diagnostic operator was developed as an automatic first information report collector. Deployed on a central hub cluster, the operator monitors Kubernetes warning events rather than relying on heavy polling. When an event matches a predefined regular expression pattern, the operator identifies the target spoke cluster, copies its kubeconfig secret, and spins up an independent must-gather job. Diagnostic data is written to off-site or shared storage with a configurable retention window, preserving forensic context without human intervention.
AgentFlo designed an architecture using Amazon Bedrock AgentCore and AWS serverless infrastructure to address traffic spikes and build trust in autonomous commerce agents. Security operates across three stages: AWS Fargate filters prompt injections and opt-outs, AgentCore Gateway enforces deterministic Cedar authorization policies during tool execution, and post-turn privacy filters screen outputs. Session isolation is maintained across merchants through AgentCore runtime microVMs, while AgentCore Observability and Amazon CloudWatch provide end-to-end tracing. Data reliability and long conversation journeys rely on Amazon DynamoDB context storage, Amazon Bedrock Knowledge Bases, and Amazon S3 Vector embeddings. Early deployment data showed a 12 percent net revenue uplift.
The August 2026 newsletter rounds up ClickHouse product releases, research, managed services, observability, community work, and upcoming events. It introduces Andy Pavlo’s arrival to establish ClickHouse Labs, describes the 26.7 release’s join optimizations, token-position text indexes, and EXPLAIN ANALYZE, and reports a 40× phrase-search improvement on a Hacker News dataset. It also covers an interactive ClickBench playground for more than 100 database systems, running isolated workloads in Firecracker microVMs on AWS EC2, plus guidance on combining Postgres for mutable data with ClickHouse for immutable analytical workloads. Additional items address Managed Postgres notifications and backups, TTL-related disk growth, vector-search trade-offs, and hdx-evals, which found a purpose-built ClickStack MCP server scored 7–20 percentage points higher than direct SQL access in five reproducible scenarios.
Sony LIV’s legacy analytics environment combined batch pipelines, Elasticsearch, BigQuery, and other telemetry stores, creating slow, costly, fragmented analysis as streaming activity reached billions of events per day. During live sports, the platform needed sub-second queries, high ingestion throughput, cost-efficient long-term storage, and horizontal scaling for sudden traffic spikes. Sony LIV consolidated these workloads on ClickHouse Cloud: client, streaming, CDN, and advertising systems send events through Amazon Kinesis and ClickPipes into a ClickHouse cluster serving dashboards, product analytics, QoE, and SRE workflows. The source reports that queries previously taking tens of seconds to minutes now run in sub-second to low-single-digit seconds, improving operational responsiveness, engineering productivity, and the handling of major live-event traffic.
Retailers are moving from isolated generative-AI pilots to enterprise-wide adoption, where each store, headquarters, and digital workflow needs different data, permissions, models, and cost controls. The post argues that useful AI depends on governed business context, while fragmented tools can produce separate provider contracts, logs, permission models, cost centers, and answers to the same question. It proposes an open control plane that centralizes governance and model access without forcing employees into one application or vendor. The described Databricks design combines Unity Catalog for data and business context, Unity AI Gateway for routing and oversight, Foundation Model APIs for commercial, open-source, and custom models, and Genie for natural-language queries over governed data; the intended result is faster experimentation and deployment with visibility into access, spending, lineage, and auditability.
PostgreSQL 19, still in beta when this was written, adds monitoring and observability changes spanning lock contention, logging, WAL, wait events, remote messages, and multixacts. The default for log_lock_waits changes to on, while log_min_messages gains per-process-type levels and autoanalyze receives its own duration setting. A new wal_fpi_bytes counter exposes full-page-image volume cluster-wide, per session, per query, and in VACUUM and ANALYZE logs; new wait events expose WAL write, flush, and replay stages plus COPY file, pipe, and program I/O. Remote server messages now use normal PostgreSQL logging with origin prefixes, and pg_get_multixact_stats() surfaces multixact usage that previously required filesystem inspection and educated guessing. The post also lists upgrade work for parsers, metric collectors, wait-event dictionaries, configuration UIs, and alert thresholds, while noting that final release notes may differ.
supabase-js now supports W3C Trace Context propagation so a client trace can share its trace_id with Supabase API Gateway and Edge Function logs. Previously, browser and server records had no shared identifier, making cross-boundary debugging depend on manually aligning timestamps. When tracePropagation is enabled, the SDK attaches traceparent, tracestate, and baggage to requests for Supabase domains; Supabase preserves the trace_id in generated logs, and W3C-compliant tracers such as OpenTelemetry, Sentry, Datadog, Honeycomb, or Grafana can continue the trace server-side. The setup requires a separately configured tracer, the tracing entry-point import, an active span, and a registered TracerProvider; propagation is sampling-aware by default, adds no OpenTelemetry code to the main bundle, and is available in supabase-js 2.112.0 or later, with CDN/UMD builds excluded.
Traditional security boundaries assume human speed and judgment, but AI agents execute nondeterministic actions rapidly and can invoke unapproved Model Context Protocol servers through standard HTTPS traffic. To mitigate this shadow traffic, Cloudflare One introduces detection and inspection capabilities across clients, network boundaries, and MCP servers. Cloudflare Gateway leverages protocol-level headers and JSON-RPC inspection to identify direct MCP connections, verify managed paths, and enforce access through approved MCP Server Portals. Furthermore, Cloudflare Agents SDK v0.20.0 implements the stateless 2026-07-28 MCP specification while providing fallback handshakes for legacy servers. Organizations can combine Gateway traffic source rules with server middleware like WriteGuard to block unauthorized tool invocations before execution.
MongoDB Atlas introduces OpenTelemetry Metrics Sink, a push-based stream that delivers high-fidelity Atlas metrics to OpenTelemetry-compatible platforms, enabling database telemetry to flow alongside application and infrastructure metrics. This closes the gap where database telemetry was often disconnected from application and infrastructure monitoring, forcing operators to jump between dashboards. The push-based delivery eliminates the complexity of pull-based collection, custom exporters, and polling infrastructure, reducing operational overhead and avoiding API rate limits. It supports configuration via the Atlas UI or Terraform, works with custom OTel endpoints, Dynatrace, and New Relic, and is available for dedicated M10+ clusters; a test metric is emitted on creation or update to verify it is working. Combined with Atlas Log Integration and upcoming Events Integration, teams gain unified visibility into database health alongside other signals, accelerating incident response and root cause analysis.
On August 12, a total solar eclipse crossed the North Atlantic and Europe, passing directly over Iceland, northern Spain, and Portugal. Cloudflare Radar analyzed HTTP request volumes in five-minute intervals across affected countries, comparing the data against a baseline derived from the previous three Wednesdays. Traffic reductions aligned closely with peak solar obscuration, with totality regions recording drops between 15% and 30% and specific areas shifting by up to -46.7%. Once the sun reappeared, request volumes rebounded to normal levels within minutes as users resumed device activity. The observed traffic declines were driven by aggregate human behavior rather than network failures.
Cloudflare announced the general availability of Certificate Transparency Monitoring alongside a filtering mechanism to eliminate noisy alert emails. Previously, the monitoring system alerted domain owners for all Certificate Transparency log entries, including routine, automated renewals for Universal SSL, Advanced Certificate Manager, and backup certificates. Because the alerting flow and certificate ordering service operated independently, existing identifiers like TBSCertificate hashes arrived too late to verify pre-certificates. To resolve this race condition, the ordering service now computes an SHA-256 hash of the DER-encoded SubjectPublicKeyInfo structure at key generation. When the alerting service discovers a log entry, it recomputes this hash to verify ownership against the ordering database, suppressing alerts for Cloudflare-managed certificates while preserving alerts for external or unexpected issuances.
ClickHouse and Hud announce an integration that combines ClickStack’s service-level observability with Hud’s function-level runtime forensics for AI-assisted software development. As coding agents generate more code, the post identifies the central challenge as assessing production risk, detecting regressions, and giving engineers enough context to fix them. Teams connect the ClickStack and Hud MCP servers to a single coding agent, while shared trace IDs correlate OpenTelemetry traces and logs with Hud’s function-level metrics and forensic data; Hud’s Runtime Code Sensor requires no manual instrumentation and runs with low overhead in production. The resulting workflows support pre-deployment risk assessment against production behavior, release monitoring, auto-triage and auto-fix, and rollback or code-level remediation when issues arise.
Evaluating Sentry's AI agent Seer previously required manually querying evaluation data and parsing raw JSON traces to find tool failures, latency spikes, and hallucinations. To automate this triage, the team deployed a daily Claude Routine connected to Sentry using a Model Context Protocol server. Each morning, the routine analyzes hundreds of overnight agent conversations, reviews aggregate error metrics, samples failed and successful conversation spans, and inspects the agent codebase for context. Claude evaluates whether final decisions match underlying reasoning and creates Linear tickets for newly discovered issues. This daily automated analysis accelerated the feedback loop, allowing engineers to identify efficiency issues like repeated malformed repository queries and deploy same-day fixes.
Adobe Firefly powers generative creative features using a large-scale GPU training infrastructure hosted on Amazon Elastic Kubernetes Service. As workloads scaled to thousands of nodes and GPUs, Adobe's self-managed Prometheus setup struggled with query latency across high-cardinality telemetry data. To resolve these performance bottlenecks, the team moved two million critical time series metrics to Amazon Managed Service for Prometheus while using managed scrapers alongside their existing infrastructure. This setup accelerated query response times by more than 28x over 24-hour windows, reducing query execution times to approximately ten seconds. Additionally, the migration expanded practical monitoring windows from six hours to 24 hours, giving teams reliable visibility across long-running distributed training jobs.
AI infrastructure spans compute, networking, storage, orchestration, and applications, so a symptom at one layer may originate elsewhere. The post proposes selecting observability tools by failure domain, mapping components to telemetry sources, and reducing signals to a top-k alert set in a unified Prometheus/Grafana triage dashboard. For a DGX cluster using InfiniBand, BCM, and Slurm, it recommends Redfish/IPMI, DCGM, NVSM, UFM, and BCM, while deferring NetQ, NMX, Run:ai, and NIM until their corresponding capabilities are needed. The framework emphasizes DCGM for GPU metrics, NVSM for DGX system health, UFM for InfiniBand, and BCM for cluster and job aggregation, with specialized tools retaining low-level telemetry. An elevated InfiniBand bit error rate illustrates how retransmissions can slow one rank during NCCL all-reduce, causing synchronized training throughput to follow the slowest rank; alerts should connect concise signals to owners and remediation actions.
iFood’s security incident response team needed high-volume log ingestion, long-term retention, and rapid access to months of history, but its Databricks-based platform became costly to scale beyond 130 TB and imposed query timeouts. The team ran a production-data proof of concept and rebuilt its tooling around ClickHouse Cloud on AWS: logs land in S3 and flow through ClickPipes into ClickHouse, with Querybook preserving notebook-based investigations and ClickStack planned for operational metrics. With ClickHouse Cloud, iFood reports 9–16x faster queries, expected cost reductions of 40–50%, and data freshness improving from hourly batches to 2–10 minutes; alerts that previously ran hourly can now run about every 10 minutes. That foundation also supports agentic threat hunting: multiple sub-agents query more than 30 TB in parallel, reducing a hunt from about a week to roughly two hours, while Langfuse is used to inspect and tune agent analyses.
Sentry introduced a collection of updates to its logging platform aimed at improving search scalability, export flexibility, and general viewer usability. The system now supports URL-synced log pinning alongside an overhauled export interface that handles aggregate data, full attribute payloads, and high-volume JSONL formats across Logs, Errors, and Tracing. Performance enhancements to the log viewer include a more constrained layout with reduced initial data loads, inline error representations, individual chips for multi-value search terms, and trace-level filtering. To assist large-scale queries spanning hundreds of gigabytes or terabytes, frontend and backend modifications added longer query timeouts with continuations, clearer rate-limiting messages, and in-place retries.
Salesforce faced scaling bottlenecks when individual engineering teams maintained fragmented, custom telemetry pipelines requiring manual data transformations and dashboard creation every release. To resolve these silos, the engineering organization established the Product Data Platform (PDP) using a standardized custom schema built atop Monitoring Cloud infrastructure. This framework mandates core telemetry fields for consistent metric generation while offering governed optional attributes for product-specific flexibility. An AI-driven Model Context Protocol tool assists developers by recommending compliant instrumentation patterns directly within their workflows. Today, the unified platform processes 45 billion rows of data daily across 19,000 distinct events and 2,000 product features, reducing dashboard refresh latency by 97 percent from one month to daily updates.
The best engineering reads, once a week.