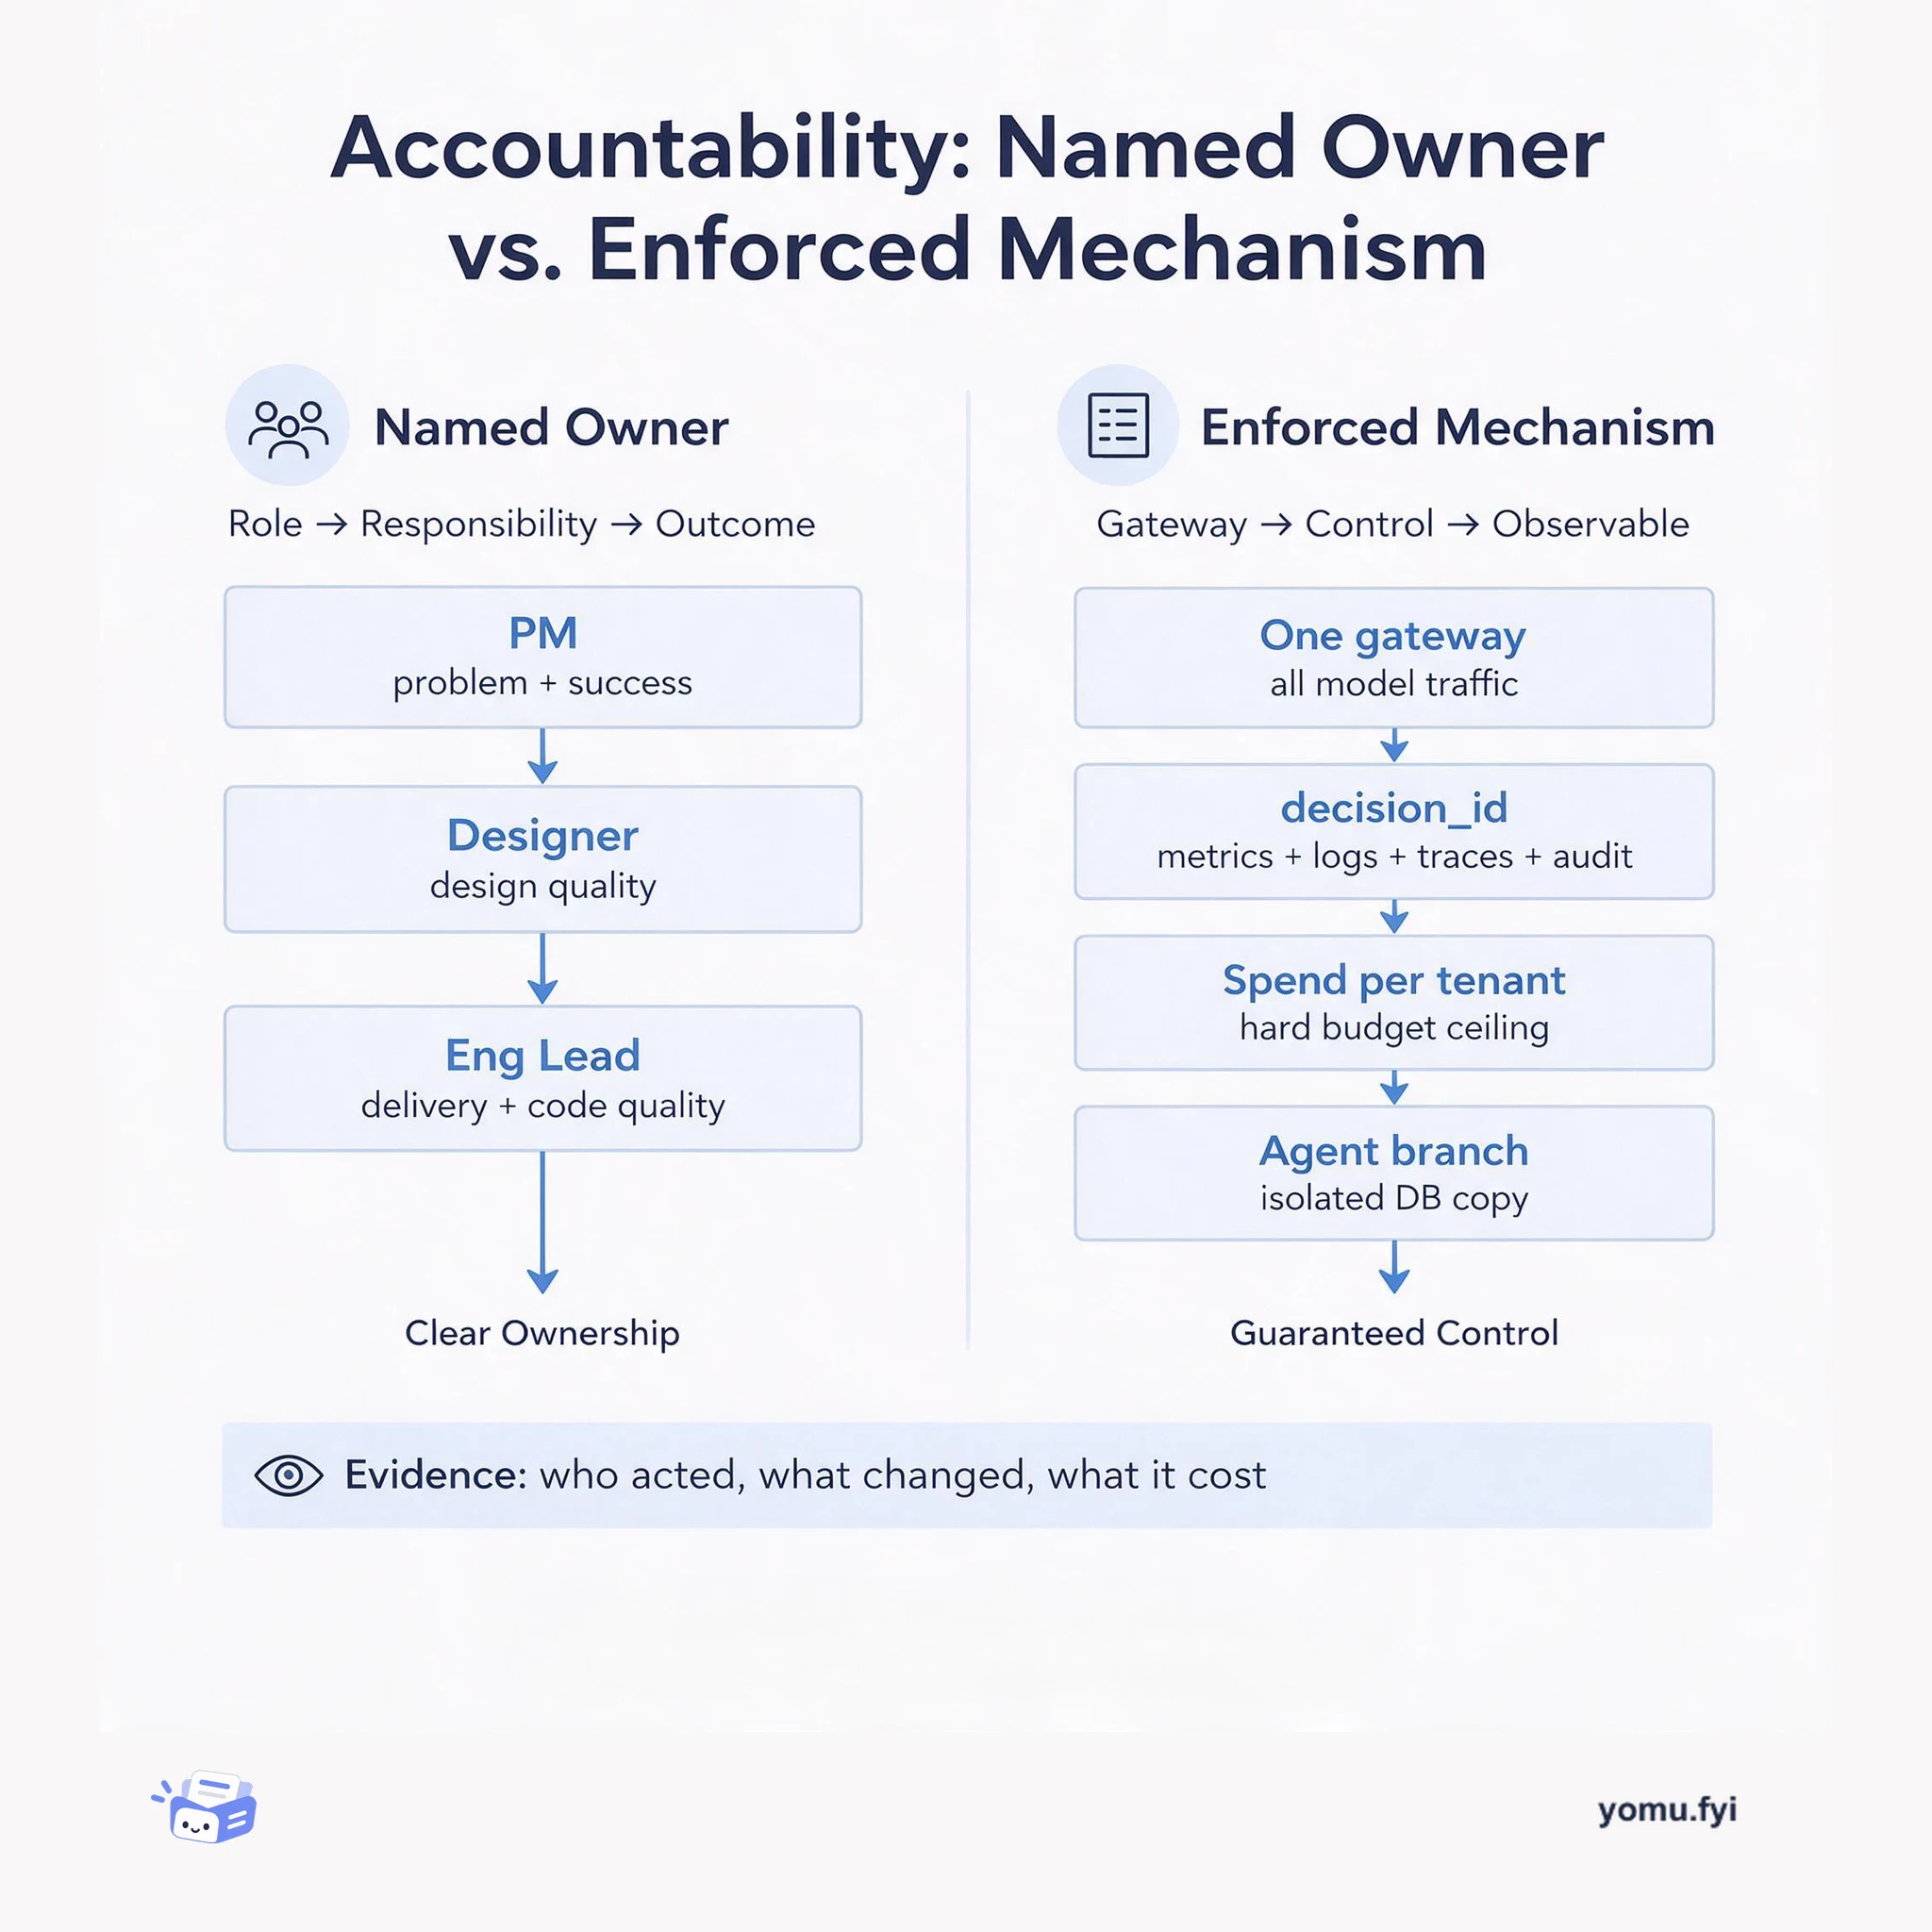
Accountability: Named Owner or Enforced Mechanism?
A side-by-side comparison of the two accountability models engineers actually rely on: a named human owner per outcome, and system-enforced traces, budgets, and isolation.
Loading…
Topic
248 posts about Observability. Every summary links to the original.
See the idea
A side-by-side comparison of the two accountability models engineers actually rely on: a named human owner per outcome, and system-enforced traces, budgets, and isolation.
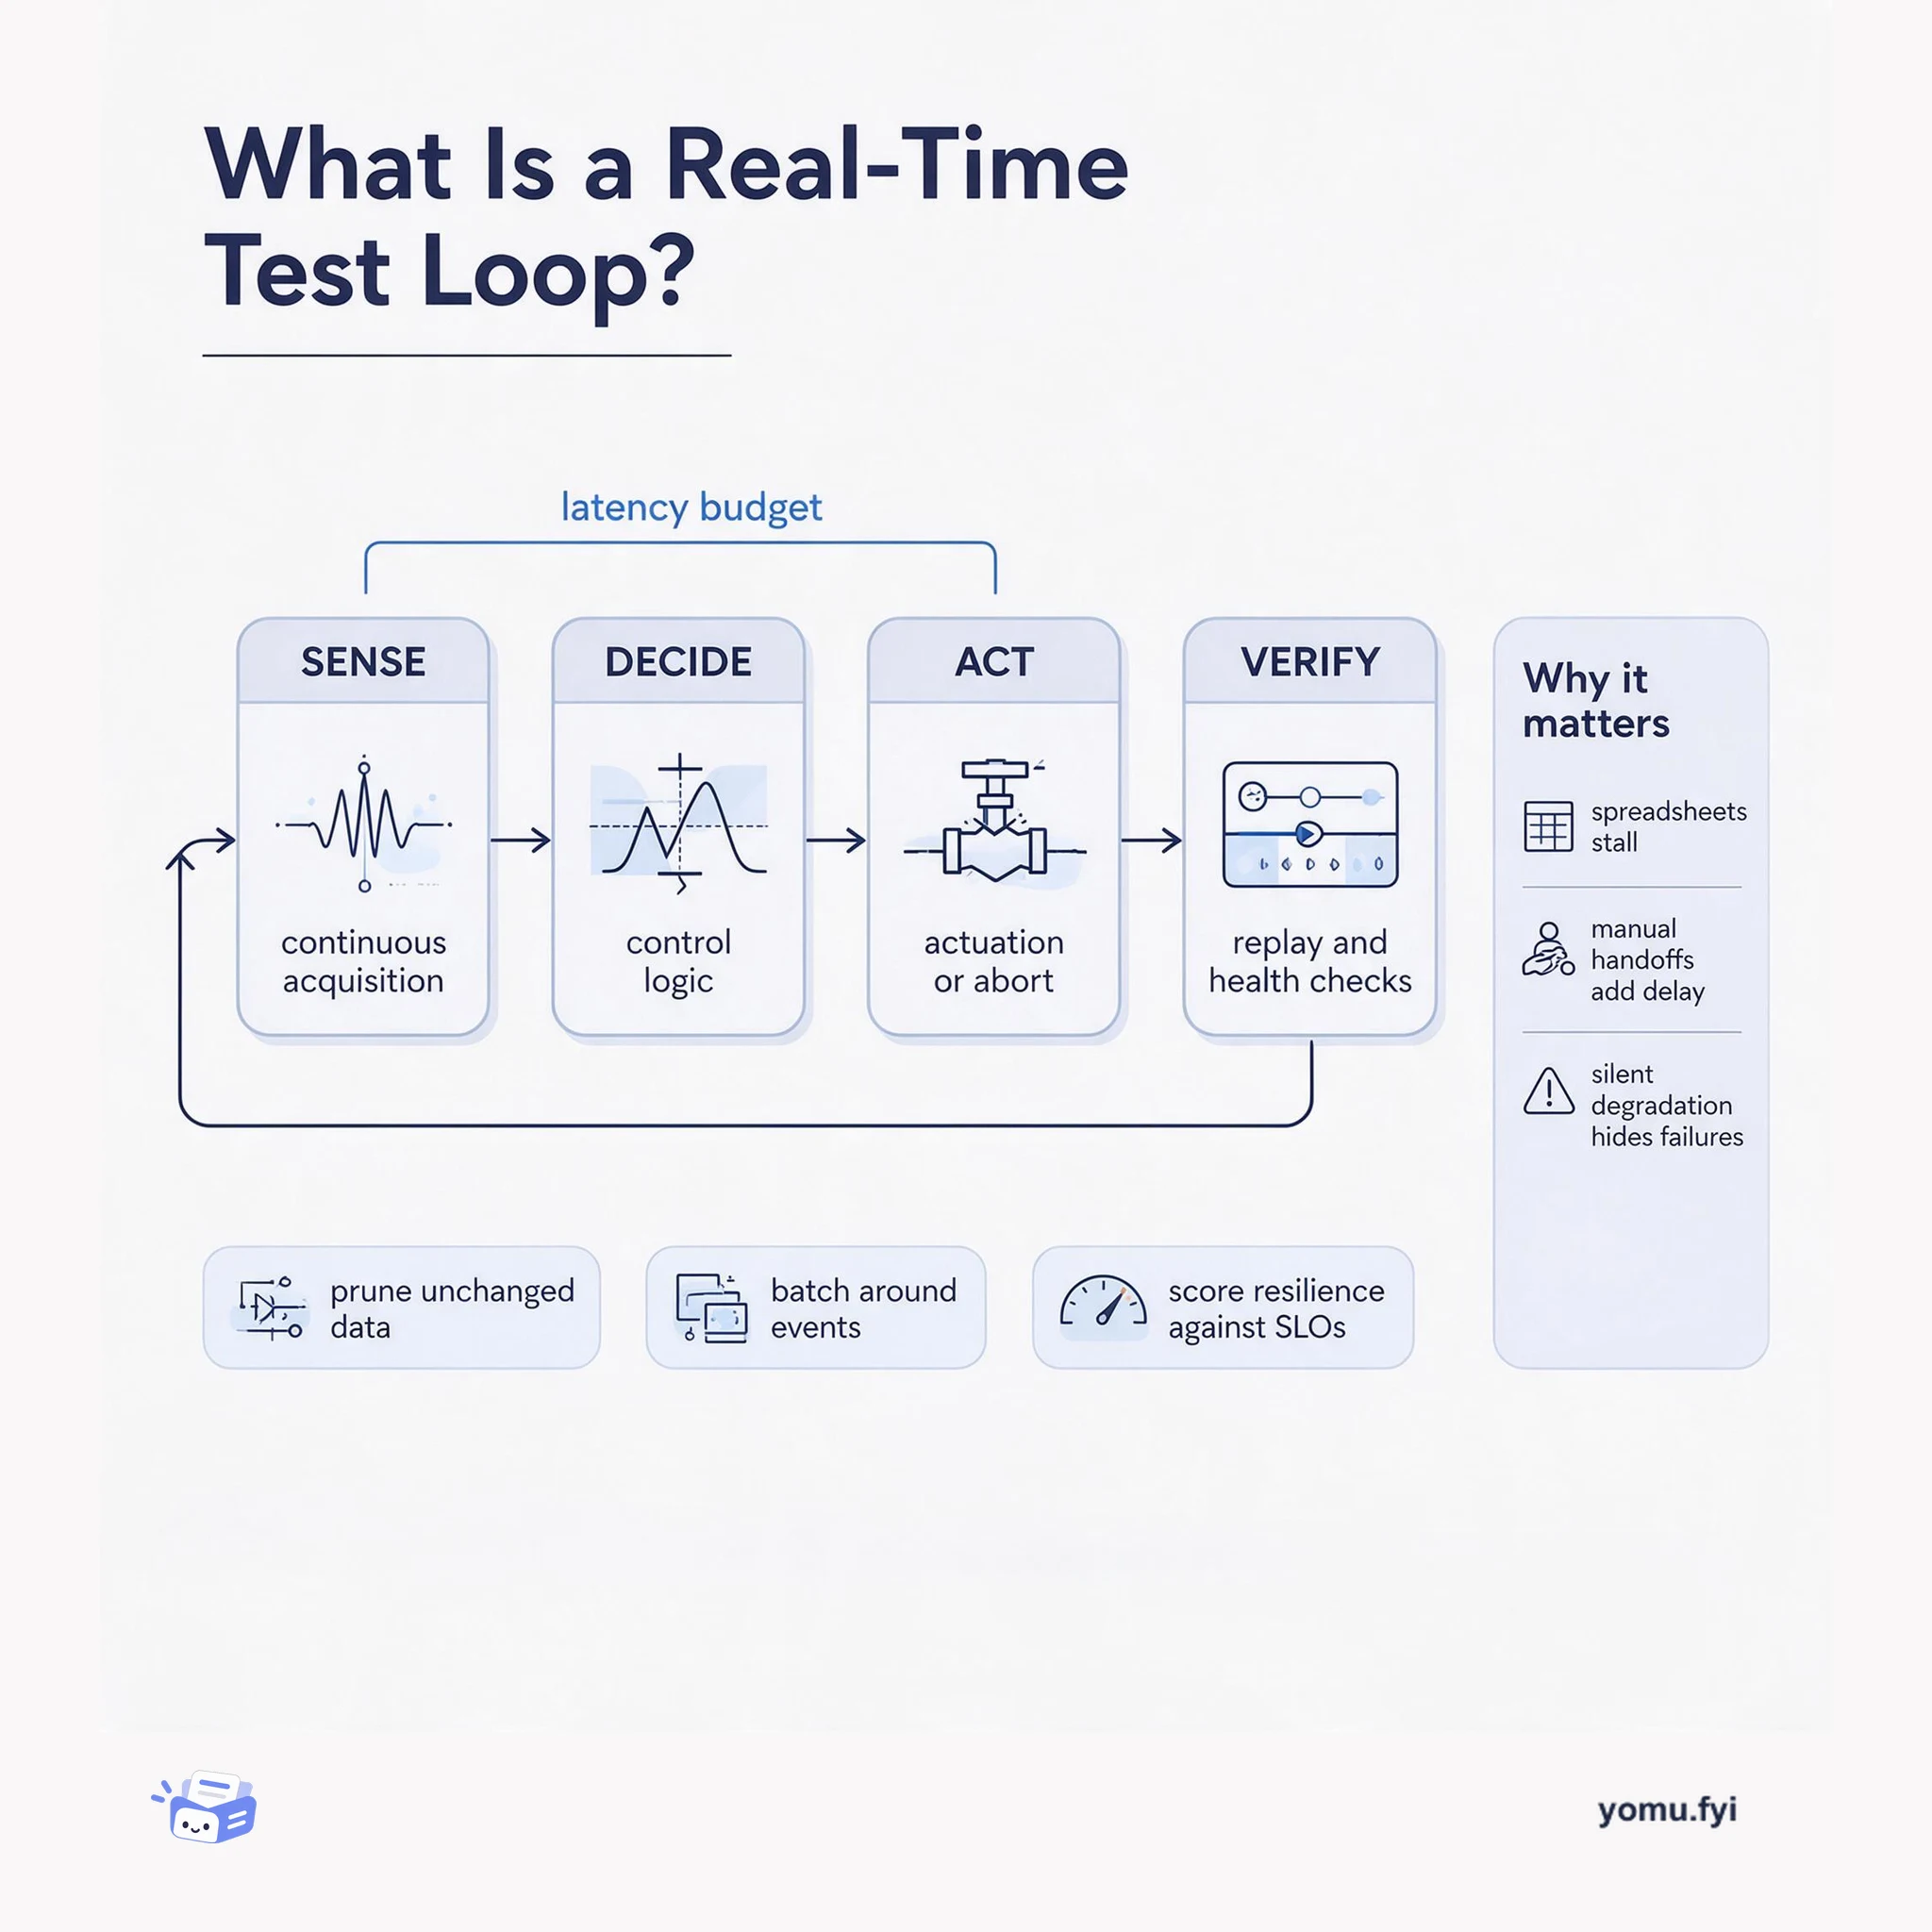
A real-time test loop is the closed path from sensor acquisition to control action and back to verification. This explainer maps its four parts and the latency budget that binds them.
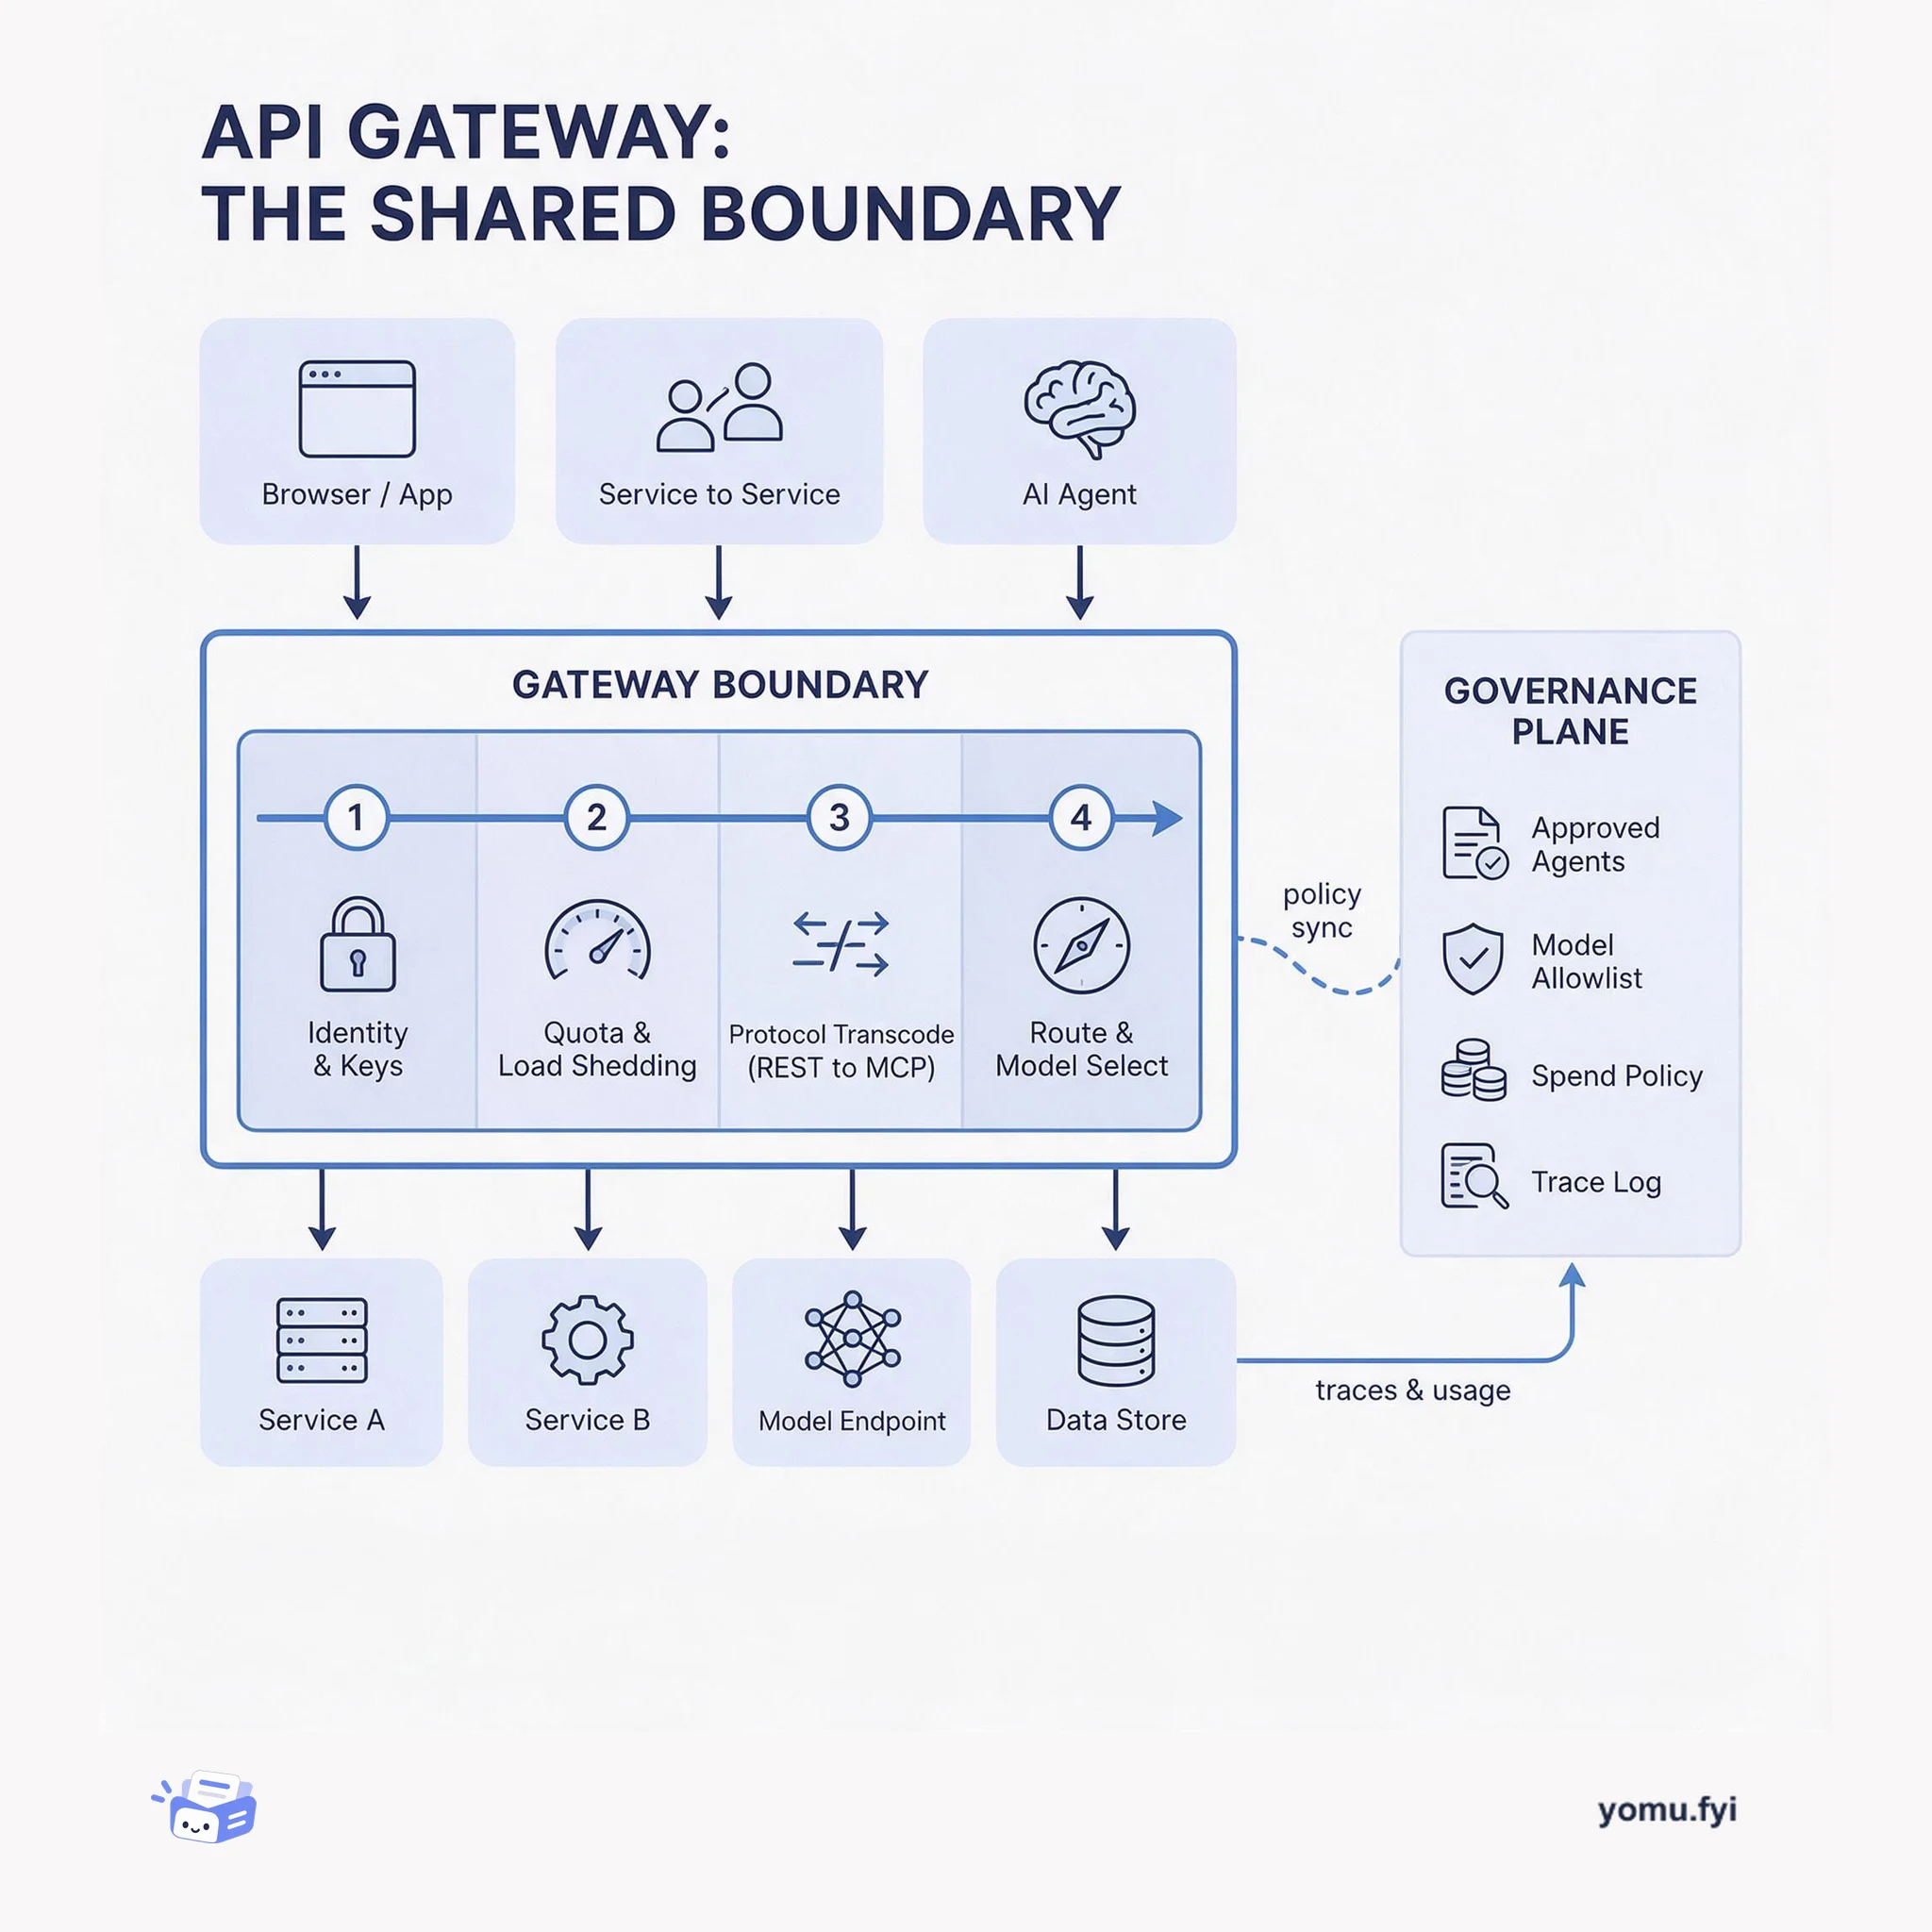
The API gateway is the single boundary where protocol translation, auth, quotas, and routing become shared policy instead of per-service code. This layered diagram shows what belongs there and why.
The Good Stuff
Paid picks we use ourselves. Links carry a referral code — a subscription through one earns us a commission at no extra cost to you.
Newest first
AI-assisted software development shifts the human bottleneck from writing code to reviewing, verifying, and maintaining generated code, while people still define architecture, service boundaries, safety, and reliability. The post presents Go as a language designed for software engineering and argues that its end-to-end platform—built-in formatting, testing, dependency management, security tooling, and a comprehensive standard library—gives teams and AI agents a consistent foundation. Go’s readability, explicitness, standardized syntax through gofmt, static typing, and single-binary portability are described as guardrails that make generated code easier to inspect, validate, and operate. It also identifies gopls, the rebuilt go fix with modernizers, profiling, execution tracing, and profile-guided optimization as tools for maintaining and tuning systems over time. The conclusion is that Go’s consistency and production-oriented tooling can help humans absorb high-volume AI output without sacrificing reliability, maintainability, or system integrity.
Agents Week introduced a series of products and primitives across Cloudflare to support an Agentic Internet where autonomous software and humans interact. Developing capable agents requires addressing technical challenges spanning identity, communication, orchestration, memory, observability, and security. Cloudflare introduced the Agent Development Lifecycle alongside tools like Cloudflare Agents for live tracing, replay, and human-in-the-loop approvals. The releases also included programmable CI/CD pipelines capable of repairing failures, Cloudflare Wallets for agent transactions, and Kitesurf, an agent-first browser running in V8 isolates. New protocols and tools like WebMCP, MCPv2, and Cloudflare AI Search aim to make web data and applications readable, discoverable, and searchable by autonomous software.
Workers AI and AI Gateway are converging into a unified AI control plane to simplify model access, billing, and observability. Developers can now access both services through a single entrypoint using unified Workers bindings and the /ai/ REST endpoint. Specifying a default gateway automatically instruments requests with payload logging, token tracking, and cost attribution without manual dashboard setup. Cloudflare has also rolled out unified prepaid billing, allowing teams to spend AI Gateway credits on Workers AI models while unlocking higher rate limits. Planned future features include model-first routing for automated provider failover and smart routing powered by task classifiers on Workers AI.
AI coding tools have improved velocity metrics at Databricks, but broad deployment creates exponentially growing costs that can threaten the efficiency gains they deliver. The post presents a cost-management playbook aimed at preserving broad, low-friction access while keeping aggregate spending within a roughly fixed per-user envelope. It emphasizes the coding-model efficiency frontier, automated evaluations of internal workloads, model-flexible harnesses or meta-harnesses, and request- or task-level routing to the cheapest capable model. Databricks reports that Unity AI Gateway Smart Router reduced average task cost by more than 30% while roughly matching the most expensive model’s quality, and that harness and caching changes cut generated tokens and associated costs by almost 50% without observed quality degradation. The proposed AI Gateway centralizes model access, budget policies, tool configuration, and coding-session traces for ongoing optimization.
ClickHouse reports a set of updates to its Managed Postgres beta, aimed at simplifying onboarding and advancing its unified Postgres-and-ClickHouse data stack. The redesigned flow supports sample-data loading or PostgreSQL migration through ClickPipes, built-in SQL exploration, replication to ClickHouse, and cross-system queries through pg_clickhouse; services also notify users when disk usage remains above 85%, with console, email, and optional Slack channels. Observability now includes searchable PostgreSQL logs, CPU, memory, disk, IOPS, connection and per-table metrics, query insights, a Prometheus-compatible /metrics endpoint, and an OpenAPI slow-query API. Backups use more CPU and disk throughput on larger servers, making backup and restore times predictable even on 10+ TB servers, while extensions add pg_re2 and improvements to pg_clickhouse and pg_stat_ch, including regex pushdown, Arrow batching, sampling, and safer worker exits; Google Cloud Platform availability and further maintenance, configuration, and integration work are planned.
Discoverability is shifting from traditional search engine rankings to recommendations generated by AI agents acting on behalf of users. To address this shift, Cloudflare integrated Agent Readiness diagnostics and an Answer Engine Optimization tool into its dashboard. The Diagnostics feature evaluates hostnames against machine-readable standards across tiers ranging from robots.txt and Markdown rendering to OAuth discovery and agent payment protocols. Simultaneously, the Answer Engine Optimization tool measures how frequently leading assistants like Claude and GPT cite, mention, and prominently position brands across industry categories. By evaluating prompt responses using Cloudflare AI Gateway and Workers AI alongside access logs, site owners can systematically track agent traffic, benchmark against competitors, and remediate crawl blockers.
Physical Intelligence, which builds robotics foundation models, needed a data stack that could support both transactional operations and high-cardinality analytical workloads. Its previous single RDS Postgres instance could not handle those demands, so the team migrated to ClickHouse Cloud and adopted Postgres managed by ClickHouse for OLTP alongside ClickHouse for OLAP. Postgres is automatically replicated into ClickHouse through ClickPipes, while materialized views, full-text indices, and a query agent help researchers search across the company’s data. The resulting stack supports faster, easier exploration as data volume grows from the 10 billion to 100 billion row range, and also handles telemetry through ClickHouse with ClickStack and Grafana.
Salesforce redesigned its internal observability platform, Argus, to eliminate single-region failure risks while ingesting approximately 4 billion metrics per minute. Operating out of a single AWS region previously created a global blast radius and generated high cross-region data transfer costs. To mitigate these risks without the prohibitive expense of full multi-region replication, the engineering team implemented a geo-local architecture that processes and stores telemetry closer to its origin across production geographies. A newly introduced federation query layer relies on Elasticsearch mappings to route queries selectively to relevant regional clusters, avoiding broad fan-out. The platform also adopted metadata caching for wildcard queries and implemented HTTP 206 partial-response handling to maintain visibility when individual regions experience downtime.
Pointing a standalone OpenTelemetry SDK directly at Sentry ingests spans over standard OTLP, but the spans remain disconnected from Sentry error data. Because the separate SDKs share a process without sharing context, Sentry errors lack active OpenTelemetry trace and span IDs. Sentry introduced OtlpIntegration across backend SDKs including Python, Ruby, Node.js, Go, PHP, .NET, and Java to bridge this gap. The integration reads the active OpenTelemetry context, attaches trace and span identifiers to Sentry events, and configures ingestion. This decoupled model replaces the deeply integrated POTel strategy across most languages, except Java, removing mandatory OpenTelemetry dependencies while maintaining unified trace waterfalls.
Unity AI Gateway is generally available as a centralized way for enterprises to manage AI costs, security, governance, and model choice across agents and other AI assets. It positions Unity AI Gateway alongside Unity Catalog: Unity Catalog supplies identity, permissions, lineage, and auditing, while the gateway applies runtime guardrails and contextual policies across AI interactions. The gateway centralizes usage data in Unity Catalog, offering dashboards, Genie-powered analysis, granular cost attribution, budgets, hard spend caps, and a single-query API for frontier models from providers including Anthropic, OpenAI, Gemini, Kimi, and GLM. Smart Routing is in beta and dynamically selects models using quality, cost, performance, availability, and budget; the announcement says customers already use the gateway at scale, including more than one quadrillion tokens passing through it in the past year.
Early-stage startups face a crowded software market and limited budgets, making technology selection a question of leverage rather than completeness. The guide proposes three selection principles: choose tools that scale with usage, integrate with the existing stack, and solve a clearly defined problem. It then recommends Stripe for payments, Slack for collaboration, Granola for meeting notes, Fin and Intercom for customer service, Linear for planning, Datadog for observability, MongoDB for data, Rippling for workforce administration, and Apollo for outbound sales and CRM. The examples emphasize operational coverage, from Stripe’s subscriptions and MongoDB’s flexible schema to Fin’s stated ability to resolve up to 76% of support conversations. The Fin Startup Pack is presented as a way to reduce adoption costs through partner credits and discounts, including more than $500,000 in credits and specified offers for each recommended tool.
Identical AI computing clusters can exhibit 8% to 12% training throughput deficits compared to NVIDIA reference architectures due to compounded configuration choices across kernels, hypervisors, BIOS, and NCCL settings. Profiling with Linux perf, turbostat, and NCCL tests uncovers performance degradation across multiple layers of the compute stack. In virtualized Grace deployments, enabling Arm SMMU Virtual Command Queue support eliminates invalidation serialization bottlenecks on memory-heavy workloads. On x86 systems, adjusting BIOS C-states to allow idle cores into C6 frees thermal headroom for active cores to achieve rated turbo frequencies, while cpuset isolation resolves NUMA contention. Further gains stem from tuning NCCL queue pairs per connection and properly bind-mounting topology files inside workload containers.
Airbnb outlines its framework for eval-driven development (EDD), treating GenAI evaluation as a continuous engineering discipline rather than an afterthought. The strategy combines programmatic checks, calibrated LLM-as-a-judge evaluators, and human review to detect subtle quality regressions. By inspecting intermediate agentic execution traces and real-world failure modes, teams ensure generative models remain reliable and aligned with product requirements.
Crash reports in non-deterministic game environments often lack player context, making callstack-only debugging difficult. Sentry's SDK version 1.16.0 for Unreal Engine introduces Session Replay to continuously record gameplay and attach the final video clip directly to crash reports. The cross-platform recording pipeline hooks into Slate's backbuffer presentation on the render thread, uses engine pixel shaders for format conversion, and feeds frames to hardware H.264 encoders via Unreal's AVCodecs plugins. Encoded fragments are organized in a rolling ring buffer and periodically written to temporary MP4 files that are uploaded alongside crash data. Benchmark results in a 4K demo game showed an overhead of approximately 0.20 ms per frame.
Software teams frequently defer low-priority bugs to the backlog because manual triage, investigation, and code fixes consume valuable engineering time. To resolve 56 out of 57 backlog bugs, Dan Mindru utilized Sentry telemetry combined with Seer and the hosted Sentry Model Context Protocol server. Sentry captures context including traces, logs, and session replays, allowing Seer to assess fixability scores and generate pull requests with unit tests for isolated issues. For more intricate problems, developers query production breadcrumbs and telemetry directly in their agentic editors while supplying missing historical business logic. Consequently, automated tool calling and agent workflows drastically lowered the economic cost of addressing routine production bugs.
CLA and Databricks built a production document-processing application for auditing that reduces extraction time from hours to minutes without compromising quality, using Databricks-native services including Lakebase Postgres, Databricks Apps, Lakeflow Jobs, MLflow, and Unity Catalog Volumes. Lakebase serves as the orchestration layer’s single source of truth for tasks and execution attempts, coordinating long-running work, retries, leases, priorities, rate limits, costs, and status visibility. The queue uses Postgres patterns including FOR UPDATE SKIP LOCKED, priority and FIFO ordering, expiring leases for crash recovery, and database-backed concurrency controls. Databricks Jobs process PDFs through intelligent document processing and vision/LLM calls, while MLflow Tracing records execution and cost details and dashboard updates combine fast Postgres data with slower billing queries. In production, this architecture avoids external brokers and schedulers while providing durable task management, real-time visibility, and per-task cost attribution.
Long-running NVIDIA TensorRT engine builds can freeze workflows and waste GPU hours when they lack visibility or abort mechanisms. Developers can resolve this by subclassing the IProgressMonitor API in Python or C++ and attaching it to the builder configuration. The monitor tracks hierarchical build phases through start, step completion, and finish callbacks, requiring thread synchronization because TensorRT calls monitor methods across internal builder threads. Returning false from the step completion callback requests early build cancellation, which unwinds active phases in reverse order at the next step boundary. Beyond terminal rendering with ANSI escape codes, teams can stream these progress events to IDE protocols, HTTP service endpoints, or agent tool-call traces.
Sentry released version 2.0.0 of its Godot Engine SDK, introducing general availability for C# and .NET error reporting alongside application metrics. While earlier 1.x releases captured errors from GDScript, native C and C++ code, and the engine itself, version 2.0.0 captures runtime exceptions from managed C# code on the same trace as engine and GDScript events. The SDK synchronizes scope elements such as tags, breadcrumbs, and user context, while integrating with source control managers like GitHub to fetch surrounding source code frames. Developers can also emit custom metrics over fixed intervals or game events to evaluate performance distributions and gameplay progression. These metrics allow slicing by custom attributes such as CPU and GPU hardware configurations to pinpoint hardware bottlenecks or rebalance game variables.
Logging arbitrary JSON objects often produces unstable messages and deeply nested data that complicate searching, aggregating, and debugging production incidents. Structured logging treats log output as real application data by establishing predictable, consistent schemas across services. Engineers should define stable event names using a domain.action pattern and capture dynamic dimensions with flattened, snake_case attributes formatted in dot notation. Attribute payloads must contain only primitive values or primitive arrays rather than arbitrary objects, utilizing low-cardinality result identifiers and explicit units for numeric measurements. Teams can enforce these structural conventions automatically with linting tools such as ESLint, while routing execution durations and timing measurements to tracing spans.
Measuring MongoDB performance in a .NET application requires command details, durations, and enough context to distinguish isolated spikes from recurring query patterns. The post presents an end-to-end setup that uses MongoDB’s built-in OpenTelemetry Activity instrumentation, the .NET OpenTelemetry SDK, Sentry.OpenTelemetry.Exporter, and OTLP ingestion rather than a dedicated Sentry.MongoDB integration. Configuration initializes Sentry with UseOtlp(), subscribes to MongoTelemetry.ActivitySourceName, adds MongoDB instrumentation, and exports spans with AddSentryOtlp(...), while avoiding duplicate spans from overlapping hooks. Query context appears in Sentry traces, span samples, and the Queries experience, with Relay generating parameterized values for aggregation but retaining raw db.query.text per span. The post also demonstrates client-side redaction and describes server-side scrubbing, while exporter propagation bridges preserve correlation with errors and replays.
The best engineering reads, once a week.