What Is a Real-Time Test Loop?
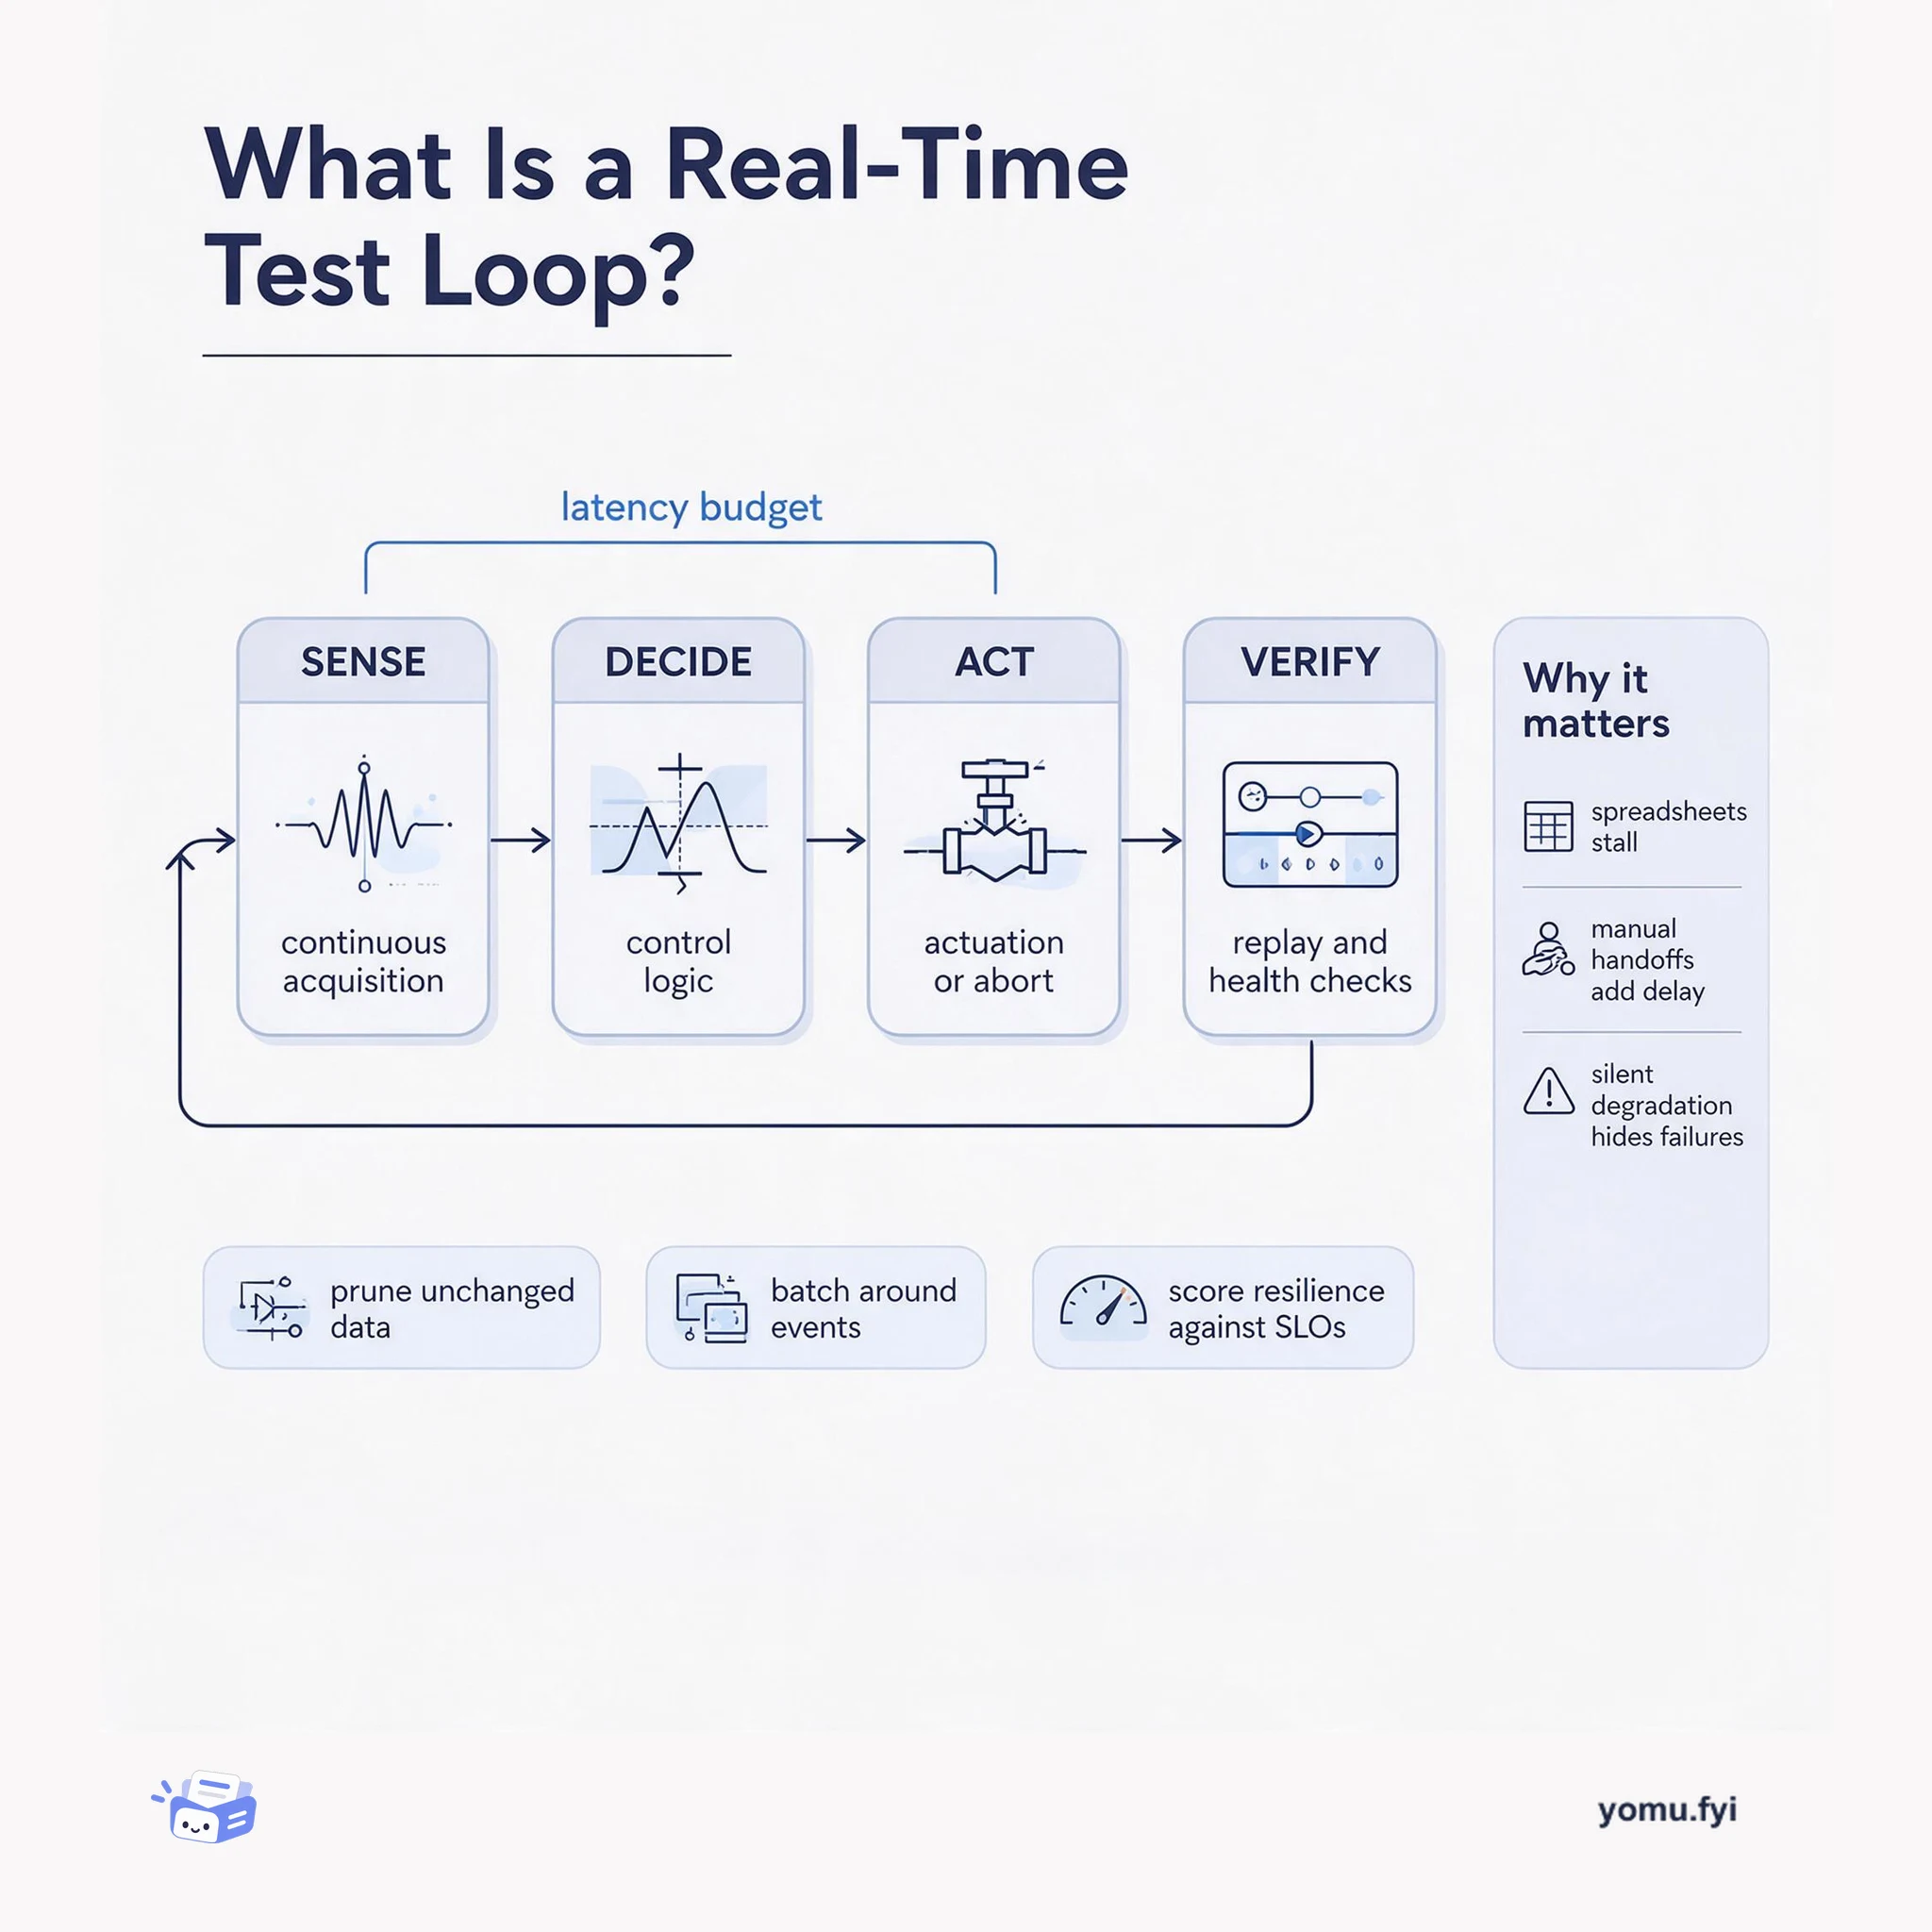
A real-time test loop is the closed path from sensor acquisition to control action and back to verification. This explainer maps its four parts and the latency budget that binds them.
Loading…
Topic
244 posts about Observability. Every summary links to the original.
See the idea
A real-time test loop is the closed path from sensor acquisition to control action and back to verification. This explainer maps its four parts and the latency budget that binds them.
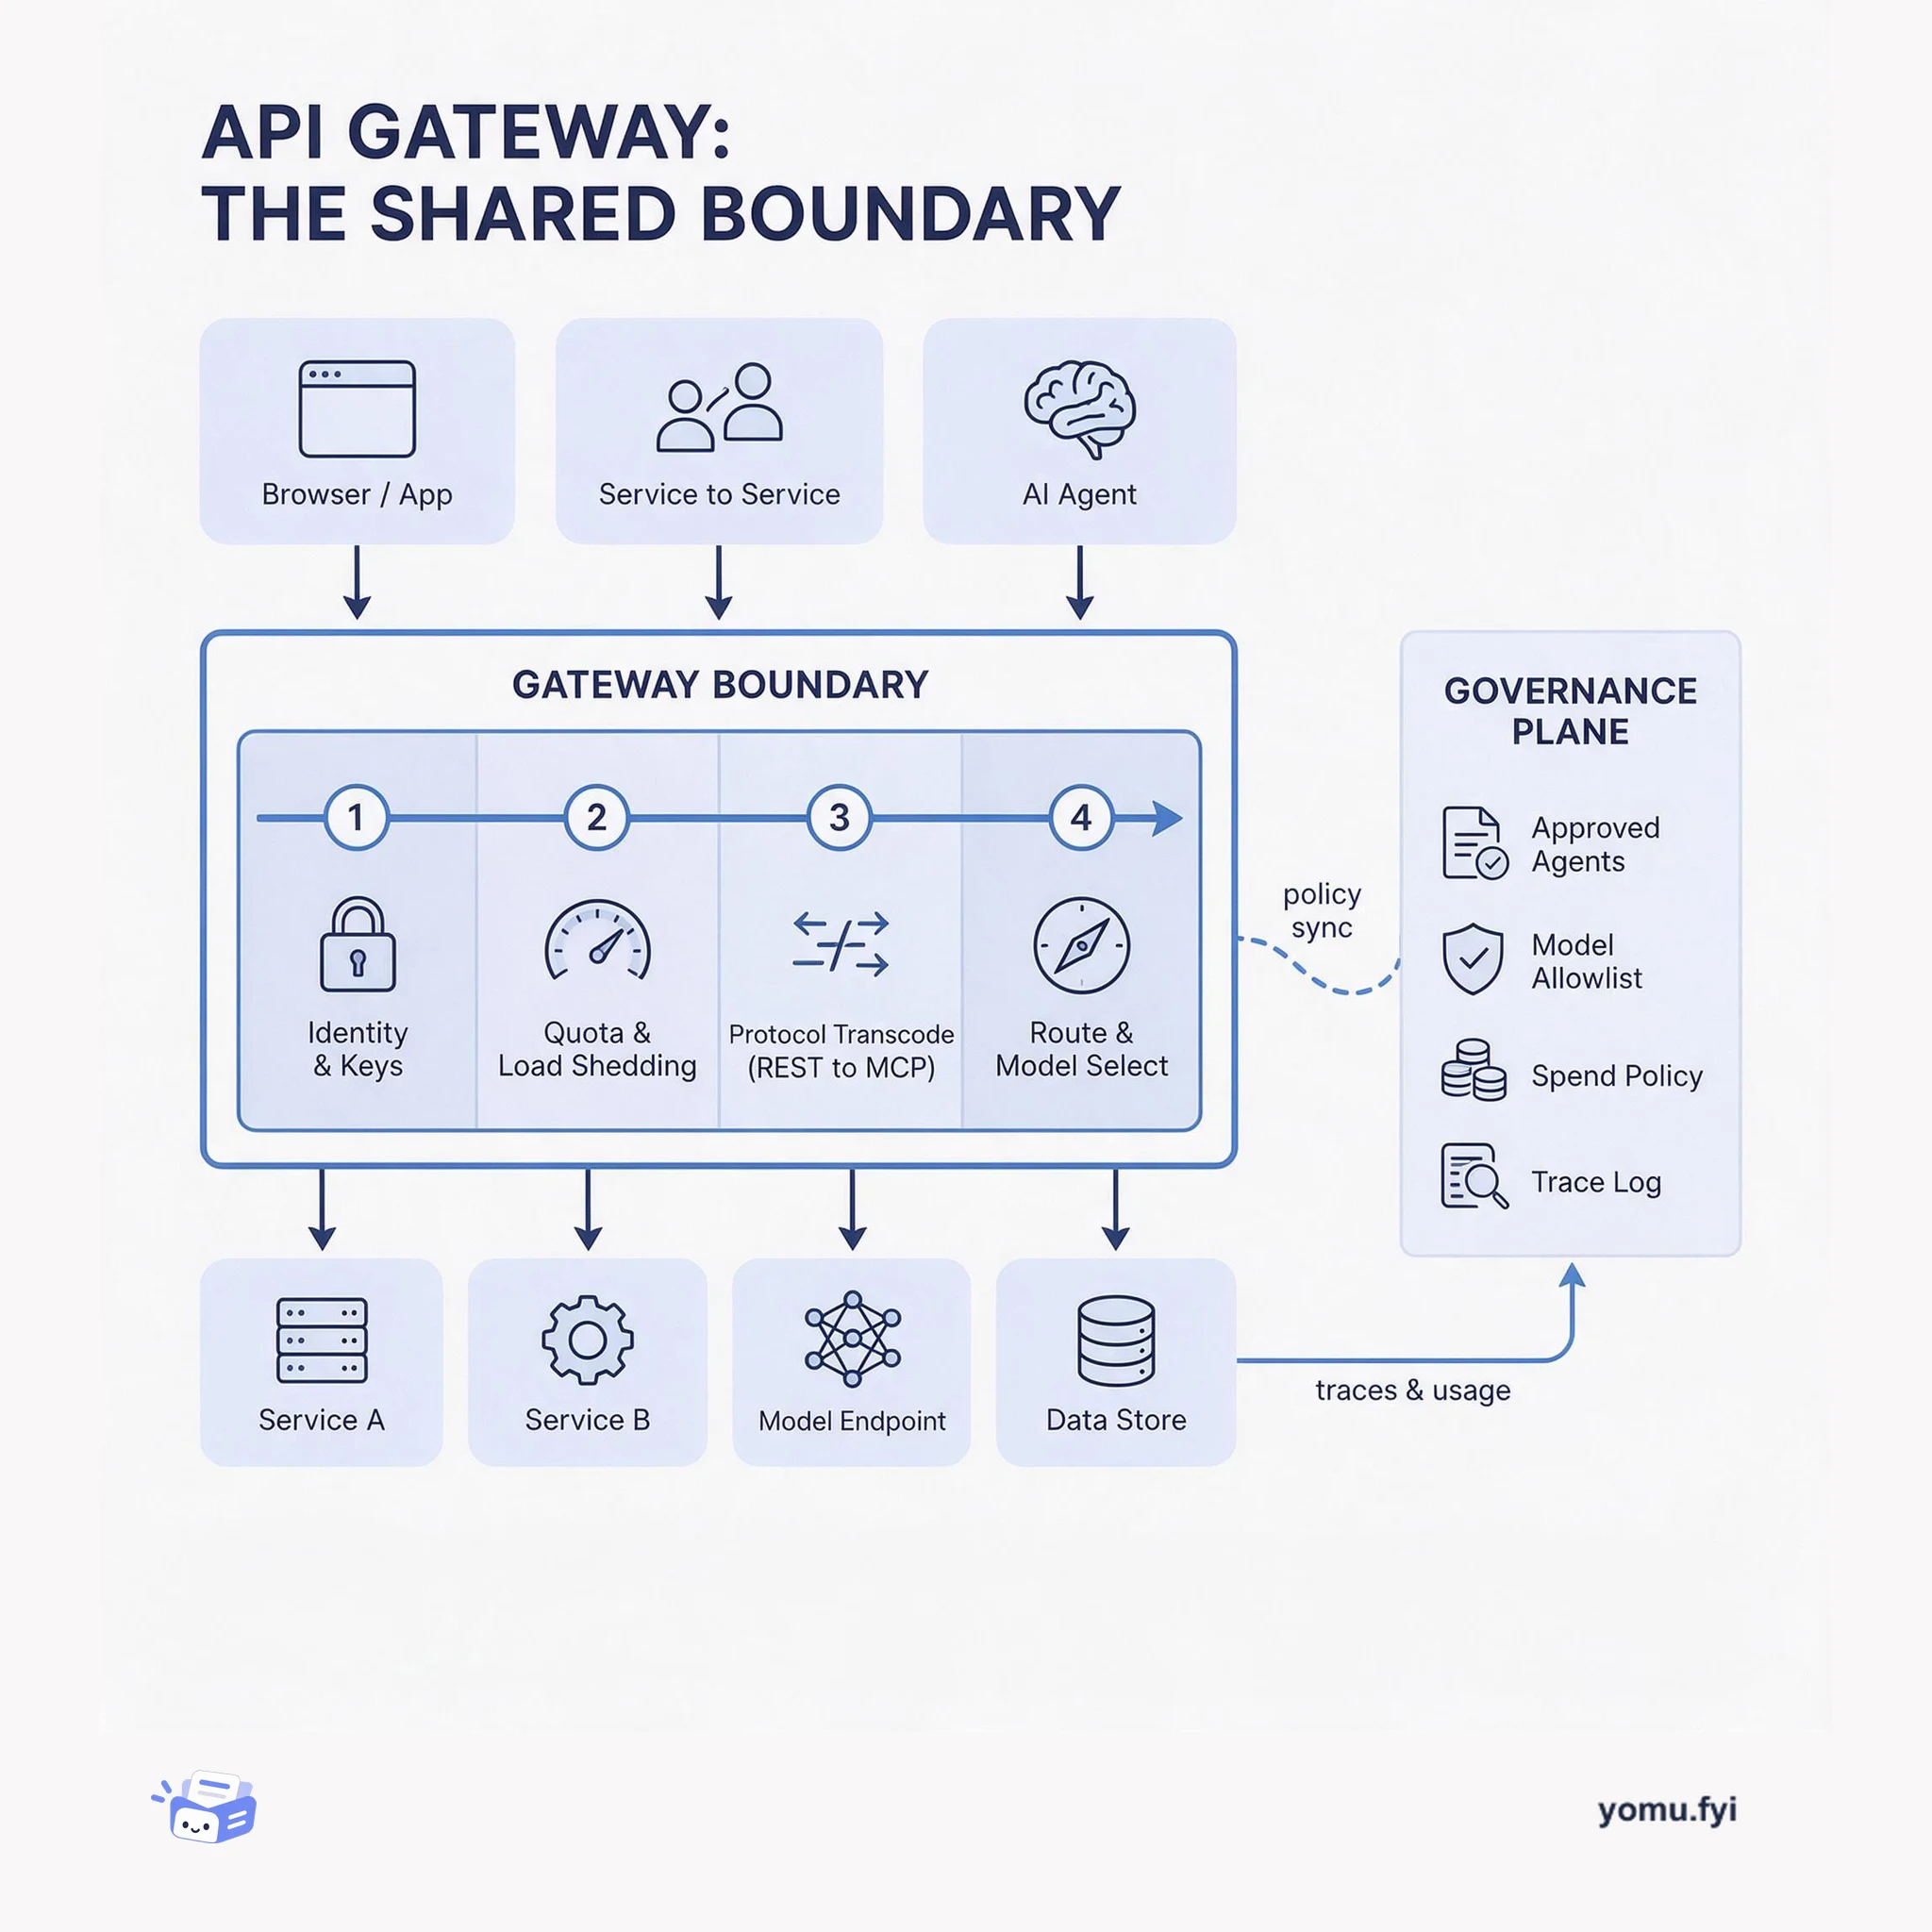
The API gateway is the single boundary where protocol translation, auth, quotas, and routing become shared policy instead of per-service code. This layered diagram shows what belongs there and why.
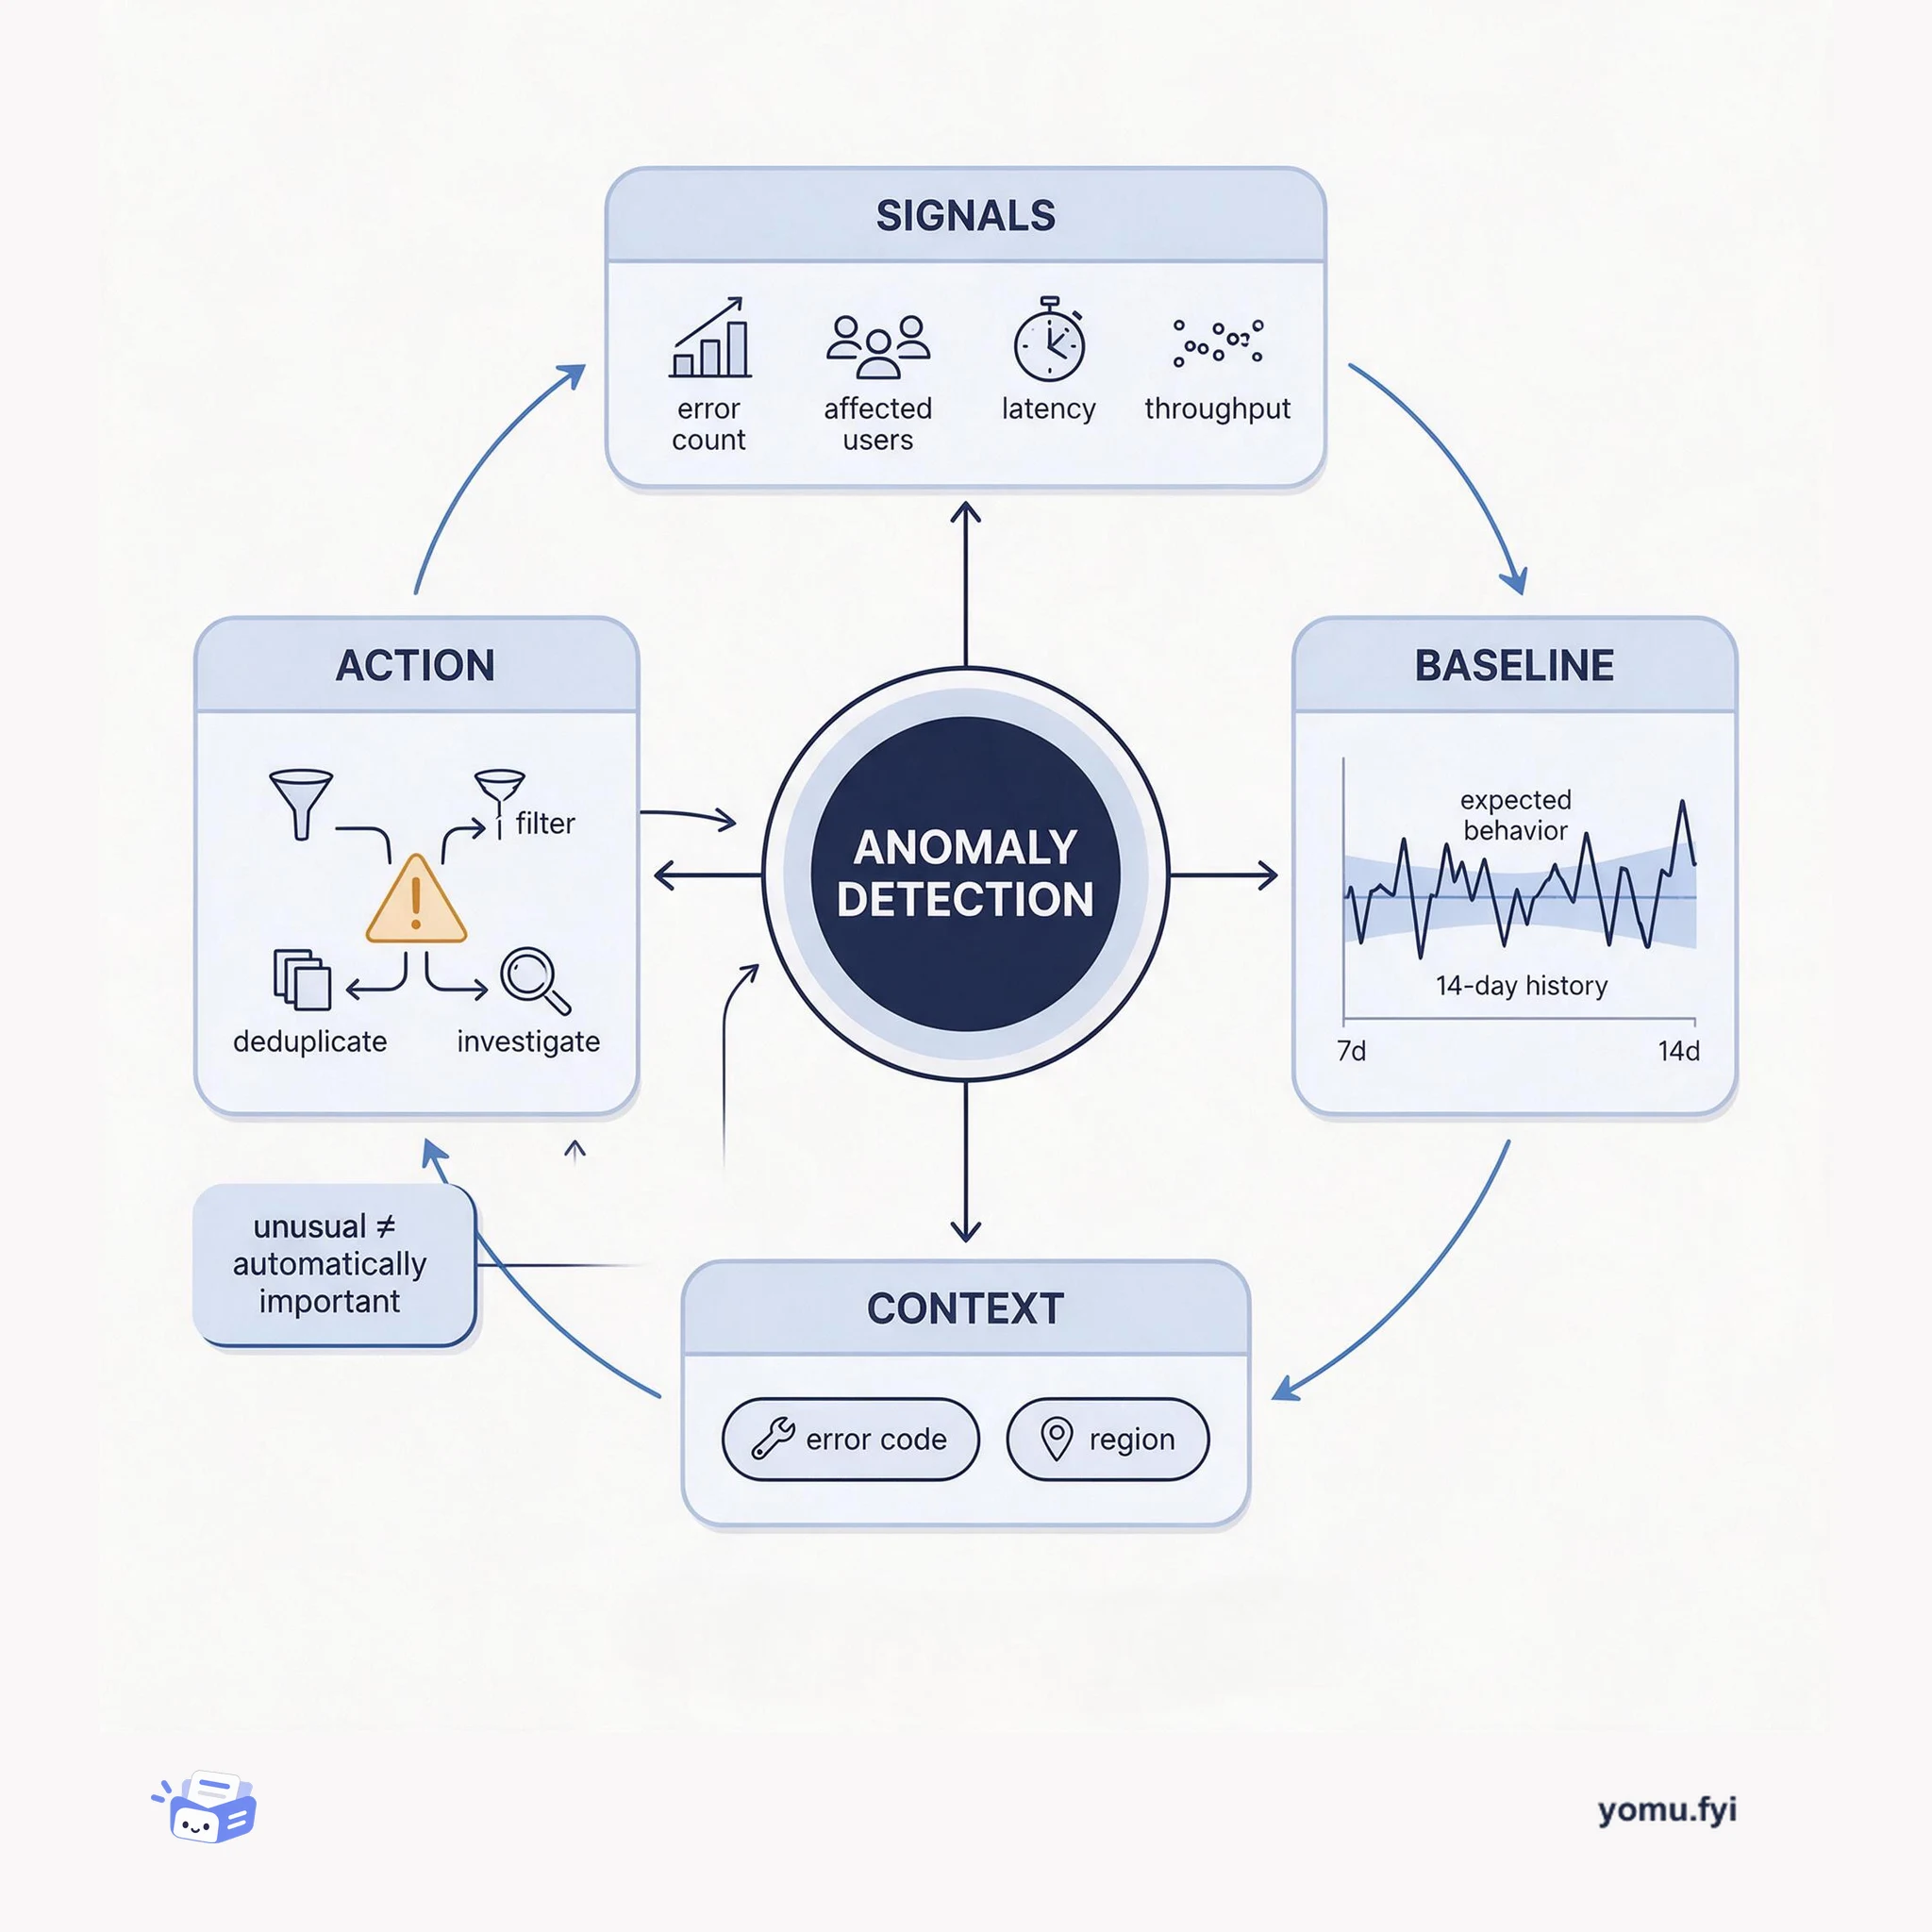
Anomaly detection identifies meaningful departures from expected behavior. This explainer shows how signals, baselines, context, and alert routing turn unusual measurements into engineer-ready findings.
The Good Stuff
Paid picks we use ourselves. Links carry a referral code — a subscription through one earns us a commission at no extra cost to you.
Newest first
The conversation examines the economics and platform implications of operating dozens or hundreds of AI agents rather than a small number of human-driven workflows. Andi Gutmans argues that many current models are already sufficient for automation, shifting the optimization problem to the complete system: model, harness, context, personalization, and evaluation. The goal is the least sophisticated model and smallest viable context that produce a reliable outcome at the lowest cost, with better trajectories reducing reasoning loops and token processing; Google’s stated approach is to hill climb models and data together. The discussion also addresses cost governance, search and observability for agents as a distinct persona, human-in-the-loop handling, and the continuing importance of computer-science fundamentals, agentic fluency, and business judgment.
PostgreSQL 19 adds four system views for lock contention, recovery, autovacuum priorities, and dynamic shared memory allocations. The article presents pg_stat_lock as cumulative, cluster-wide statistics with one row per lock type, reporting waits, total wait time, fastpath_exceeded, and stats_reset; waits and wait_time count only successfully acquired locks that exceeded deadlock_timeout, while fast-path overflow attempts are counted separately. Examples reset statistics, reproduce a 2.5-second table lock, and scan 140 partitions, producing 1 wait, 2201.783 milliseconds, and 422 fast-path overflows. The post describes recovery and autovacuum views, noting that autovacuum scores suggest likely priorities rather than guarantees because scoring and worker scheduling can differ. DSM registry entries expose name, type, and size; NULL means initialization failed.
Uken Games replaced Datadog with an open-source observability stack built around ClickHouse to monitor backend services supporting mobile games with millions of players. The migration addressed rising Datadog costs and vendor lock-in while targeting pragmatic feature parity across metrics, traces, and logs. OpenTelemetry collectors run in two layers: lightweight agents on ECS instances pre-filter traces, while an autoscaling gateway batches and buffers writes to SigNoz on ClickHouse; managed Prometheus handles metrics, CloudWatch retains logs, and Grafana provides dashboards and alerts. Uken samples ordinary traces, retains errors and high-latency requests, computes alert metrics without sampling, and limits retention to two weeks. The resulting system stores all traces on one ClickHouse node using about 170 GB, operates without migration downtime, and costs about $12,000 annually—an 87% reduction.
Cliparr’s video size estimator was intended to predict output size from target bitrate multiplied by clip duration, but real-world results could vary because its VBR encoder changes bitrate with content. Rather than manually testing a matrix of formats, codecs, and quality settings, the author extracted the browser-based export engine into Cliparr Convert, a standalone static converter, and instrumented it with anonymous Sentry Application Metrics. Completed conversions record actual and estimated bytes, their ratio and delta, plus attributes such as output format, quality, and estimator basis; counters also track conversion completion and the progressive web app installation funnel. The resulting dashboard exposed an estimate that was off by 83% and supports grouping real usage by conversion conditions, while sending only numeric metrics and not media, filenames, or URLs.
Twilio research reports a major gap between brands’ and consumers’ accounts of AI-agent disclosure: 81% of brands say agents identify themselves immediately, while only 22% of consumers report that experience. Teams may treat a system-prompt line, widget label, or one-time channel message as disclosure, even though customers can miss it or encounter a different experience on SMS or voice. Recommended practice includes naming “AI agent” at the first turn, repeating disclosure across channels, explaining accessible data and decision logic, and offering an immediate route to a person. It also recommends checking transcripts rather than trusting configuration, using conversation analysis to verify whether disclosure fired. Research cited says 76% expect identification at the start, 49% want data-access transparency, and 54% trust AI more when its logic is explained.
Cloudflare launched BotBase for Operators to give bot operators a clearer way to submit, monitor, update, and cancel bot-directory submissions from the dashboard. The new area includes a bots directory, submission form, and history tab with Waiting for review, Accepted, and Rejected statuses, including rejection reasons and classification changes. Its intake model records what a bot does, how it uses content, and whether it is direct or intermediary, while allowing multiple behaviors and Content Signals declarations. Reviews now use automated checks for duplicates, user-agent specificity, and verification through IP lists, reverse DNS, or Web Bot Auth, routing exceptions to staff. The launch focuses on visibility, with ownership, observability, and conversation identified as future goals.
Sentry is replacing the JavaScript SDK boolean option sendDefaultPii with dataCollection, a category-level control for automatically collected data. In version 11, dataCollection becomes the default, sendDefaultPii is removed, and several categories—including user information, cookies, HTTP bodies, GenAI inputs and outputs, database query data, and stack-frame variables—are collected by default. The post distinguishes PII, which is collected by default, from sensitive credentials, whose values in collected headers are filtered automatically; manually attached data remains unaffected. Developers can preserve v10’s restrictive baseline or select true, false, allow lists, and deny lists for supported fields, while beforeSend and beforeSendSpan handle additional filtering. Because v11 also enables span streaming by default, span drops move to ignoreSpans, and existing withStreamedSpan wrappers should be removed.
Grab’s data mesh uses the Signals Marketplace to publish, discover, and reuse trusted data products, while certification establishes ownership, documentation, lineage, and quality controls but does not prevent runtime failures. Data Production Issues (DPIs) turn data-quality signals into an operational workflow that begins when Kinabalu detects unhealthy contract tests and closes when the underlying condition recovers. Triage promotes meaningful contract breaches, deduplicates repeated signals, groups related issues, and records affected assets, intervals, contracts, tests, and dependencies. For diagnosis, the Data Health API exposes a portable taxonomy of UPSTREAM_ERROR, PLATFORM_ERROR, JOB_ERROR, and DATA_ERROR, allowing ownership to follow the likely root cause while platforms retain detailed internal diagnostics. Combined with Hugo’s diagnosis and remediation patterns, the approach is presented as reducing resolution time and feeding operational reliability back into certification.
Traditional application monitoring treats AI workflows as black boxes, leaving engineering teams unable to determine whether incorrect responses result from model hallucinations or erroneous upstream tool data. MLflow provides AI observability by capturing distributed traces containing model calls, prompts, retrieved context, execution latencies, and tool interactions. In an example mortgage lending application, trace inspection revealed that an AI assistant accurately summarized raw JSON data returned by an internal pipeline tool rather than hallucinating conflicting metrics. Beyond latency attribution and tool debugging, MLflow is compatible with OpenTelemetry and provides automatic tracing integrations for frameworks such as LangChain and Claude Code. Capturing these traces enables teams to evaluate subsequent application versions, detect model provider shifts, and identify tool regressions before reaching users.
Session replay software varies fundamentally based on architecture, distinguishing tools designed for product analytics from those built for developer debugging. Recording approaches split into DOM snapshot and mutation capture, which optimizes for compression and structured debugging, versus pixel capture, which favors visual fidelity for complex animations. Privacy depends heavily on masking location, where client-side masking redacts data before network transmission, whereas server-side scrubbing acts after transmission. For engineering teams, integration depth connects replays natively to traces, console errors, and backend issues rather than requiring timestamp lookups across separate products. Performance costs across CPU, memory, and network require benchmarking on target applications alongside strategies like error-based sampling.
With the 2026.2 release, JetBrains expanded its OpenTelemetry plugin from Rider to IntelliJ IDEA, GoLand, PyCharm, and WebStorm. The tool captures logs, metrics, traces, and service maps locally without requiring an external observability backend. Developers can search structured log records, plot metric values over time, inspect distributed spans, and verify communication paths across databases and message queues during local runs. To ingest telemetry, the plugin automatically configures OpenTelemetry Protocol environment variables for supported run configurations and terminal sessions, or accepts forwarded data from existing collectors. Additionally, experimental Model Context Protocol support allows AI coding agents to query gathered logs, spans, and service topology.
Databricks introduces Governance Hub, a beta account-level interface for platform and governance teams overseeing estates spanning hundreds of workspaces and multiple regions. It consolidates data health, access, AI usage, and cost information across AWS, Azure, and GCP, replacing scattered system tables, workspace views, and third-party tools with drill-downs for metadata gaps, principal access, token and model activity, and untagged spend. The hub also integrates with Genie, allowing users to ask governance questions in natural language and receive answers and recommendations grounded in governance data; future actions such as configuring policies and alerts are described as planned. Account admins enable it from the Account Console, with access varying by role and existing permissions respected, while upcoming features include performance and security insights and delegated recommendations.
The ClickHouse .NET Driver moved from its 1.0 stable release to versions 1.1–1.3, changing how applications insert, read, and parameterize data while expanding type coverage, configurability, observability, and .NET ecosystem integrations. The largest ergonomic change is registered POCO support: RegisterPocoType() validates mappings up front, pre-compiles getters and setters, and enables InsertBinaryAsync with IEnumerable plus lazy QueryAsync() results through IAsyncEnumerable. Attributes customize column and ClickHouse type mappings, JSON serialization supports POCOs with paths and ignored properties when JsonWriteMode is Binary, and three optional extension points govern parameter type inference, wire formatting, and read conversion. The announced 1.4 roadmap targets allocation reductions, pluggable compression, and box-free POCO operations; version 1.5 is planned to add a Native/TCP client with columnar transfer and server progress information.
Agent observability captures the sequence of decisions an agent makes between model calls, not just request-level metrics, and is distinct from monitoring (health) and evaluation (quality). Unlike deterministic database systems, an agent can succeed at every step yet fail overall—for example, looping forever on a failed fix while spans report success. The primary artifact is a trace, a parent-child tree of spans covering agent invocations, model calls, tool executions, and memory reads and writes. OpenTelemetry GenAI conventions define span types like create_agent and execute_tool, but the standards are still in development and change frequently; vendor support includes Datadog, Honeycomb, and frameworks like LangChain and CrewAI. A reasoning trace layer on top of operational telemetry explains why an agent chose that path; in multi-agent systems the trace must span the full coordination chain, not one agent’s output.
Databricks describes AI SRE, an AI-powered debugging agent for operating hundreds of microservices across more than 1,500 Kubernetes clusters, 70+ regions, and three clouds. It addresses incident investigations by assembling context from platform health, service telemetry, changes, dependencies, and team-specific runbooks, with automatic triage followed by interactive, natural-language investigation. The platform uses layered primitives, purpose-built APIs, and a core orchestration engine; team-owned agentic runbooks encode domain procedures, while controlled access and evidence links support auditing. The post reports support for more than 150 teams, 250+ weekly active users, and over 2,000 daily investigations, with users saving several hours of debugging time.
Agentic AI factories connect diverse users, agents, applications, data sources, and storage systems to massively accelerated compute, making dedicated DPU processing essential for line-rate networking, storage, and security. Scale-In evolves north-south access into a coordinated infrastructure domain built with BlueField-4, NVIDIA DOCA, and Spectrum-X Ethernet. BlueField-4 combines programmable control-plane processing with inline data-path engines, a 64-core Grace CPU, LPDDR5X memory, PCIe Gen6 host connectivity, and an 800 Gb/s network interface. The architecture offloads security, tenant isolation, storage protocols, provisioning, and telemetry from host CPUs; the source states that Spectrum-X storage paths can provide up to 1.45x the throughput of off-the-shelf Ethernet, while independent control and observability support more consistent operations as AI infrastructure scales.
LogHouse’s OpenTelemetry pipeline ingests 50 million events per second and stores 177 PiB of uncompressed data, but its initial agent-to-gateway design could not reliably absorb ClickHouse backpressure. In-memory queues caused instability during short-lived spikes or database outages, while local collector write-ahead logs made gateways stateful, slowed recovery, delayed fresh telemetry behind FIFO backlogs, and took about four hours to drain 1 TiB. The team rejected adding Kafka because operating a new tier-zero service across cloud regions was not justified for this use case, then designed a custom architecture using blob storage, the OTel failover connector, overflow notifications, and a catchup collector. In staging, failover redirected 120,000 events per second to S3 without changing gateway resource usage, and recovery resumed ClickHouse writes while the catchup collector drained the queue; the design scaled from 10 million to 50 million events per second, with added regional setup and less precise recovery visibility.
The Postgres VM described here runs PgBouncer instances, a backup agent, metrics exporters, a local Prometheus, a log collector, and watchdog timers alongside the database. Those processes share machine-wide resources outside Postgres’s huge-page-backed shared_buffers, so leaks, CPU saturation, or disk exhaustion can threaten database availability. ClickHouse Managed Postgres places supporting services in a cgroup v2 slice and combines Go runtime GOMEMLIMIT targets with systemd memory.high and memory.max enforcement. GOMEMLIMIT encourages earlier garbage collection, memory.high applies reclaim and throttling, and memory.max provides a hard ceiling whose OOM scope excludes Postgres because it uses a separate cgroup. CPU weights, bounded buffers, log and metric controls, disk thresholds, and exemptions for replication and monitoring sessions extend isolation across other failure modes; these controls are enabled by default.
During major infrastructure incidents, critical system logs and diagnostic evidence are frequently overwritten, lost, or erased by emergency recovery efforts before engineers can investigate. To solve this visibility gap in multi-cluster environments, an open-source event-driven diagnostic operator was developed as an automatic first information report collector. Deployed on a central hub cluster, the operator monitors Kubernetes warning events rather than relying on heavy polling. When an event matches a predefined regular expression pattern, the operator identifies the target spoke cluster, copies its kubeconfig secret, and spins up an independent must-gather job. Diagnostic data is written to off-site or shared storage with a configurable retention window, preserving forensic context without human intervention.
AgentFlo designed an architecture using Amazon Bedrock AgentCore and AWS serverless infrastructure to address traffic spikes and build trust in autonomous commerce agents. Security operates across three stages: AWS Fargate filters prompt injections and opt-outs, AgentCore Gateway enforces deterministic Cedar authorization policies during tool execution, and post-turn privacy filters screen outputs. Session isolation is maintained across merchants through AgentCore runtime microVMs, while AgentCore Observability and Amazon CloudWatch provide end-to-end tracing. Data reliability and long conversation journeys rely on Amazon DynamoDB context storage, Amazon Bedrock Knowledge Bases, and Amazon S3 Vector embeddings. Early deployment data showed a 12 percent net revenue uplift.
The best engineering reads, once a week.