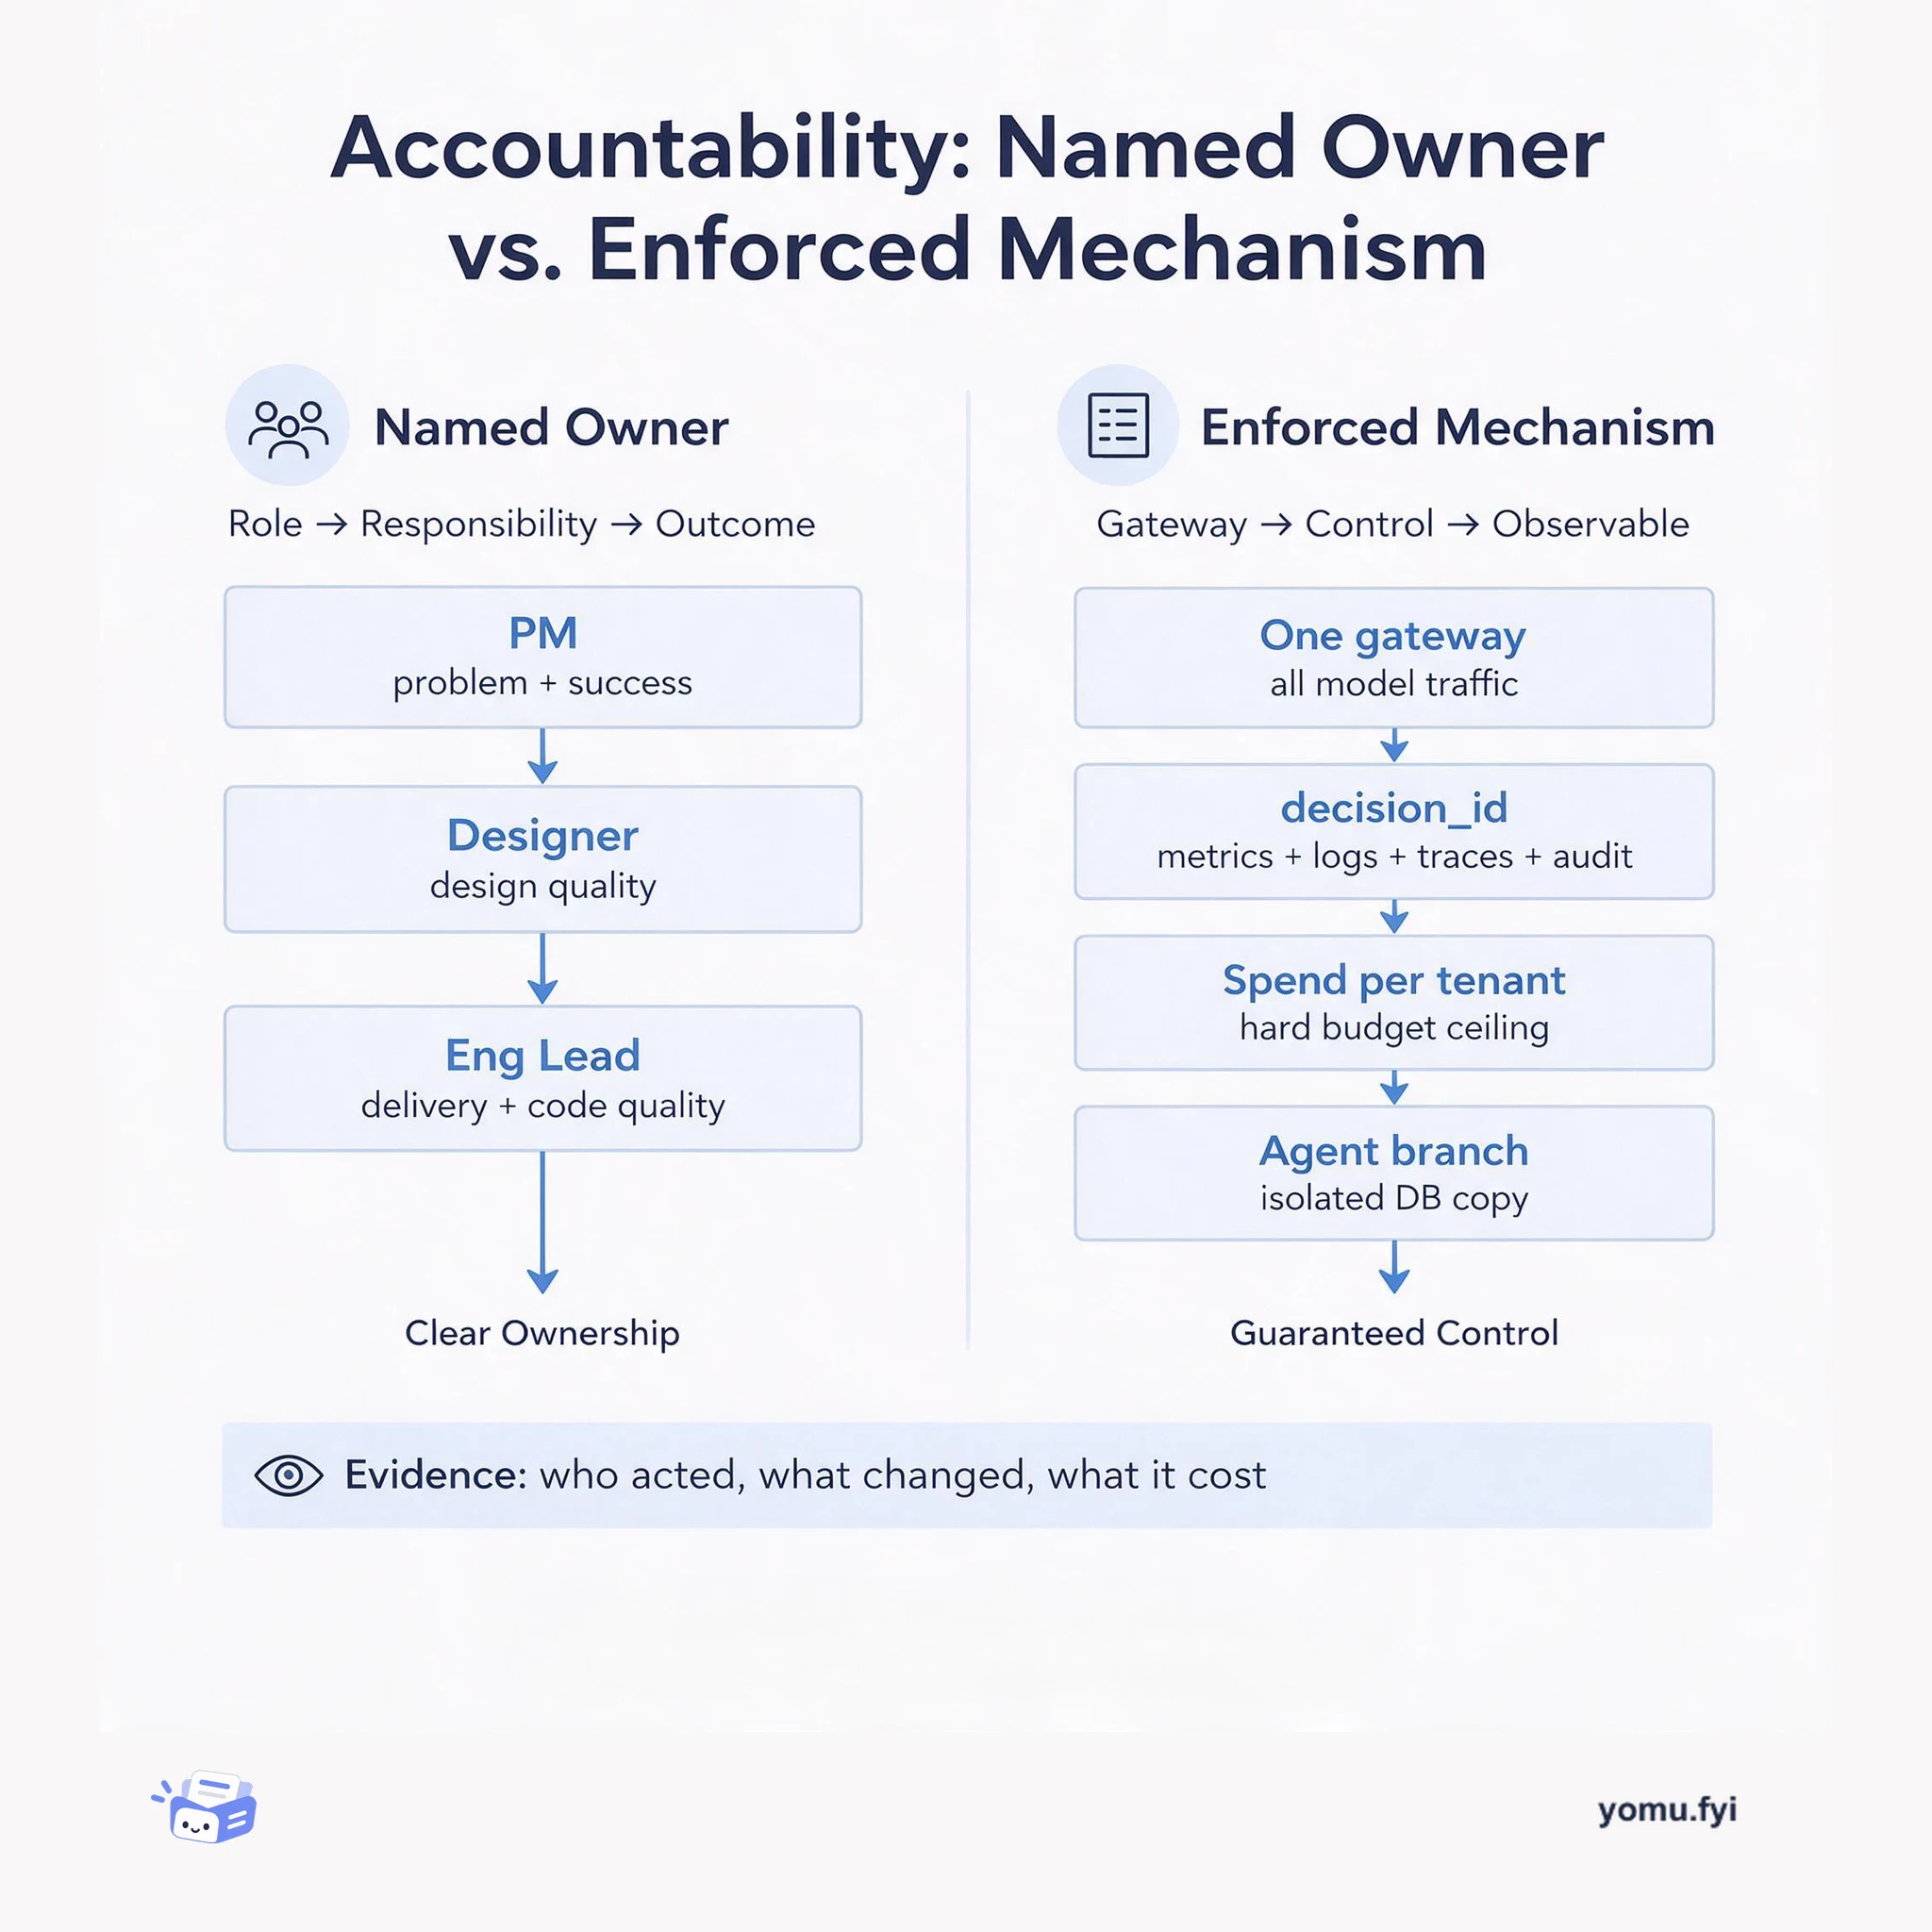
Accountability: Named Owner or Enforced Mechanism?
A side-by-side comparison of the two accountability models engineers actually rely on: a named human owner per outcome, and system-enforced traces, budgets, and isolation.
Loading…
Topic
249 posts about Observability. Every summary links to the original.
See the idea
A side-by-side comparison of the two accountability models engineers actually rely on: a named human owner per outcome, and system-enforced traces, budgets, and isolation.
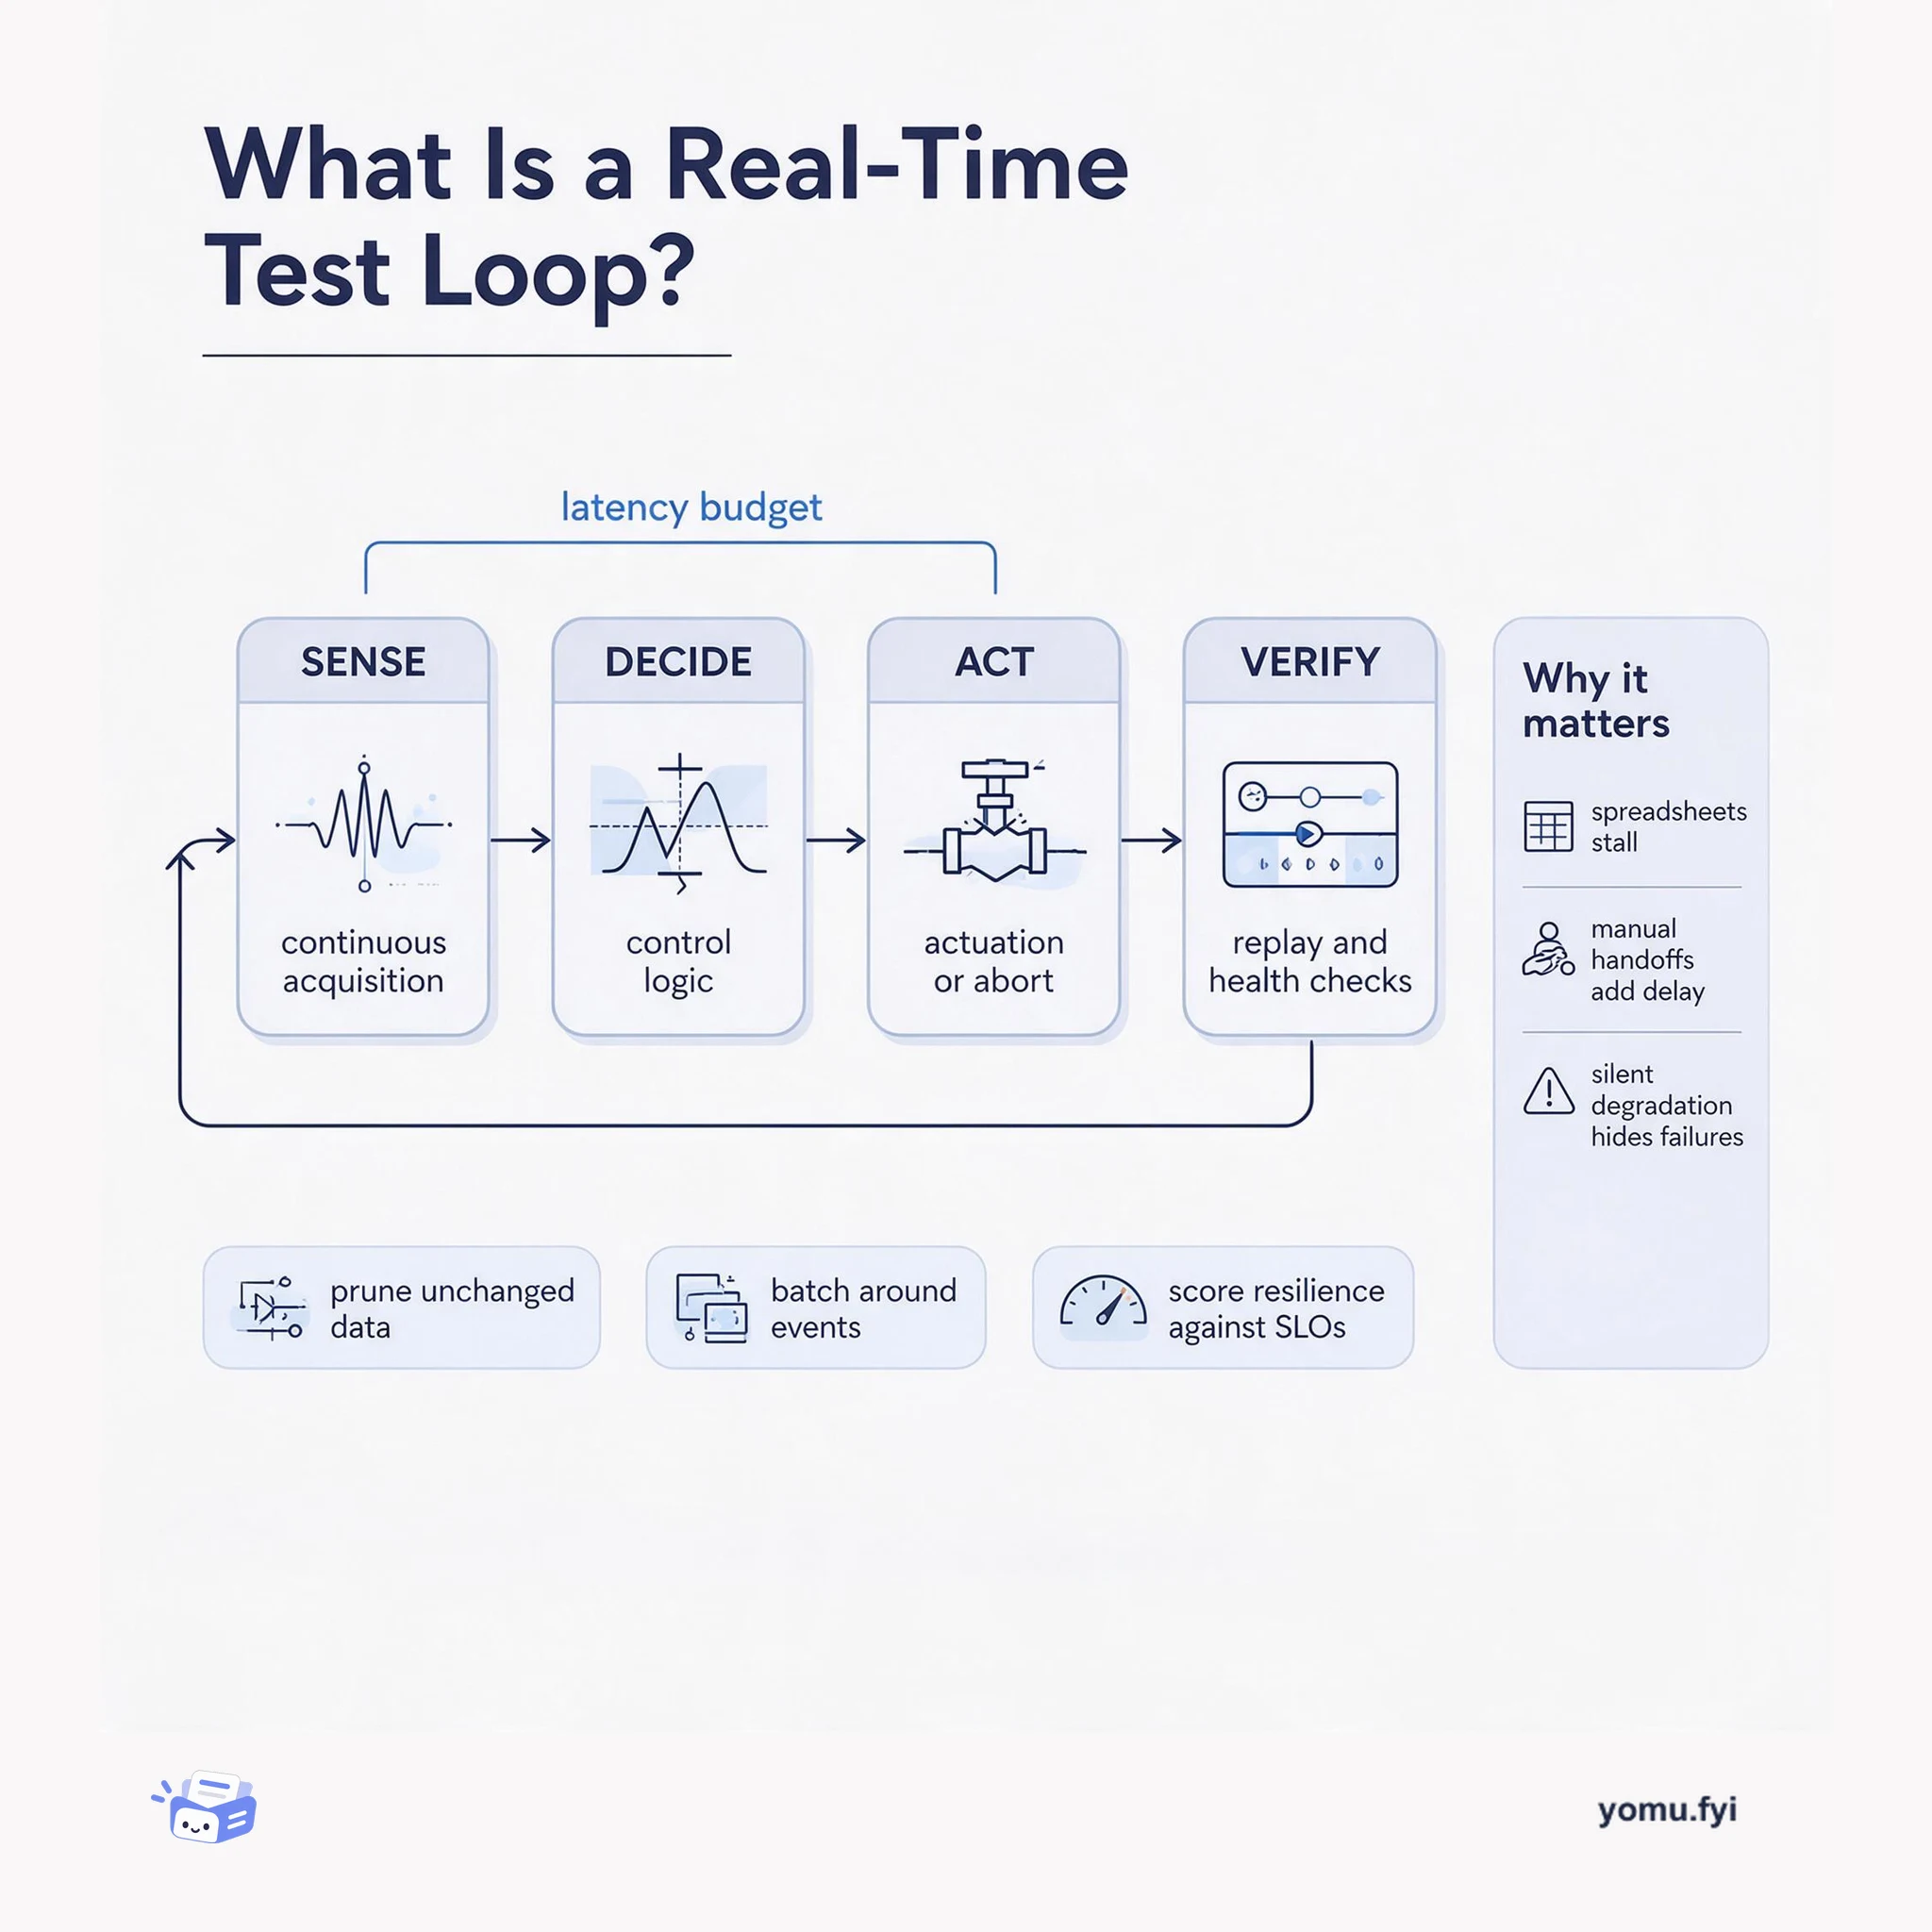
A real-time test loop is the closed path from sensor acquisition to control action and back to verification. This explainer maps its four parts and the latency budget that binds them.
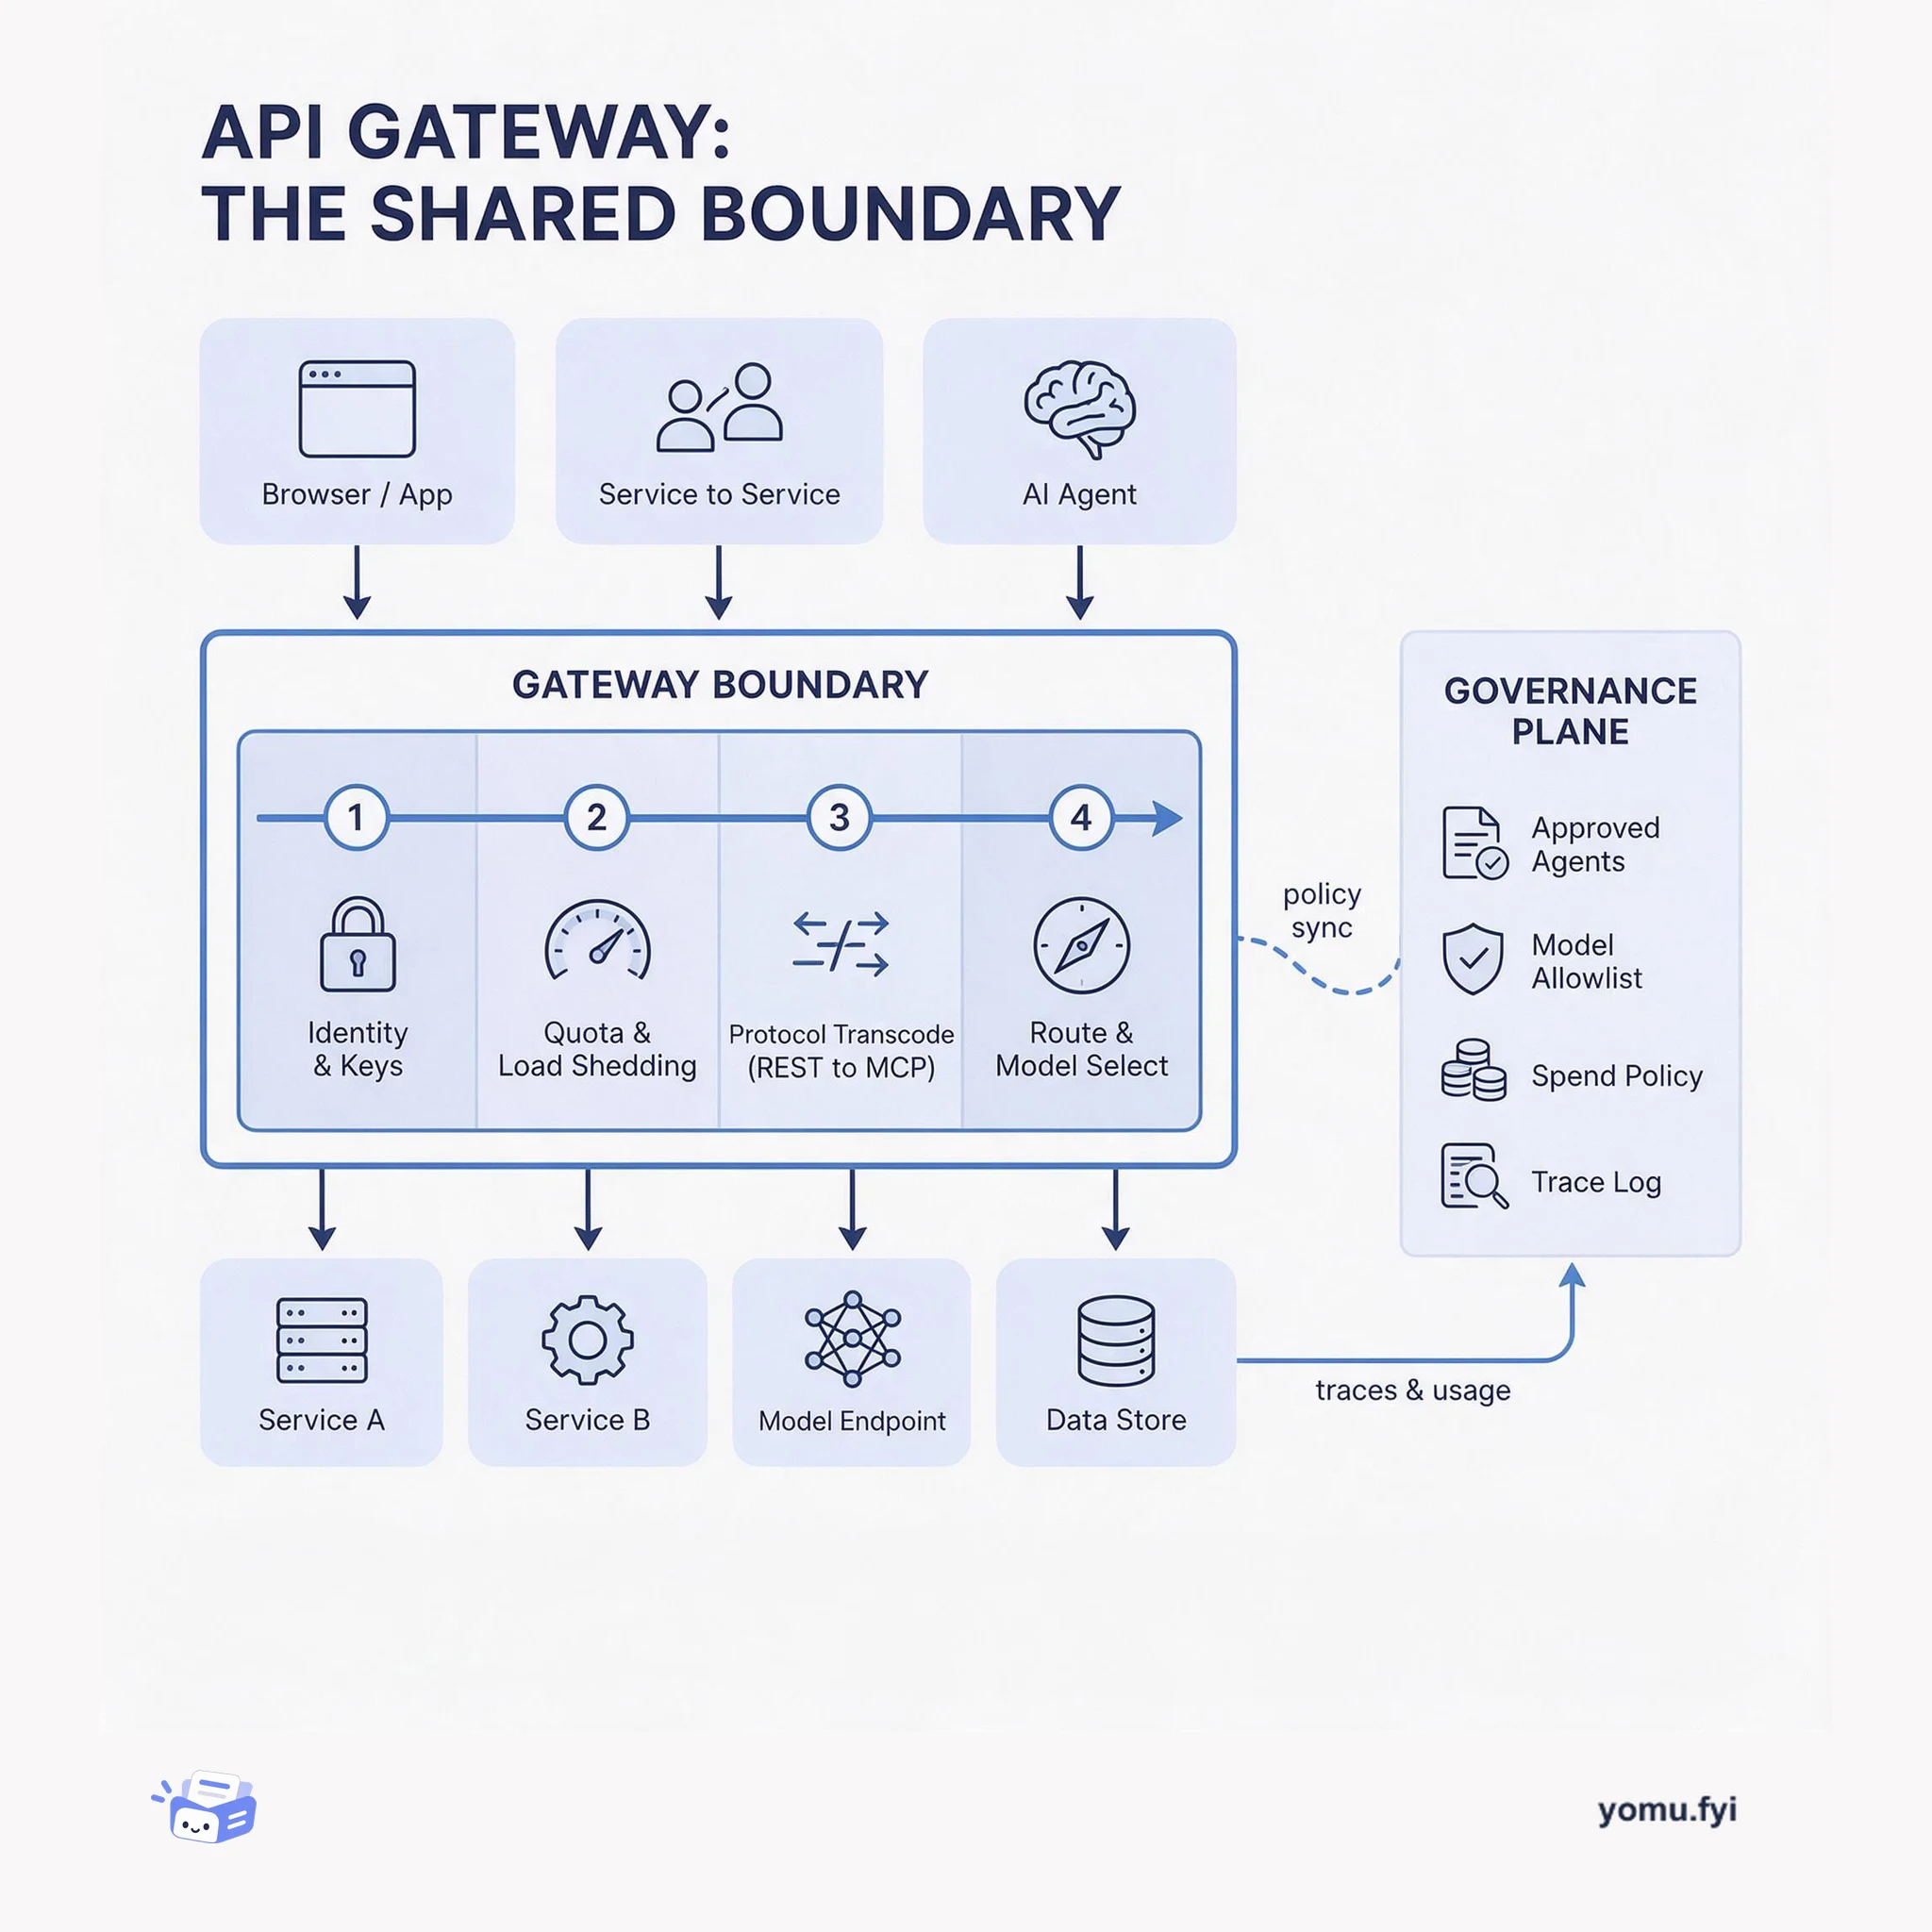
The API gateway is the single boundary where protocol translation, auth, quotas, and routing become shared policy instead of per-service code. This layered diagram shows what belongs there and why.
The Good Stuff
Paid picks we use ourselves. Links carry a referral code — a subscription through one earns us a commission at no extra cost to you.
Newest first
Measuring MongoDB performance in a .NET application requires command details, durations, and enough context to distinguish isolated spikes from recurring query patterns. The post presents an end-to-end setup that uses MongoDB’s built-in OpenTelemetry Activity instrumentation, the .NET OpenTelemetry SDK, Sentry.OpenTelemetry.Exporter, and OTLP ingestion rather than a dedicated Sentry.MongoDB integration. Configuration initializes Sentry with UseOtlp(), subscribes to MongoTelemetry.ActivitySourceName, adds MongoDB instrumentation, and exports spans with AddSentryOtlp(...), while avoiding duplicate spans from overlapping hooks. Query context appears in Sentry traces, span samples, and the Queries experience, with Relay generating parameterized values for aggregation but retaining raw db.query.text per span. The post also demonstrates client-side redaction and describes server-side scrubbing, while exporter propagation bridges preserve correlation with errors and replays.
AI agent orchestration coordinates multiple specialized agents by managing task assignment, shared state, communication, and execution sequencing across complex enterprise workflows. The guide contrasts autonomous agents, which reason about subtasks and adapt to intermediate results, with fixed workflows, and recommends decomposing processes into single-responsibility agents with documented input/output contracts and least-privilege access. It describes centralized, decentralized, hierarchical, hybrid, federated, and emergent patterns, noting that pattern selection trades control, resilience, scalability, and auditability according to risk. Implementation guidance includes assigning human owners, defining accuracy, latency, and escalation targets, establishing failure paths, instrumenting a minimal prototype, and measuring a pilot against documented baseline processes. Organizations using multi-agent systems report 35% faster task completion and a 30% efficiency increase with specialized agents, while high-risk or irreversible actions still require human approval gates and audit trails.
Databricks announces support for Meta’s Muse Spark 1.1 through Model Provider Services (MPS) in Unity AI Gateway, addressing fragmented API keys, access controls, and usage visibility when organizations adopt new models. An MPS is a Unity Catalog securable that stores provider configuration and an encrypted API key, while callers use their Databricks credentials and the gateway attaches the key at request time. The post demonstrates registering Muse Spark through the OpenAI provider type with Meta’s API base URL and Responses API, then governing use with Unity Catalog privileges, model allowlists, policies, rate limits, usage metering, and inference tables. Requests are routed through the gateway, where access and guardrails are applied before reaching Meta; usage, spend, tokens, latency, status codes, and optionally full payloads are recorded for attribution and audit.
Swiggy’s mobile engineering teams faced operational overload as releases, production signals, and reviews required switching among Jira, Confluence, Bitrise, Play Console, Crashlytics, New Relic, Google Sheets, ImageKit, and Slack. The response was an operating layer built around Slack-native agent workflows, reusable AI skills, MCPs, and scheduled jobs connected to release, observability, QA, cost, and internal mobile systems. It can generate readiness updates, group Jira work, identify missing owners and blockers, summarize vitals, analyze alerts, follow up TRM actions, and recommend RAMP, HOLD, or ROLLBACK for staged rollouts by correlating Crashlytics, Play Vitals, and adoption. Humans still approve rollout actions, while recurring channel reports make observability and accountability more consistent and reduce clerical integration work. The stated model lets agents handle mechanical load while engineers retain judgement, ownership, product quality, architecture, and execution.
Sentry's Seer Agent initially parsed user screens using DOM-scraped character-by-character ASCII grids, leading to severe token consumption, model context rot, and an inability to support interactive actions. To resolve these bottlenecks, Sentry replaced visual text scraping with a composable semantic context system where React UI components directly declare their state, metadata, and interactive affordances. A root React context provider maintains a registry of component nodes organized hierarchically through higher-order wrappers, serializing the resulting structure to JSON and backend-generated Markdown within the system prompt. Across twenty-four live pages, this approach reduced dashboard context tokens from roughly 5,500 to 1,300 while maintaining identical satisfaction rates and tool-call volumes across more than 14,000 evaluated conversations.
Unified Logs enters open beta, bringing events from the API gateway, Postgres, Auth, Storage, PostgREST, Realtime, and connection poolers into one searchable dashboard view. Before this, debugging a single request required separate log pages, service-specific filters, and manual correlation across tabs, which slowed investigation and risked losing context. Users can filter by log type, level, status, method, or pathname, search event messages, share URL-based filter states, stream new events live, and zoom into timeline ranges colored by log level. Clicking a row opens a detail panel that presents network timing, gateway, database query, and Auth blocks alongside raw JSON, while Log Drains forward events to external destinations. The feature is rolling out to all projects during open beta, with the classic Logs Explorer still available and feedback requested.
The July 2026 newsletter rounds up ClickHouse releases, community projects, benchmarks, engineering work, and upcoming events in real-time data warehousing. Version 26.6 adds hypothetical skip indexes, cascading refreshable materialized-view dependencies, experimental continuous queries, AI embedding functions, PNG output, CLI documentation, and geospatial improvements. A CostBench comparison running the full analytics path over 28 hours found better cost-performance for ClickHouse Cloud than Snowflake Interactive Tables, which required a continuously running refresh warehouse for pre-aggregated data. Other features cover conversational analytics with ClickHouse Cloud, LibreChat, and MCP; Postgres change-data capture through Debezium and Kafka; local agent queries with chDB; high-concurrency tuning; and Silk, whose fiber runtime targets lower I/O tail latency. Quick reads report ingestion, caching, security, and multi-tenant SQL developments.
Trainy’s Pluto is an open-source experiment tracker that separates analytics metrics in ClickHouse Cloud from relational run metadata in Postgres. Its original metadata store, Amazon RDS Postgres, was too expensive for the volume observed and contributed to slower initial page loads, so Trainy migrated roughly 40–50 GB to ClickHouse Managed Postgres, which uses local NVMe storage and keeps both databases in one account. After migration, initial page loads became 2–3 times faster, while a complex query reported as taking 10–15 minutes previously returned in five seconds; visualization queries over runs with hundreds of thousands of steps typically return in 50–100 milliseconds at the P50. Trainy reports 100% reliable ingestion with zero dropped data points and says the unified stack could support future joins between GPU metrics and run metadata, as well as governed agent access.
Engineers at Netflix required a unified, real-time view of service dependencies to navigate distributed architecture and improve incident troubleshooting. Traditional batch systems introduced stale data, so the team created a streaming-first platform backed by reactive streams and backpressure handling to ingest flow records from multi-region Kafka streams and Server-Sent Events without data loss. The architecture partitions data into physically separate graph and columnar storage layers covering eBPF network flows, IPC metrics, and distributed traces. Network flow ingestion relies on a three-stage distributed aggregation pipeline using consistent hashing to resolve network intermediaries into logical application connections. The resulting production system serves time-travel and topology queries with sub-second latency while continuously updating dependency views.
Lyft developed Aria, an AI-powered assistant allowing approved employees to query ride analytics via natural language through a backend with LangGraph orchestration and SQL generation. However, Aria's user interface was limited to a Streamlit prototype that lacked standard service framework integration, Lyft authentication, and multi-user scalability. To resolve these limitations, a new engineer built a production-grade web client from scratch using Lyft's internal Node.js framework and Next.js as a three-week onboarding assignment. The implementation involved configuring Envoy routing, resolving authentication plugin incompatibilities, debugging service connectivity with Grafana, and managing interface state with an XState state machine. Aria was successfully hardened and launched into production, expanding natural language analytics access across the company.
Targeted structured logging provides a fast way to capture operational behavior in production without requiring new deployments for debugging. Developers benefit most from logging key runtime decisions, multi-step algorithm outcomes, mutating audit operations, and context around non-critical or retried errors. Rather than outputting plain text, applications should record structured key-value pairs that capture who performed an action, what occurred, and associated trace identifiers. Sensitive information such as secrets and personally identifiable data must be excluded or scrubbed, and large unparsed payloads should be avoided to prevent excessive costs. Managing log levels appropriately and treating logs as potentially temporary instrumentation helps maintain actionable telemetry without generating unnecessary noise.
AI-native applications generate large volumes of operational data, while agents and users increasingly require real-time answers from that data. This pressure raises both query concurrency and reliability requirements, with a cited sample of companies using Postgres and ClickHouse showing more than 1,000% data growth in six months and over 85 TB added. The proposed stack assigns Postgres low-latency transactional workloads and ClickHouse real-time analytics, connecting them through PeerDB and ClickPipes CDC with single-digit-second replication, pg_clickhouse query pushdown, and pg_stat_ch telemetry streaming. The conclusion is that AI makes the OLTP/OLAP distinction more important, favoring an open best-of-breed stack over a single platform while preserving each database's specialized role.
Agents often make 5 to 20 tool calls per turn, and many of those calls retrieve data such as prior memory, recent events, or catalog records. When data is remote, round-trip latency compounds across sequential calls, while packet loss can trigger retries that increase both task time and token usage. The article presents chDB, which embeds a full ClickHouse query engine in the agent process, as a way to make data access local and CPU-bound rather than network-bound. For local memory, it combines structured, time-series, vector, and text-index capabilities with local storage and an embedding model, while append-only MergeTree rows preserve belief revisions, deletion markers, and point-in-time history. It also describes syncing trickle-written local memory to a warehouse on a slower cadence and using a materialized-view mirror for frequently accessed current state.
Usage is an Apple ecosystem resource monitor that relies on undocumented APIs vulnerable to silent data structure changes across OS updates. To maintain stability across iPhone, iPad, and Mac without degrading device performance, the development team uses Sentry across separate component projects in a unified workspace. Beyond capturing standard crashes, the team wraps Swift errors with unexpected raw data payloads to quickly diagnose undocumented API structure drift while scrubbing sensitive user values. They also employ Sentry Size Analysis as a regression gate to monitor release payload deltas, preventing unintended asset omissions or bloat from slipping through code reviews. This multi-layered monitoring setup enables the team to detect and resolve platform-induced breakages before most end users encounter them.
Databricks Query Tags give dbt pipelines granular usage attribution when identical query-history rows obscure model ownership, cost, and performance. The dbt-databricks adapter version 1.11+ automatically injects model, materialization, dbt-core, and adapter-version metadata, while profile-level and model-level configurations add custom dimensions such as team, cost center, project, and environment. These tags are stored as a MAP<STRING, STRING> in system.query.history, where SQL can extract them for cost attribution, performance debugging, monitoring, and dashboards. In the reference project, four mart tables accounted for 92% of compute time, whereas staging views and metric views were near-instantaneous. The accompanying open-source project demonstrates Genie exploration, a self-monitoring AI/BI dashboard, metric-view tagging, and deployment with Databricks bundles, while recommending consistent profile hierarchies, environment tags, and limited custom metadata.
amazon.science
Amazon measures carbon intensity across its diverse business operations to track progress toward its goal of reaching net-zero carbon by 2040. For retail operations, the company monitors carbon emissions per unit shipped, achieving a 39 percent reduction by the end of 2025 compared to 2019 baselines. This per-unit decrease stems from targeted investments in electric delivery vehicles, carbon-free energy, smarter package routing, lightweight packaging, low-carbon fuels, and alternative transport modes like rail. To improve industry comparability and transparency, the company updated its economic carbon intensity indicator in 2025 from emissions per dollar of gross merchandise sales to emissions per dollar of revenue. Carbon intensity is also evaluated regionally and nationally to isolate geographic variations and implement localized decarbonization interventions across supply chain networks.
Artemis Security uses ClickHouse Cloud on AWS for real-time threat detection across many terabytes of compressed logs, tens of billions of daily rows, and queries over trillions of rows. To reduce repeated scans, its engineers coalesce hundreds of detection-rule predicates into one query, tagging matching rows by rule ID; batches of more than 100 rules now run in under a second, with a measured 69x speedup. A Claude Code skill called /poke connects ClickHouse system tables, CloudWatch, Datadog, application data, and source code to investigate infrastructure issues through natural-language prompts. For investigative queries over semi-structured JSON, Artemis extracts frequently queried fields into a parallel materialized table and uses a hybrid two-step lookup, producing 30–60x faster queries and up to 400x lower CPU consumption.
Automated evaluations often miss unknown failure modes in AI agents because developers only write tests for anticipated errors. While building an itinerary agent for AI Engineer World's Fair, an open-weight model routed a speaker query to a tool returning only tracks, leading the model to hallucinate famous speakers and falsely claim the tool provided that data. Because a tool was executed, the trace appeared grounded until inspectable tool outputs revealed the discrepancy. To resolve this, the author retained the inexpensive model, corrected query routing, tightened system prompts against ungrounded entities, and added a custom entity-diffing eval in CI. Ultimately, directly reading agent telemetry traces alongside errors and logs is essential for diagnosing root causes and deciding trade-offs between model costs, prompt adjustments, and routing fixes.
LogHouse now stores 431 PiB of uncompressed data across 1.59 quadrillion rows, spans more than 30 regions across three cloud providers, and serves typical queries in a few hundred milliseconds. The platform grew 23x from 19 PiB in two years, while peak ingestion reached 80 GiB/s and 190 million rows per second. Its write architecture uses local geosharding, multiple cells in busy regions, and ClickHouse Async Inserts to combine small incoming writes into larger parts without overwhelming merges. On the read side, a single Distributed table hides the cell topology, while unavailable shards remain visible by default rather than producing silently incomplete results. Current work includes reducing index and metadata memory, improving async-insert durability, collecting system data from object storage, and expanding OpenTelemetry traces and metrics.
Ramp describes an architecture for scaling risk operations as payment volume, payment rails, partners, and country coverage expand, rather than letting headcount grow with the business. Agents handle universal intake, gather business context, classify requests, and route work, while machine-learning models trained on millions of historical data points and approved policies make autonomous risk decisions. Operators can modify agent skills and tool configurations without engineering involvement, deploy changes in shadow mode, and rely on asynchronous execution, provider failover, and centralized observability. In payment-risk workflows, structured operator feedback produced a benchmark of more than 1,000 operations covering tool-call trajectories, operator alignment, and downstream outcomes, enabling separate evaluation of agents and policies. Ramp rolls agents out beside operators, then scales operation types and dollar volume using performance thresholds and capped exposure budgets.
The best engineering reads, once a week.