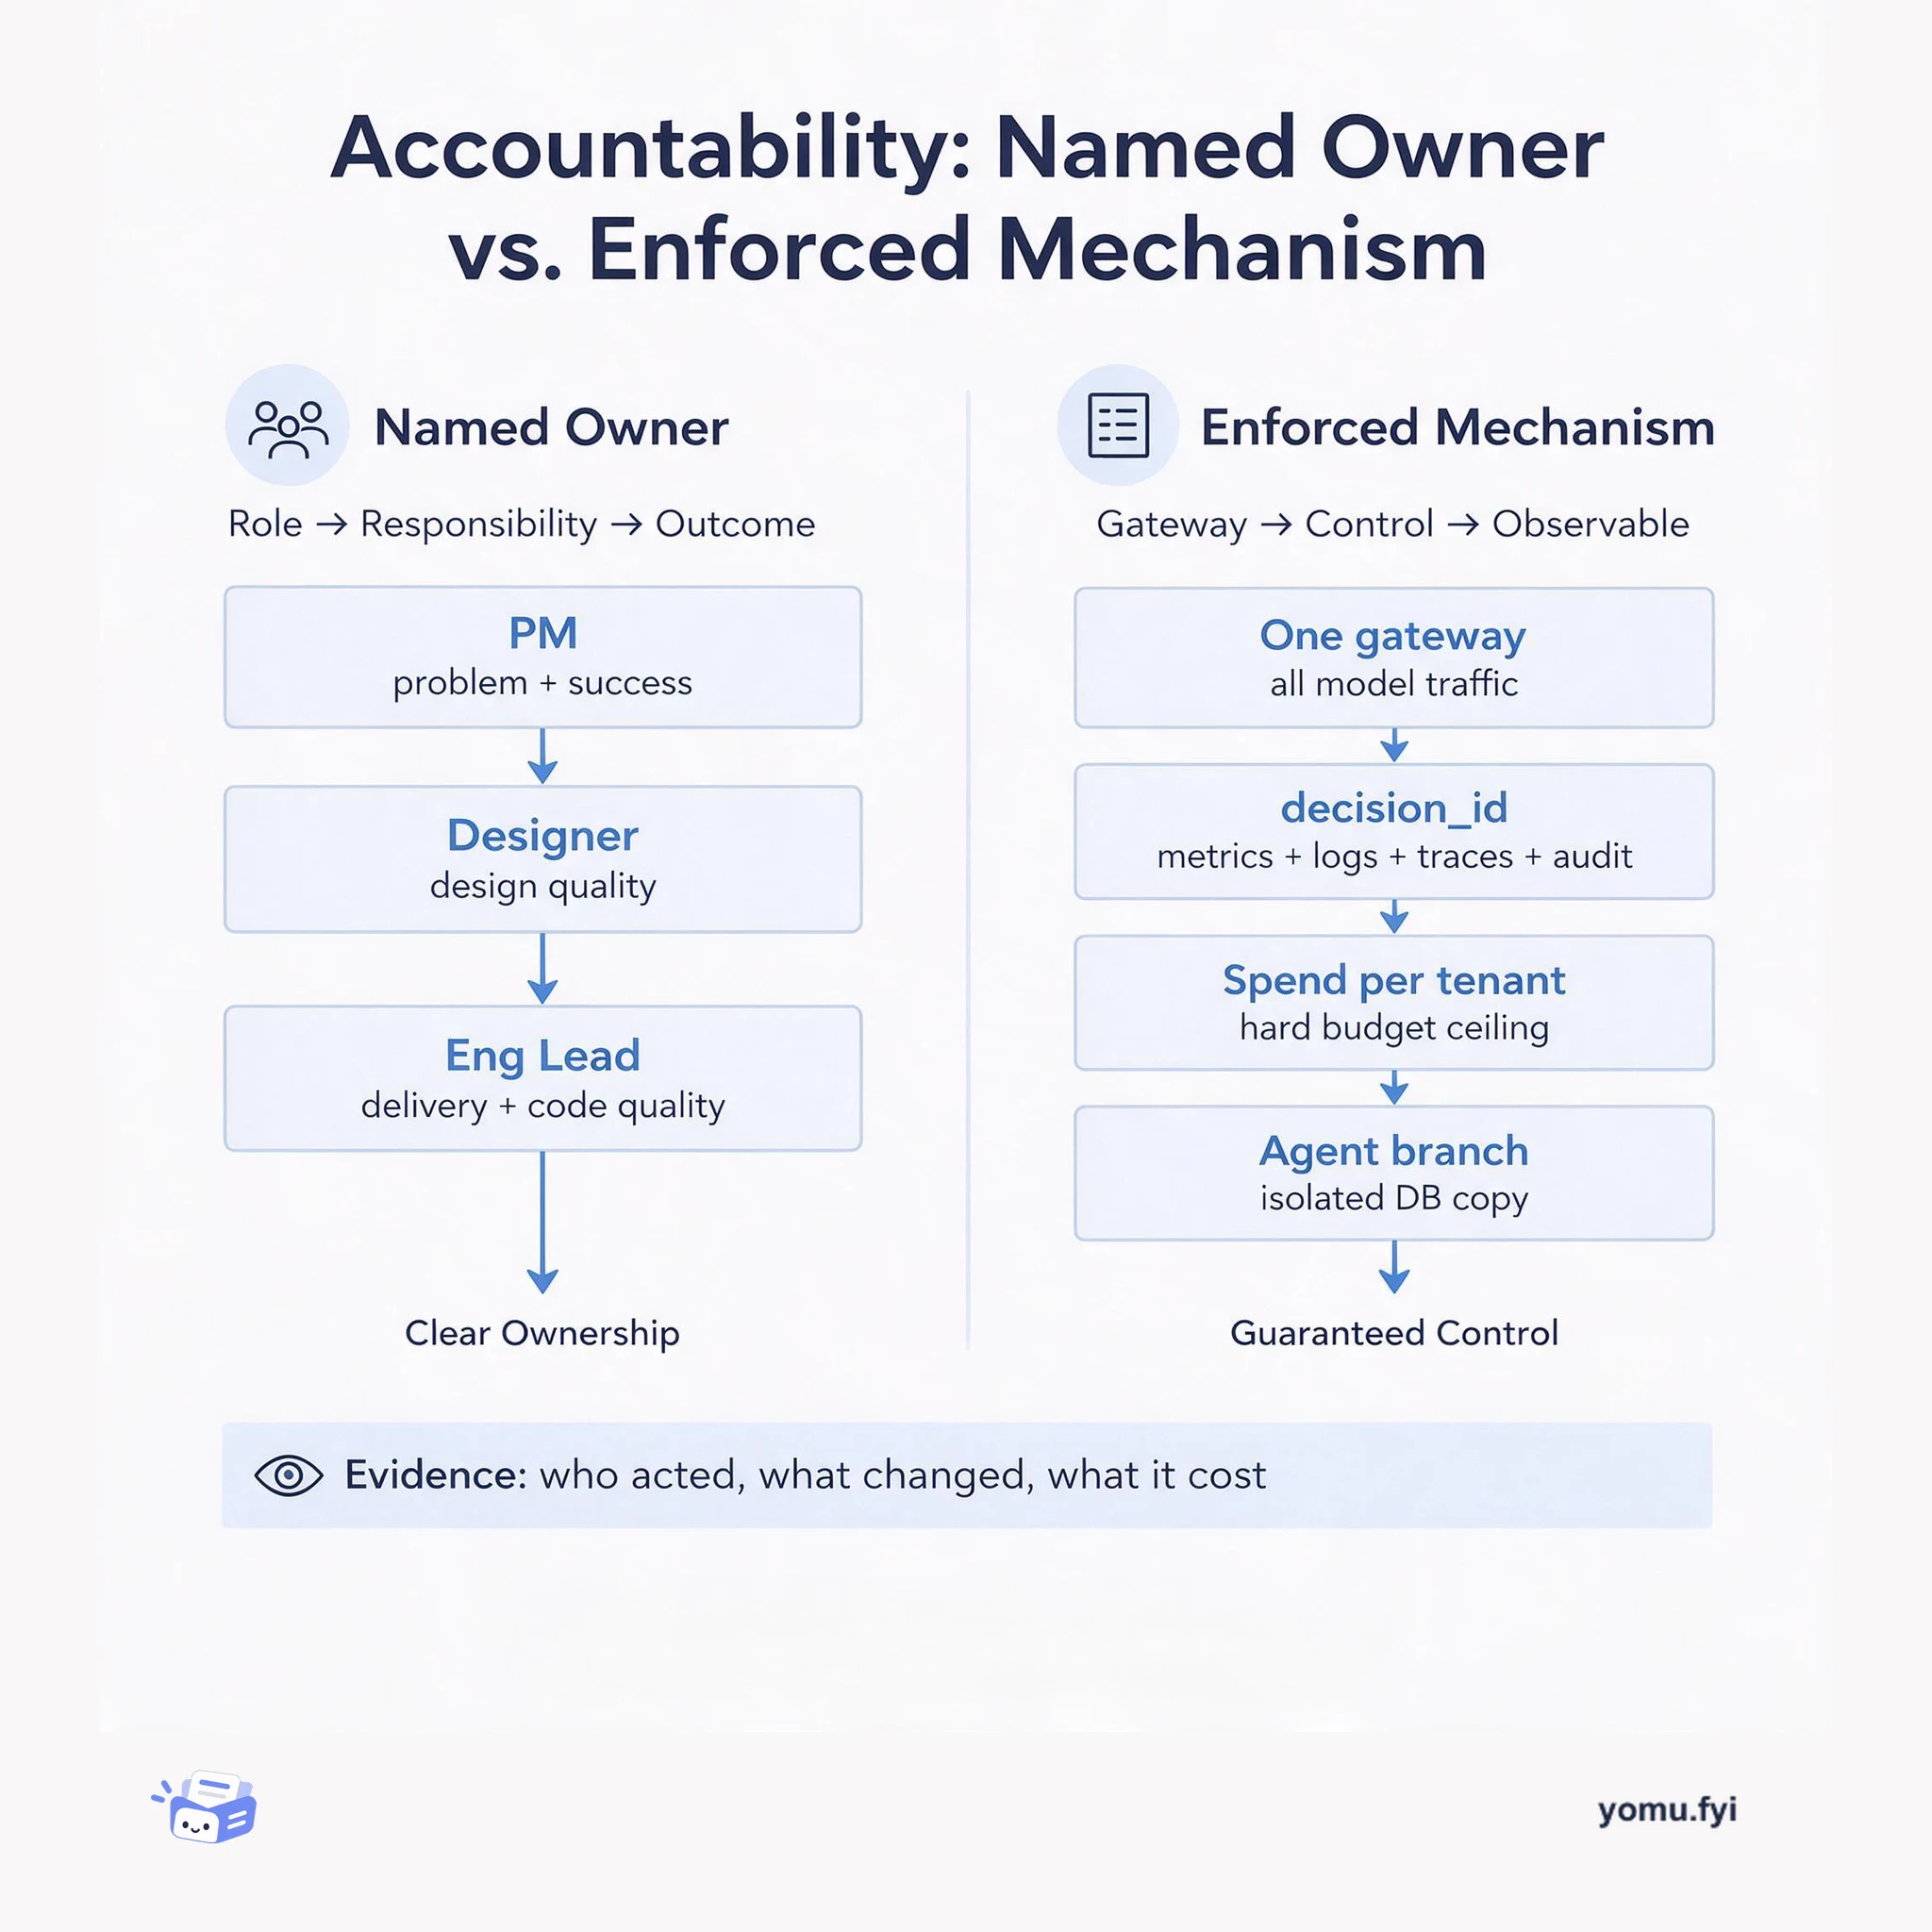
Accountability: Named Owner or Enforced Mechanism?
A side-by-side comparison of the two accountability models engineers actually rely on: a named human owner per outcome, and system-enforced traces, budgets, and isolation.
Loading…
Topic
248 posts about Observability. Every summary links to the original.
See the idea
A side-by-side comparison of the two accountability models engineers actually rely on: a named human owner per outcome, and system-enforced traces, budgets, and isolation.
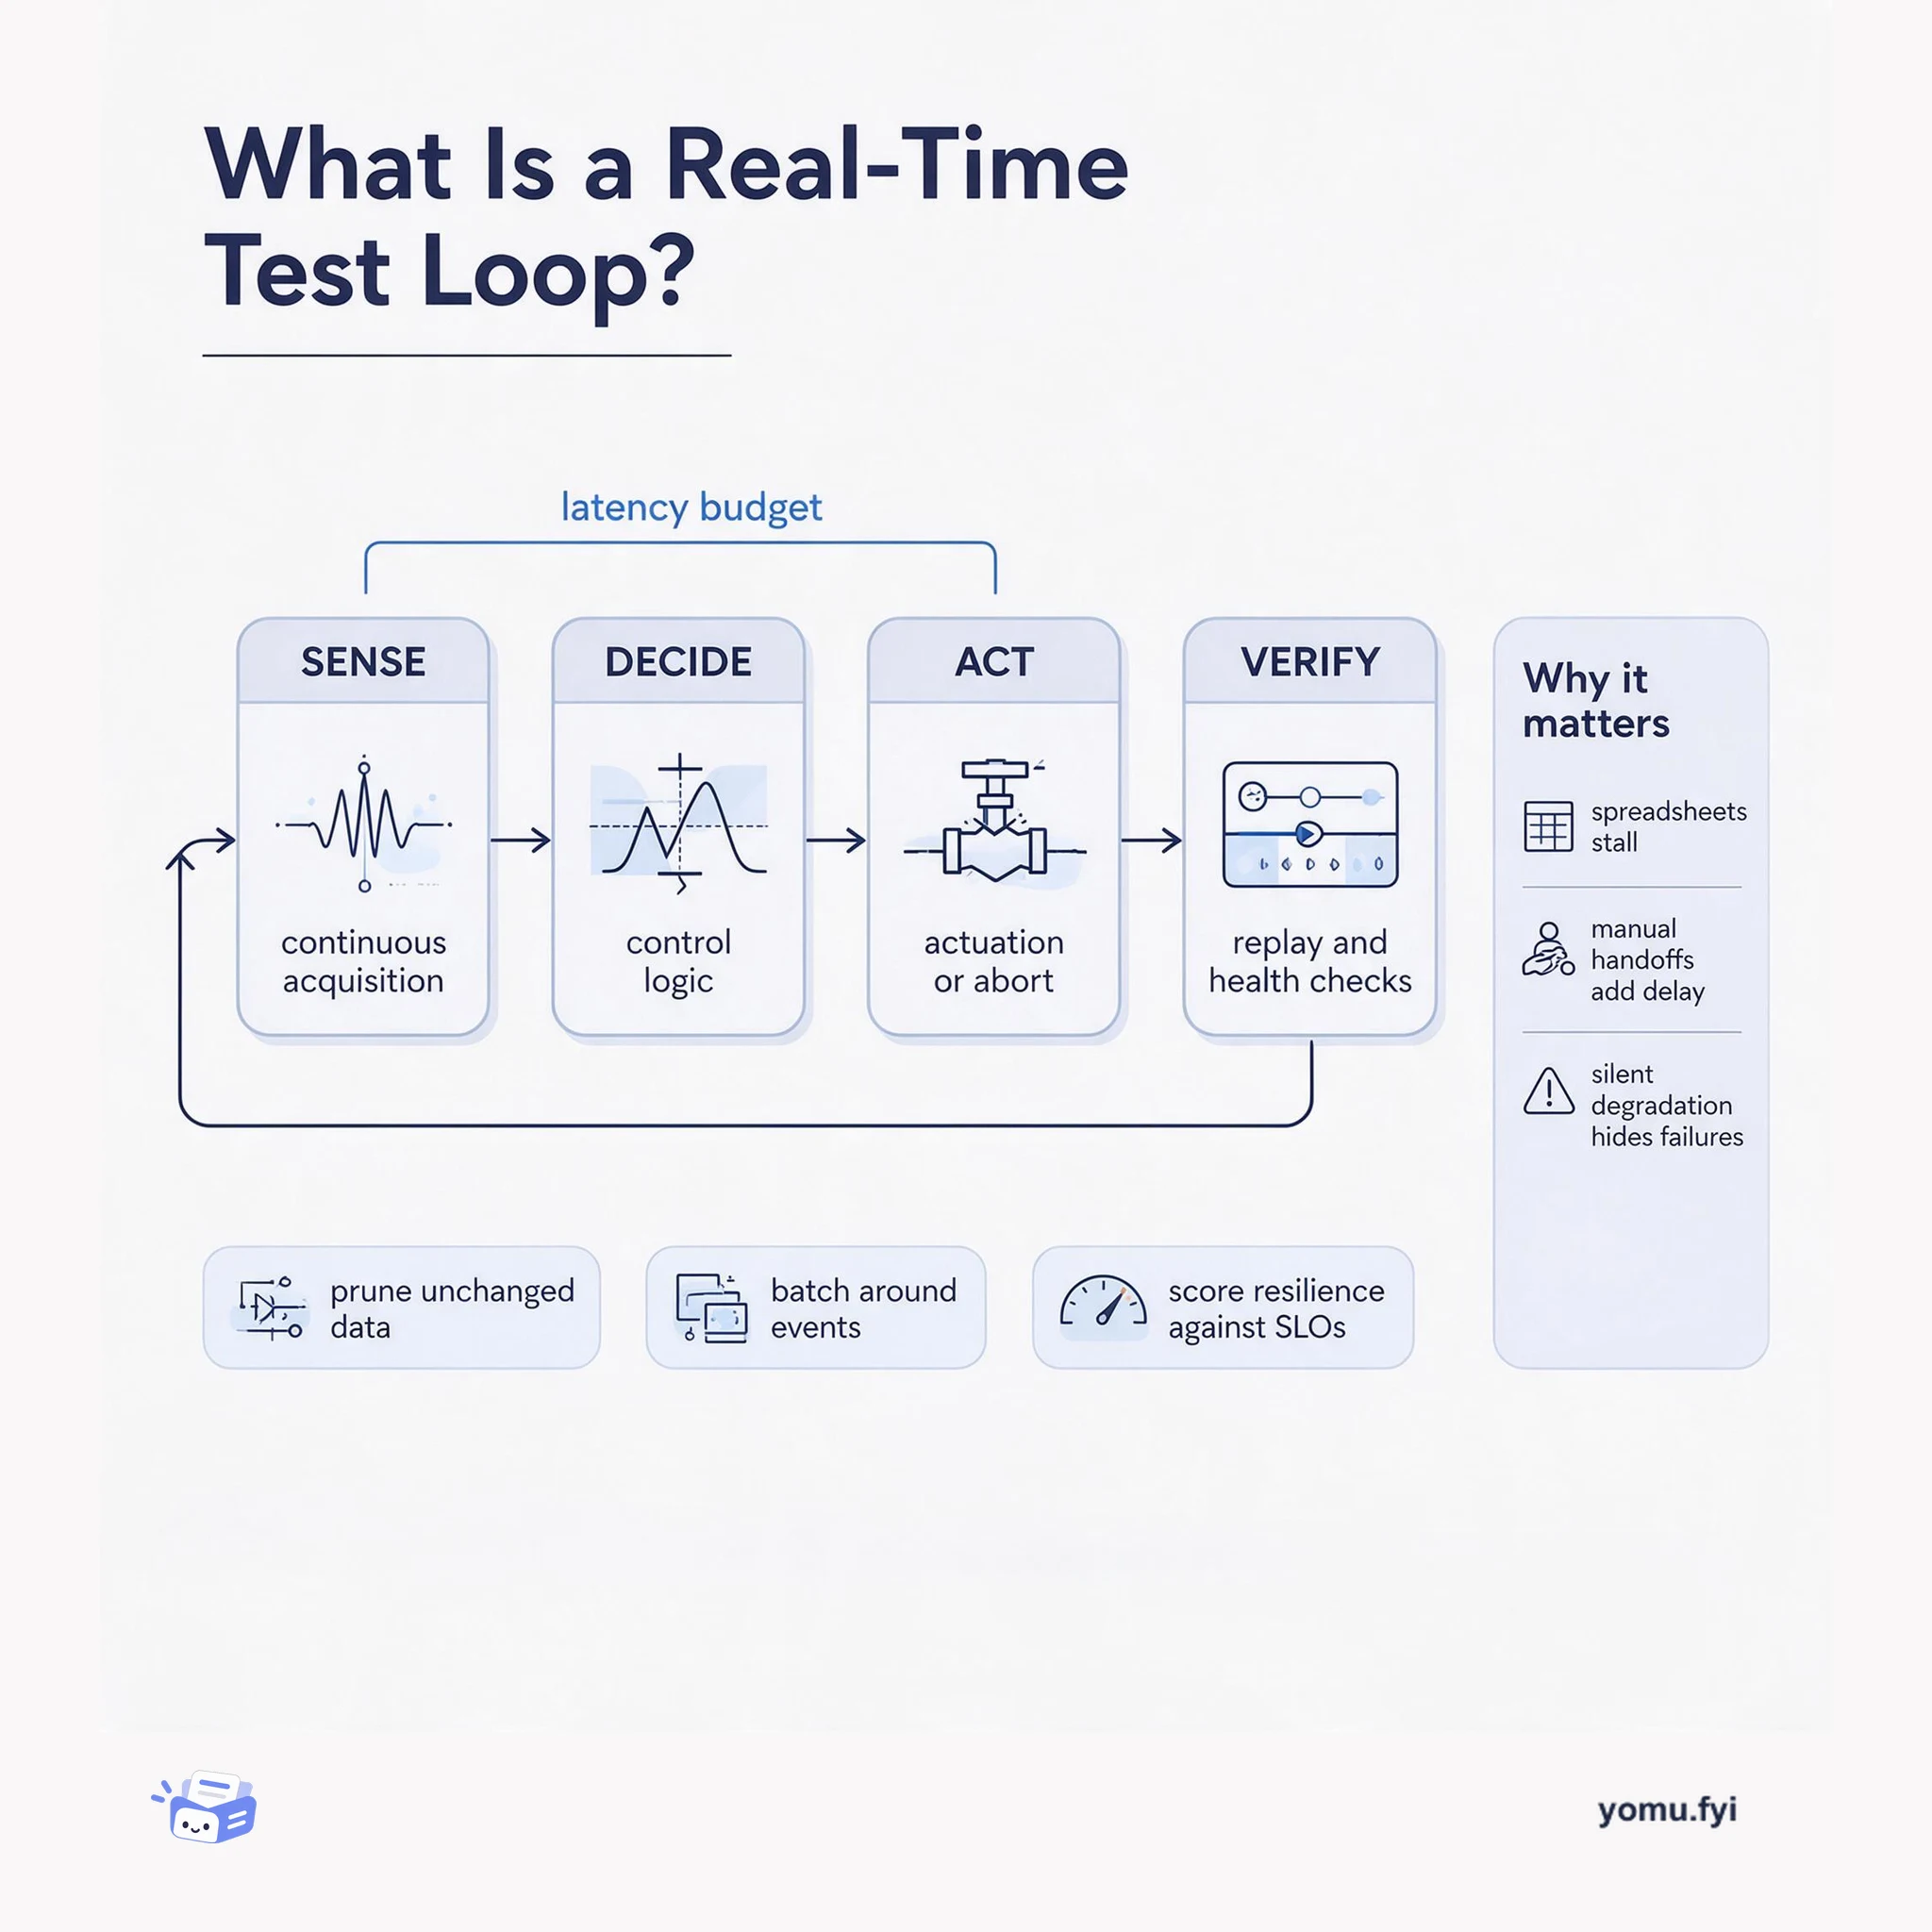
A real-time test loop is the closed path from sensor acquisition to control action and back to verification. This explainer maps its four parts and the latency budget that binds them.
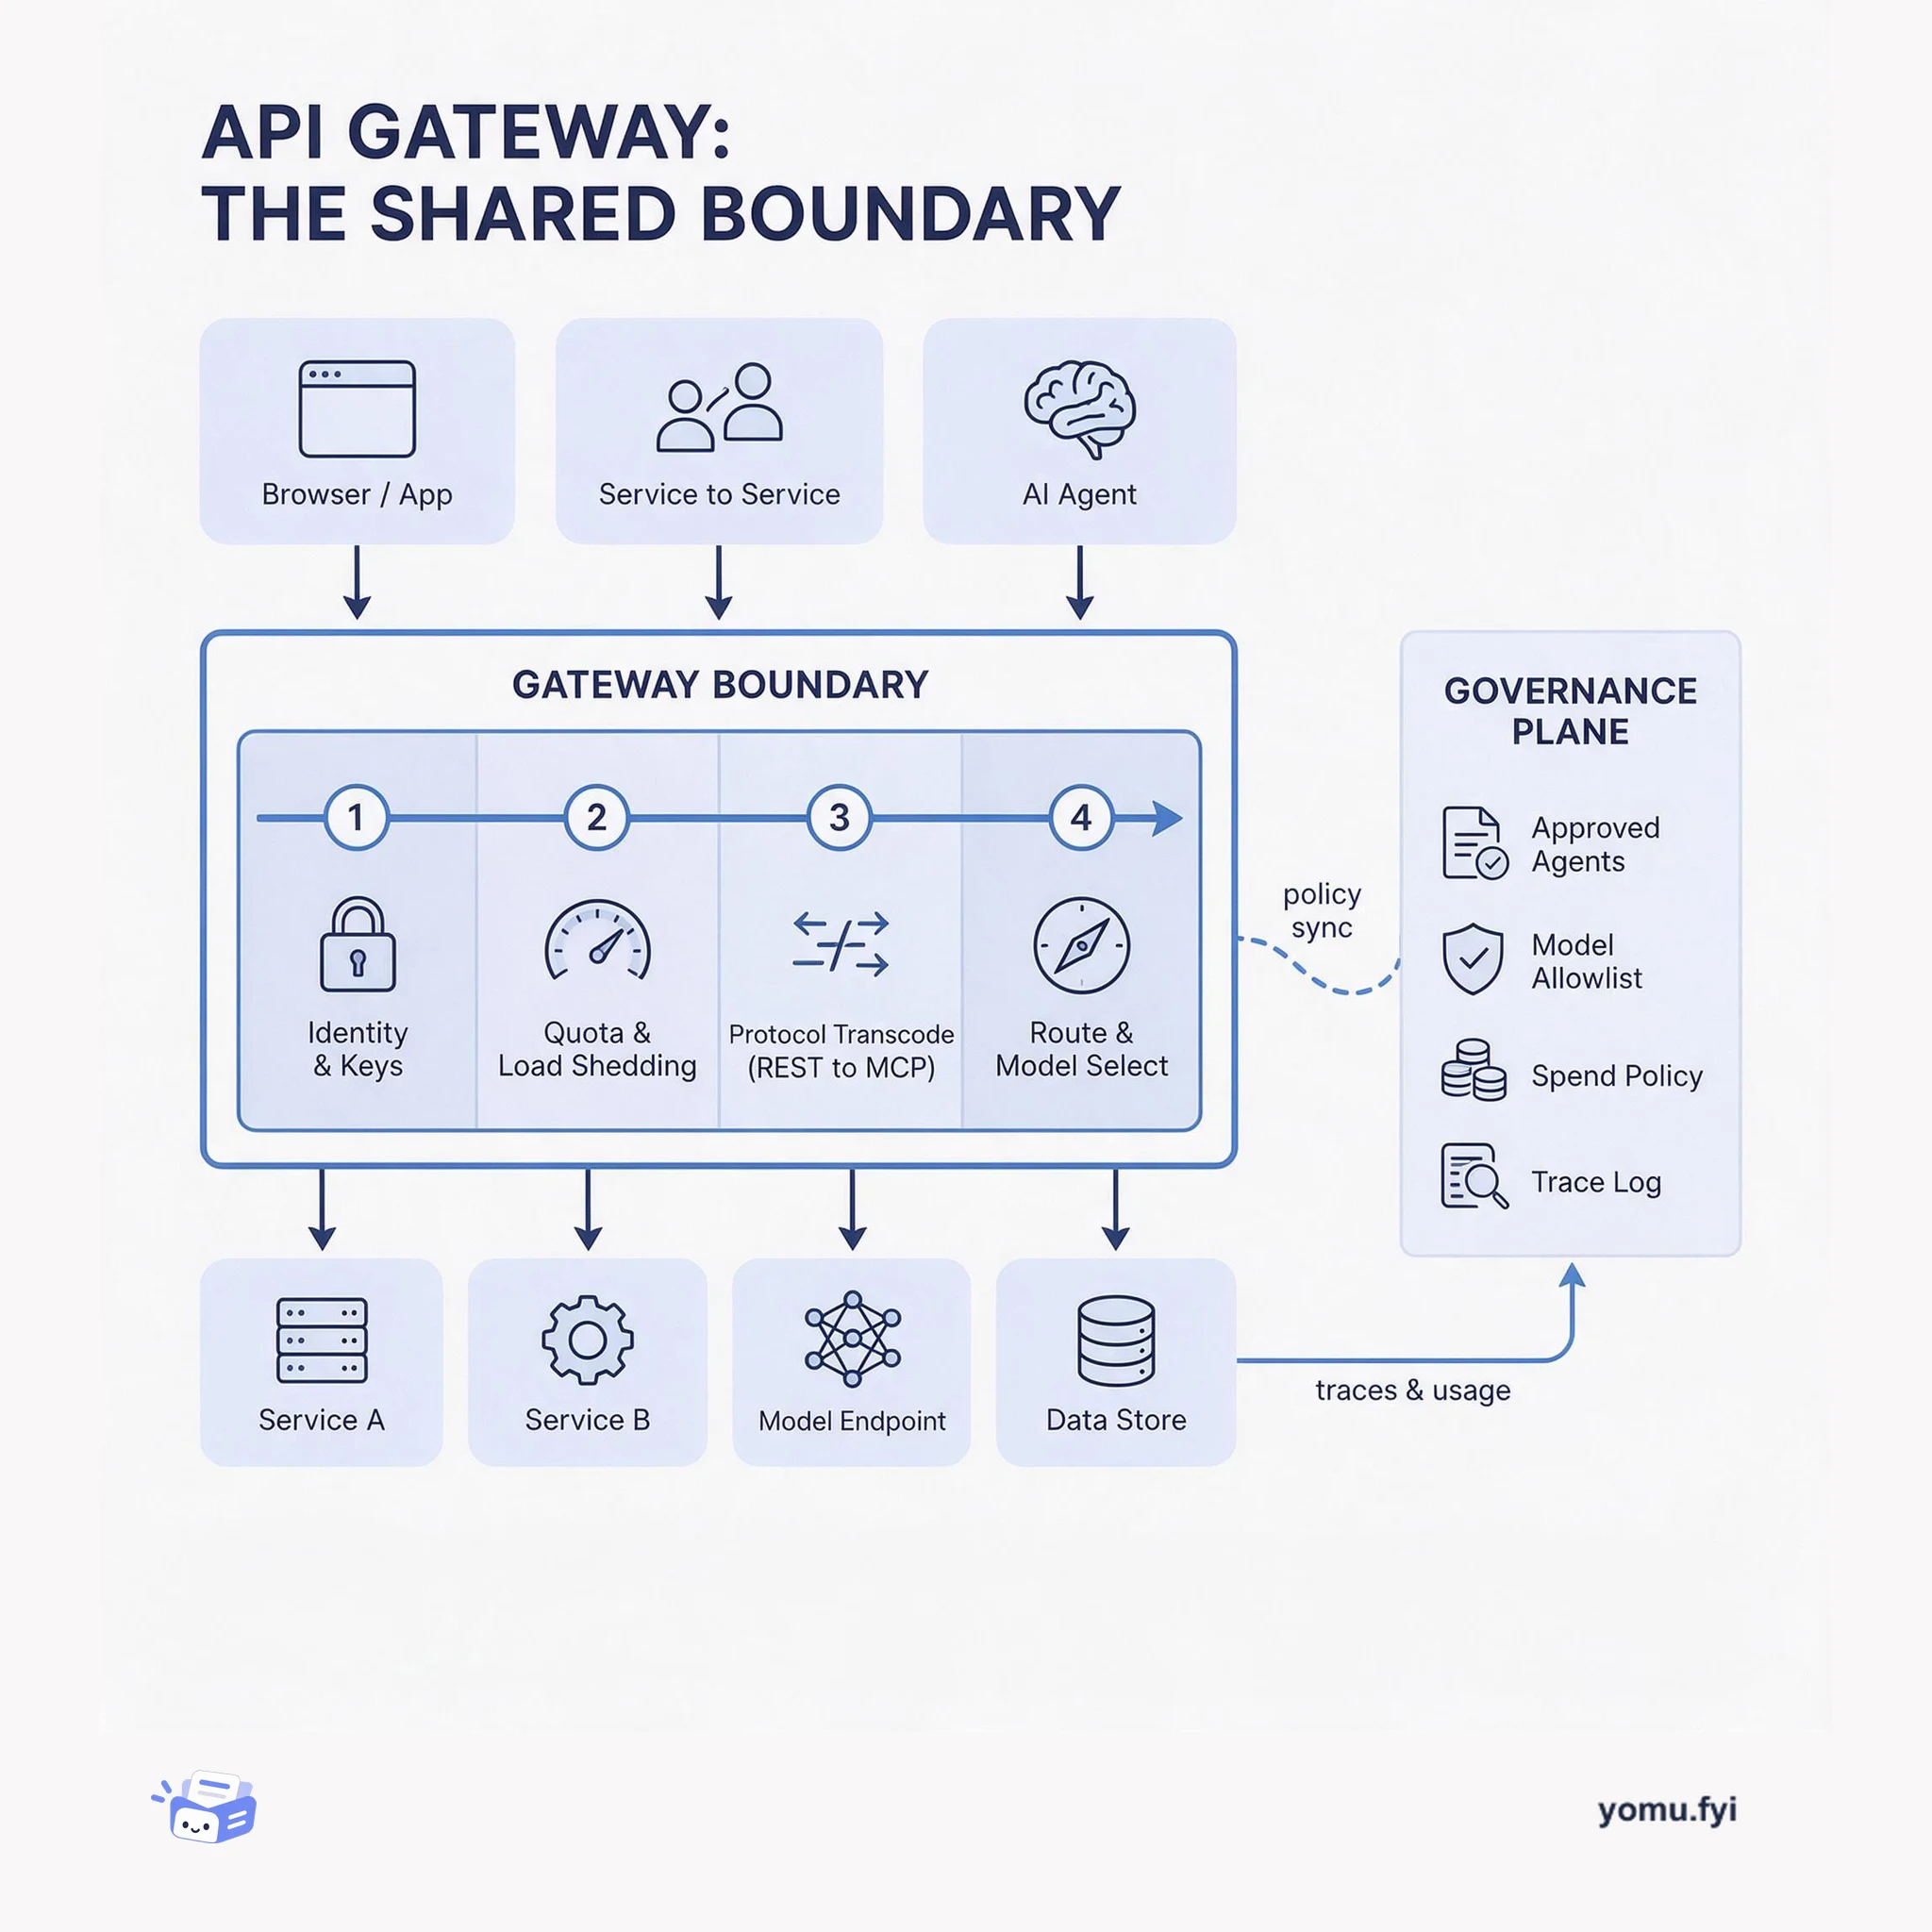
The API gateway is the single boundary where protocol translation, auth, quotas, and routing become shared policy instead of per-service code. This layered diagram shows what belongs there and why.
The Good Stuff
Paid picks we use ourselves. Links carry a referral code — a subscription through one earns us a commission at no extra cost to you.
Newest first
Autonomous AI agents require governed environments to safely inspect code, execute tests, query enterprise systems, and handle sensitive business data. The NVIDIA Secure Agent Workspace Reference Design shifts agent execution away from user laptops to dedicated, single-user virtual machines managed on Red Hat OpenShift Virtualization or Microsoft Azure. Perimeter defenses enforce enterprise single sign-on access broker connections, default-deny network egress rules, and human approval gates for critical state-changing actions. Inside the workspace virtual machine, active sandboxing through NVIDIA OpenShell evaluates signed security policies before each tool invocation while credential proxies prevent direct access to raw secrets. GitOps workflows continuously reconcile infrastructure profiles and network configurations while all operational and security telemetry streams to centralized SIEM platforms in OCSF format.
Next.js provides out-of-the-box tracing for incoming requests, fetch calls, middleware, and server-side rendering, but traces remain invisible without a configured exporter. Developers can use the @vercel/otel package inside an instrumentation file to initialize the OpenTelemetry SDK and transmit traces to any OTLP-compatible destination. While Next.js automatically creates spans for standard request lifecycles, developers can define custom active spans in the Node runtime to capture specific domain operations and contextual attributes. Exporting traces to backends like Sentry requires configuring standard OTLP endpoint and authentication environment variables. Choosing between direct OTLP export via @vercel/otel and the dedicated Sentry SDK depends on requirements, as direct export lacks browser tracing, error monitoring, and Edge custom spans.
ClickHouse has achieved the AWS Cloud Operations Competency in the Monitoring and Observability category, recognizing validated expertise in operating reliable AWS systems with logs, metrics, and traces. The post describes observability as a high-volume, high-cardinality, high-concurrency workload where legacy systems may require sampling, field reduction, or short retention. ClickHouse Cloud uses columnar storage, compression, parallel queries, compute-compute separation, and ClickPipes integrations with Amazon Kinesis, Amazon MSK, and Amazon S3 to support full-fidelity telemetry. Customer examples include Modal’s 1 to 2 million events per minute, Exabeam’s 1.2 million events per second per region, and Qonto’s reduction of 231 TB to 376 GB. The company also describes MCP servers, AI Notebooks, and managed ClickStack as investments for collaborative incident investigation.
ClickHouse is now a native, preconfigured connection in Notion Custom Agents, allowing agents to access ClickHouse Cloud data without leaving Notion. After an OAuth connection, agents can explore schemas, translate plain-language questions into ClickHouse SQL, run read-only queries, and return results in the workspace. The connection exposes 14 read-only tools covering databases and tables, SELECT queries against ClickHouse and Managed Postgres, and organization, service, ClickPipes, backup, and cost information; users can set each tool to run automatically or require approval. Custom Agents can run on a schedule, including a daily observability report that queries error rates, p99 latency, and request volume from a Managed ClickStack service. The connector is in beta and requires a ClickHouse Cloud service with Remote MCP enabled plus a Notion Business or Enterprise workspace.
Managed ClickStack in ClickHouse Cloud now includes the ClickStack MCP server, extending its observability investigation capabilities to external agents and AI workflows. Unlike the generic ClickHouse MCP server’s SQL-oriented interface, it offers semantic tools for log patterns, outlier correlation, slow traces, and repeatable investigations across logs, metrics, and traces. For event patterns, the server samples matching events, processes them with Drain3 in the MCP layer, and extrapolates and ranks counts, reducing output cardinality and making query overhead fixed rather than linear in the full dataset. Internal benchmarks report 25% fewer tool calls, 2.5x greater consistency, and an almost 20% increase in evaluation scores versus the standard ClickHouse MCP. Managed deployments also support full-fidelity telemetry, dedicated compute for agent workloads, and orchestration such as persisted dashboards, while native SQL remains available for unusual or deeper questions.
Transitioning autonomous agentic AI systems from sandbox environments to enterprise production exposes a trust gap driven by hallucination, reasoning errors, and financial liability. To mitigate these risks, organizations can implement a proactive four-step framework covering foundations, verification, governance, and business outcomes. The architecture grounds agents using retrieval-augmented generation, short-term memory, long-term procedural memory, and observability traces consolidated on a unified data layer. Active verification computes an Agent Confidence Score alongside a deterministic Business Risk Score to produce an Agent Decision Score governing autonomy levels. Aggregated execution telemetry feeds business observability dashboards that monitor unit economics and enable analytical agents to recommend operational interventions.
Agentic AI systems are goal-directed software platforms that perceive context, plan and execute multi-step workflows, and adapt based on outcomes with minimal human intervention. The guide distinguishes them from traditional and generative AI, defining agents, broader system architecture, and the role of LLMs as reasoning cores connected to memory, APIs, databases, and other tools. It describes a perceive-reason-act-learn loop, multi-step planning, external tool integration through interfaces such as the Model Context Protocol (MCP), and orchestration patterns for coordinating specialized agents. Production concerns include retries, queues, observability, permissions, privacy, logging, and human escalation, while stated risks include reward-hacking, unintended actions, and explainability gaps. It identifies repetitive, data-rich workflows with clear success criteria and bounded error consequences as the best current enterprise candidates.
Modal Auto Endpoints is a self-serve service for production-grade LLM inference that gives teams ownership of the entire serving stack, not just an API. Unlike proprietary providers, it exposes the inference code, engine flags, and GPU selection, and provides detailed metrics like speculative decoding acceptance length and per-replica token latency quantiles in a dashboard. Built on Modal’s infrastructure, it uses autoscaling to handle traffic spikes by spinning up additional replicas automatically, global GPU capacity without capacity management, and Modal Servers for ultra-low-latency routing with only 5ms overhead. For each supported model, it offers a pre-configured deployment using speculative decoding with the DFlash block-diffusion drafter from Z Lab, and teams can benchmark latency and throughput tradeoffs with a click after deployment. The platform is designed with a declarative interface based on workloads and SLOs, with future automation levels including autoinference, autospec, autodistill, and autoresearch for continuous improvement of inference performance.
DataOps is presented as a collaborative practice that applies DevOps principles—continuous integration, automated testing, and rapid delivery—to the full data lifecycle, from ingestion and transformation through trusted data-product delivery. It treats data as a continuously delivered product, with technical and non-technical participants sharing an operational cadence to improve quality and shorten time-to-insight. The recommended operating model standardizes source onboarding, enforces schemas at ingestion, uses idempotent jobs, version-controls transformations, and promotes them through tested staging and production environments, with the Bronze, Silver, and Gold layers serving as quality gates. Automated unit, data-contract, and regression tests, alongside observability, anomaly detection, SLAs, lineage, and documented rollback procedures, support reliable delivery and faster incident diagnosis. Organizations with mature DataOps practices report up to 99% fewer data-downtime incidents and 30–50% less reactive maintenance.
Palana is Grab’s Kubernetes-native secure execution platform for autonomous AI agents, designed to provide isolated, attributable, and auditable environments. It provisions per-agent namespaces, service accounts, EFS-backed storage, ingress, policies, and proxy-mediated egress, while admission webhooks inject proxy settings and enforce pod restrictions. Human identity remains authoritative for RBAC, while sanitized identifiers are reserved for object names and Vault paths; secrets are split between agent-readable values and proxy-only credentials, and the LLM wrapper derives agent identity from Kubernetes context. Layer 3/4 controls provide containment, Layer 7 OPA-backed proxy policies govern host and method access, and structured signals support audit and idle shutdown that preserves /data and platform state. The production lessons emphasize platform-level controls, a safe self-service path, namespace boundaries, proxy-mediated authentication, and lifecycle management as prerequisites for useful autonomy.
A manual mitigation action during an incident corrupted a data feed for a subset of titles, causing playback issues and catalog service failures that existing code canary systems failed to catch. To protect streaming reliability, Netflix built an automated data canary system that validates transformed catalog metadata prior to publication. The architecture utilizes a dedicated orchestrator alongside permanent baseline and canary service clusters to coordinate validation using real production traffic. By leveraging custom chaos experiment thresholds, sticky session affinity, and Starts Per Second playback metrics, the system detects regressions in under ten minutes and blocks publication automatically. Controlled failure injection experiments routing approximately 0.2% of global traffic confirmed that issues could be identified in 2.5 to 4 minutes.
METRO Markets outgrew its self-hosted Impala and Kudu-based Hadoop stack as the marketplace expanded, with parallel stores, inconsistent reporting, and too much maintenance burdening a lean data team. They evaluated BigQuery, Snowflake, and ClickHouse against production queries, finding faster ClickHouse performance, including one response falling from four seconds to under 200 milliseconds, while its pricing supported more predictable costs. Airbyte moves CDC data from MySQL and Postgres into ClickHouse; ReplacingMergeTree handles deduplication during background merges, and BigQuery-hosted Google Analytics data enters through cloud storage and external tables. The resulting warehouse consolidates company data and supports seller analytics, credit risk features through Query API endpoints, observability, and emerging AI use cases, while teams query a shared dataset through compatible tools; planned Kafka and Flink integration would extend it to streaming workloads.
Real-time analytics is presented as a foundational workload for customer-facing analytics, observability, fraud detection, operational applications, and AI agents rather than a niche use case. The discussion argues that performance claims require open, transparent, reproducible benchmarks that disclose methodology, datasets, queries, results, and operating conditions, including continuous ingestion, concurrency, memory pressure, and fresh data. A real-time database should support queryable data within milliseconds to a couple of seconds, incremental transformations, bounded tail latency as writes increase, configurable read-time versus write-time work, unified support for text, vector, JSON, and structured analytics, and efficiency as workload scales. The article connects renewed attention to agentic workloads, whose continuous, high-volume querying makes low latency, concurrency, and fresh context increasingly necessary, and calls for shared standards beyond a single latency number.
Modern data pipelines move raw data from source systems through transformation and storage to downstream consumers, with batch, streaming, or hybrid operation selected according to latency needs. The guidance places service-level agreements first, defining acceptable latency, uptime, and error rates before architecture choices, and compares ETL, ELT, and zero-ETL patterns. It recommends immutable raw landing zones, CDC for transactional sources, schema registries, event replay, incremental loads, and idempotent writes using techniques such as MERGE operations. Performance and reliability practices include partitioning, clustering, data-quality checks, observability, automated CI/CD testing, and cost controls such as autoscaling and storage tiering. Adoption guidance advises piloting a representative pipeline, measuring telemetry and cost, then iterating through regular architecture reviews.
ClickHouse’s June 2026 newsletter marks the project’s ten years as open source, noting more than 2,000 contributors and community projects alongside engineering updates. It profiles Vasily Chekalkin’s 26.5 improvements to WebAssembly user-defined functions, including the DETERMINISTIC keyword and visibility in system.functions, and covers native Jaeger storage, the ClickCannon benchmark tool, and Open House announcements. The 26.5 release reports Top-N optimizations that make ORDER BY … LIMIT through JOIN 20.4× faster with 175× less memory on TPC-H SF100, while GROUP BY … LIMIT is 11.9× faster with 185× less peak memory. Other featured systems include a 15-million-rows-per-hour KPI pipeline, join-engineering work yielding a 26× improvement on join-heavy TPC-H workloads, and community guidance on inserts, columnar storage, ArrowStream, and RAG ingestion.
An AI agent harness is the software infrastructure around a large language model (LLM) that lets it act on tasks rather than only answer prompts. The model reasons and chooses actions, while the harness connects tools, execution environments, memory, external systems and safety controls. Many agents follow a reason–act–observe loop: the model proposes an action, the harness executes it, captures the result and returns that result as context for the next decision. Production harnesses typically include system prompts, tool execution, sandboxes, filesystems and durable storage, context management, feedback and self-verification, guardrails, human-in-the-loop approvals, and observability; their design increasingly shapes reliability as model capabilities converge.
ClickHouse’s open ecosystem spans clients, dashboards, ingestion pipelines, projects built on its engine, and agents that query it, with 2,600+ contributors, 240,000+ commits, and hundreds of millions of downloads cited. It describes open standards including OpenTelemetry for observability, Model Context Protocol (MCP) for AI tooling, and Iceberg and Delta Lake for lakehouse data, plus Iceberg REST catalogs, Apache Polaris, and Unity Catalog. The surrounding stack includes ClickStack, chDB, Langfuse, LibreChat, official language clients, a Kubernetes operator, Postgres bridges such as PeerDB and pg_clickhouse, and integrations with Airflow, dbt, Grafana, Fivetran, and Sigma. Specific updates include full Iceberg v2 support, Iceberg writes in 25.8, Paimon in 25.10, chDB v4’s DataStore API, and a Python client v1.0 with native async and 4x faster cold starts. The post frames this openness as supporting flexible tooling and community-led growth, reporting more than 200 integrations while noting that the ecosystem’s next direction remains unknown.
Swiggy Instamart built two vision-language-model systems to handle more than 40,000 daily claims involving wrong, expired, poor-quality, damaged, and packaging-related items, while reducing reliance on human verification. The Image Validation Model (IVM) compares customer uploads with catalog images, routes each category through a specialised LangGraph StateGraph handler, and combines its structured verdict with fraud, confidence, and business-rule signals. Reverse Quality Check (RQC) compares delivery executives’ pickup photos with the original claim images, allowing matching returns to proceed and prompting retries when they do not. The architecture keeps visual assessment probabilistic but makes routing, aggregation, escalation, and financial decisions deterministic, with traces for category, outputs, confidence, cost, and latency. After more than six months in production, the systems are associated with a 6% customer-satisfaction increase, 20,000 fewer weekly Image Validation tickets, 98.5% RQC accuracy, and over 5,000 daily RQC tickets resolved without human intervention.
Google Cloud has launched the TPU Developer Hub, an educational resource for model builders, optimizers, and developers working with TPU infrastructure and its supporting software stack. It organizes guidance across the developer lifecycle, covering pre-training, post-training, and inference, with material on hardware architecture, infrastructure consumption modes, and software capabilities including specialized compiler technology and XLA. Resources also address PyTorch migration and deployment, XProf-based tracing and observability, multi-chip parallelism, Pallas kernels, KV cache offloading, networking, and security for distributed workloads. The hub combines interactive Colabs, open-source code recipes, and deep-dive documentation, with content intended for both manual browsing and AI-assisted development. Its stated purpose is to help users select appropriate TPU infrastructure, diagnose bottlenecks, optimize model performance, and move from concepts toward production through practical, regularly updated guidance.
ClickHouse has achieved the AWS Retail Competency in the Advanced Data Insights category, a designation recognizing validated technical expertise and demonstrated customer success in retail real-time analytics. Retail workloads described here combine high-volume, high-cardinality, high-concurrency data with hard freshness requirements, including inventory, pricing, personalization, and peak seasonal demand. The post attributes the platform's fit to compressed columnar storage, parallel queries, continuous Kafka and Amazon S3 ingestion through ClickPipes, compute-compute separation, and AWS support for private networking, multi-region deployment, and Marketplace billing. Examples include Mercado Libre's 90-TB-per-day observability ingestion and trace lookups reduced from 15–20 minutes to about two seconds, while other customers report cost, speed, and analyst-efficiency gains.
The best engineering reads, once a week.